


Contents
Scroll to:
https://doi.org/10.5800/GT-2024-15-4-0770
EDN: PEIYOD
Scroll to:
Quantitative assessments of seismic hazard in seismically active areas depend to a large extent on the intensity-distance attenuation laws which are used in calculations. To account for epistemic uncertainty in the nature of seismic effects, it is recommended to perform probabilistic seismic hazard analysis using several different attenuation relationships. The most effective tool for their selection is the ranking procedure which consists in attributing a weight to one or another equation depending on the degree of compliance between the equation-based seismic effects and the real experimental data available for the region under study. The article presents the results of ranking intensity attenuation laws derived for Central Asia. Ranking was carried out by LH and LLH methods. Based on the ranking results, these has been made a generalized attenuation model used subsequently in PSHA for Uzbekistan. Consideration was given to three alternative models of seismic sources: area sources, active faults, and seismogenic zones. Parameterization of the models considered involved determining seismic potential, frequency of recurrence of earthquakes of different energy levels, and the predominant type of motions in each earthquake source. Seismic zoning maps of Uzbekistan in points of the MSK-64 intensity scale have been compiled for different probabilities of occurrence of non-exceedance level earthquakes in the next 50 years.
Ibragimov R.S., Ibragimova T.L., Mirzaev M.A., Ashurov S.H. RANKING OF SEISMIC INTENSITY ATTENUATION LAWS AND MODELING OF SEISMIC SOURCES FOR SEISMIC HAZARD ASSESSMENT IN UZBEKISTAN. Geodynamics & Tectonophysics. 2024;15(4):0770. https://doi.org/10.5800/GT-2024-15-4-0770. EDN: PEIYOD
Current building codes of Uzbekistan are based on earthquake hazard measured on macrointensity scale. In 2017, in terms of the probabilistic-deterministic approach towards seismic hazard assessment [Riznichenko, 1985; Riznichenko, Seiduzova, 1984], a set of general seismic zoning maps (GSZ-2017) was developed for the territory of the Republic of Uzbekistan [Artikov et al., 2018, 2020а]. These maps for different probabilities P (Р=0.90; Р=0.95; Р=0.98 and Р=0.99) of occurrence of non-exceedance level earthquakes in the next 50 years provide seismic hazard values in terms of macroseismic intensity scale, ground velocities and ground accelerations. In 2019, as a normative seismic zoning map of Uzbekistan, the Ministry of Construction RUz adopted the MSK-64-based seismic hazard map corresponding to the probability Р=0.98 of occurrence of non-exceedance level earthquakes in the next 50 years (2500-year recurrence interval). A fragment of the normative seismic zoning map for the study area is shown in Fig. 1.
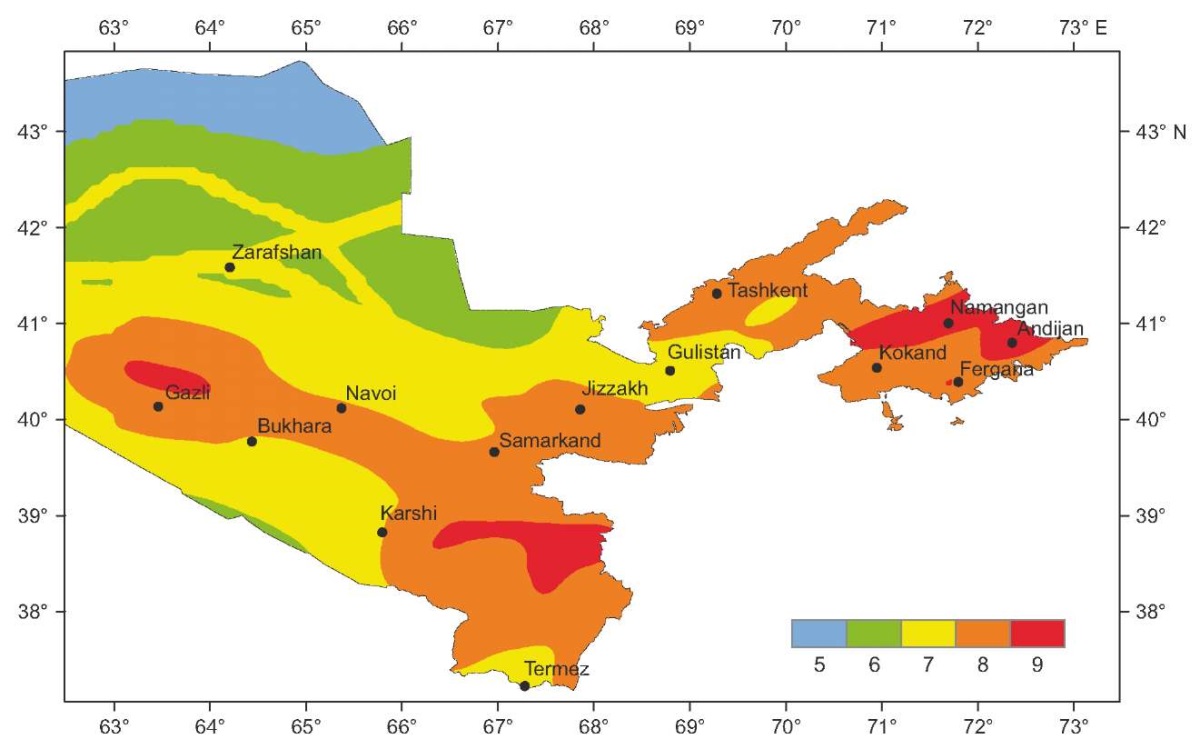
Fig. 1. A fragment of the general normative seismic zoning map GSZ-2017 for Uzbekistan.
The probabilistic-deterministic approach based on the theory of macroseismic and spectral-temporal intensity of shaking [Riznichenko, 1985; Riznichenko, Seiduzova, 1984] was compared to the classical probability approach based on the theorem of total probability [Cornell, 1968; McGuire, 2004; and others] in many studies [Chernov, 1989; Bindi et al., 2011; Ibragimov et al., 2022b; and others]. These studies note that Yu.V. Riznichenko approach involved calculating the average values of seismic parameters of each source, with no regard for their variability, and the median values in the attenuation laws of seismic movement, with no regard for aleatory variability in ground motion equations. This may result in an underestimate of seismic hazard of the areas prone to earthquakes. In [Ibragimov et al., 2022b], a comparison was made of the assessments obtained using the above-mentioned approaches for the territory of Uzbekistan. It is shown that seismic hazard assessment differences depending on the selected approach increase with the increase of probability of occurrence of non-exceedance level earthquakes over a specific time period and may be significant for the objects of high responsibility level.
Seismic hazard assessments of earthquake-prone areas are largely dependent on the choice of intensity-distance attenuation law underlying the calculations [Artikov et al., 2016; Bykova, Tatevosyan, 2015; and others]. The ground motion prediction equation-based seismic effects can differ significantly even if the equations are derived from the same experimental dataset. This difference is largely due to the form of relationship between the level of seismic effect and earthquake magnitude, its mechanism, distance to the locality in which seismic hazard is assessed, and local ground conditions. A more complicated equation does not necessarily yields a better prediction accuracy of seismic effect. To account for epistemic uncertainty in ground motion parameters, the current practice in the probabilistic seismic hazard analysis (PSHA) procedures implies the use of several existing attenuation equations. Simply increasing the number of equations involved does not usually solve this problem. The most effective tool for its solving is the ranking procedure which consists in attributing weight to one or another equation depending on the extent to which the equation-based prediction of seismic effects corresponds to real experimental data available for the study region. This study involves two methods in ranking intensity-distance attenuation models for Central Asia – LH [Scherbaum et al., 2004] and LLH [Scherbaum et al., 2009]. On the basis of the ranking procedure, there has been made a generalized attenuation model, used subsequently to obtain probabilistic seismic hazard assessment for Uzbekistan in points of the MSK-64 scale.
Seismic intensity assessment in points of a macriseismic scale for Uzbekistan was based on several intensity-distance attenuation laws. In parallel with the global data based relationship proposed by N.V. Shebalin [Shebalin, 1968, 1972]
 (1)
(1)
consideration was also given to some other relationships presented in [Artikov et al., 2020b], which were derived from the analysis of the isoseist map-schemes of strong earthquakes in Central Asia:
– Blake-Shebalin type relationship:
 (2)
(2)
– Kovesligethy-type relationship [Kovesligethy, 1907]:
 (3)
(3)
– relationship in which the attenuation coefficient depends on the focal depth:
 (4)
(4)
The analysis also involved the relationship earlier derived by D. Bindi [Bindi et al., 2011] from the macroseismic data on Central Asia:
 (5)
(5)
The above relationships involve hypocentral distance Rhyp as distance R and magnitude MS as magnitude M.
However, it is important to note that even if relationships (5) and (2–4) were derived from almost the same macroseismic data for earthuakes of Central Asia, their underlying data were initially somewhat different. In the first case these were "site –intensity" tabulated values, in the second – the dimensions of isoseists of earthquakes having different macroseismic intensities.
Assume, we have the intensity-distance attenuation law identifying seismic intensity I=I(M, R) for each pair (M, R) (magnitude – distance) with standard error σ.
Assume, Iobs is an experimental intensity recorded at distance R from the source of an earthquake with magnitude M, and α is the intensity for the same pair (M, R), predicted based on the chosen attenuation law I=I(M, R). Analysis has been made on normalizing sample data to standard deviation σ of the centered differences between the observed and predicted seismic intensities:
 (6)
(6)
which are sometimes referred to as normalized residuals. Using the approach of [Scherbaum et al., 2004] to the degree of validity of a particular model describing seismic ground motions for the experimental data-limited region, the comparison has been made between the frequencies of normalized residuals and those expected to obtain on condition that these residuals follow the normal distribution with zero mean and unit variance. An assessment is made of the probability that the absolute value of a normal random variable will fall within the interval between specific observation module z0 and ∞.
For positive z0, this will be
 (7)
(7)
u(z0) can be expressed as
 (8)
(8)
where Erf(z) is error integral 
Considering both distribution tail areas, LH relative to z0 can be derived as
 (9)
(9)
When coupled with statistical properties of normalized residuals sampling {Z} (mean, median, and standard deviation value), statistical characteristics of LH distribution will allow us to deduce the degree of correspondence between different ground motion models and a given experimental dataset [Scherbaum et al., 2004]. The deviation of the mean and the median of the normalized residuals from zero and the "unit" standard deviation help in revealing model weaknesses. Large differences between the mean and the median of the normalized residuals should help in revealing the models with skewed residuals.
In [Scherbaum et al., 2004] propose the following classification of the candidate ground-motion prediction equation (GMPE) models by the degree of applicability for the study region.
Class A model (a model that best fits the experimental data) is characterized by minimum median LH=0.4 and mean and median absolute of the normalized residuals 0.25. Standard deviation of the normalized residuals sampling should be less than 1.125.
Class B model (acceptable model) is characterized by minimum median LH=0.3 and mean and median absolute of the normalized residuals less than 0.5. Standard deviation of the normalized residuals sampling should be less than 1.25.
Class C model (minimally acceptable model) is characterized by minimum median LH=0.2 and mean and median absolute of the normalized residuals less than 0.75. Standard deviation of the normalized residuals sampling should be less than 1.5.
If a model does not satisfy any of the criteria indicated above, then it is considered to be unsatisfactory –class D model.
Fig. 2 shows the normalized residual and LH distributions for the five attenuation laws considered; Table 1 shows the ranking results for the models tested.
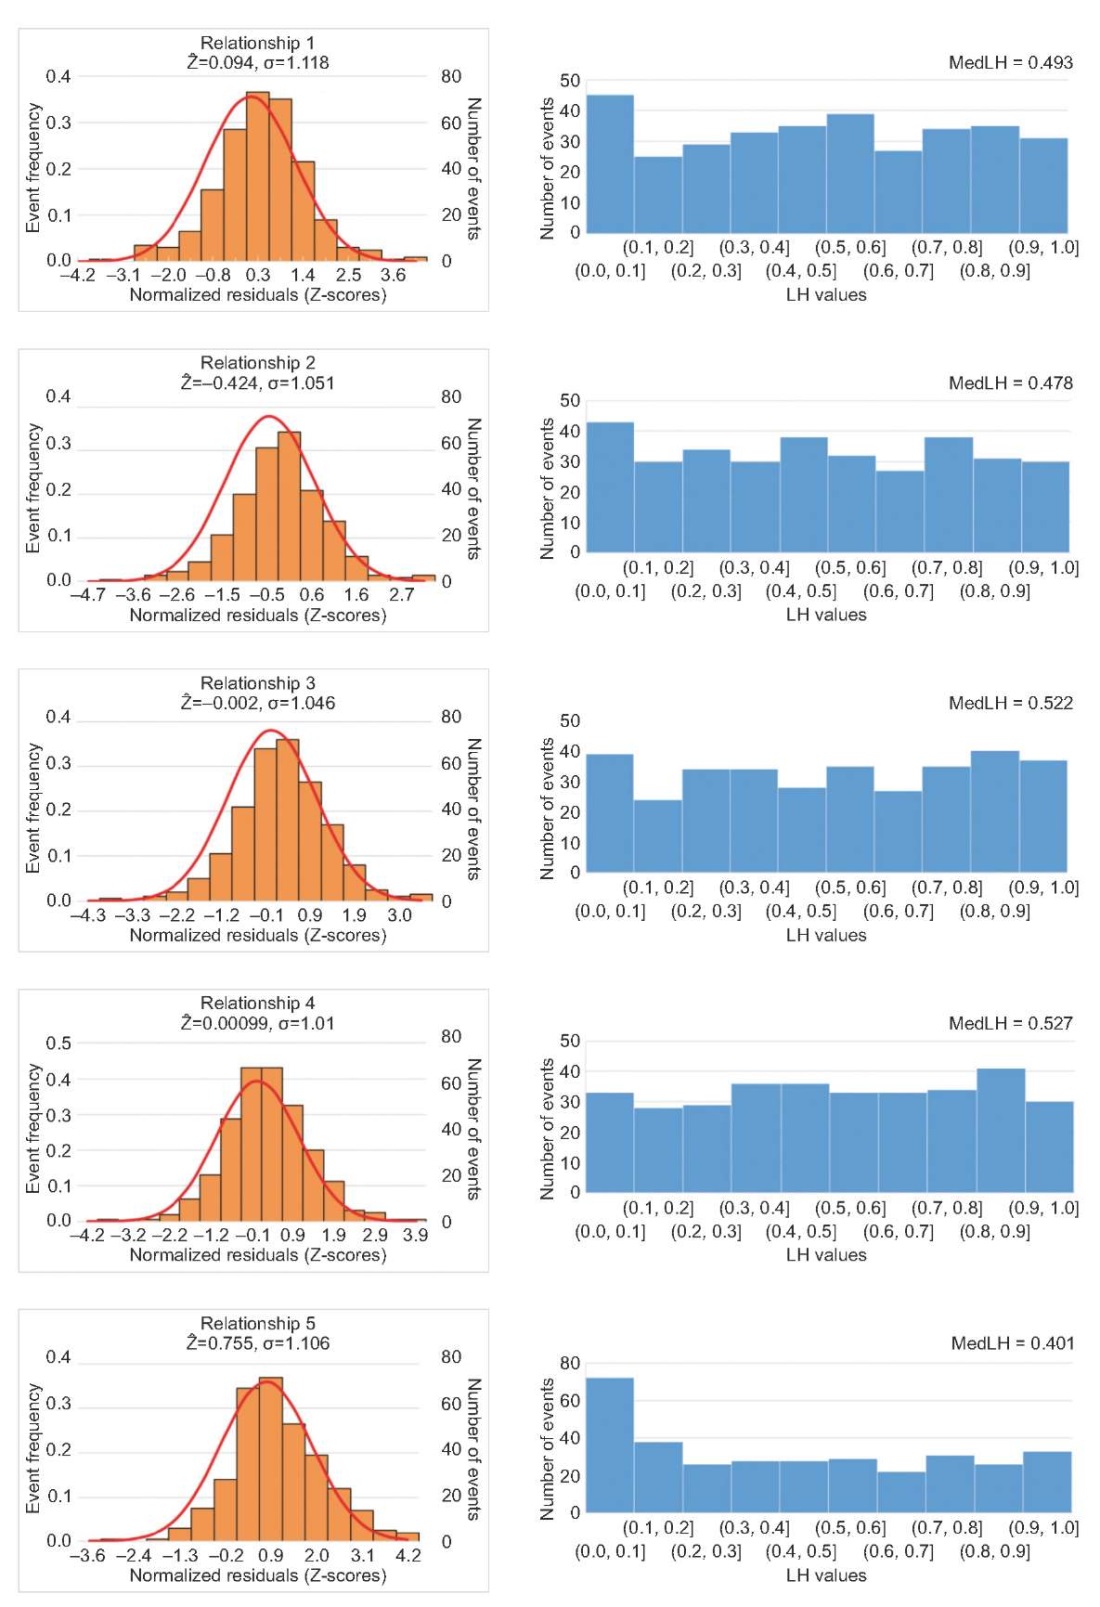
Fig. 2. Distribution of the normalized residuals Z (left column) and LH values (right column) for the five attenuation laws considered.
Table 1. Intensity-distance attenuation model ranking by the LH method
|
Attenuation model |
LH (median) |
Sampling parameters for normalized residuals {Z} |
Model rank |
||
|
Median |
Mean |
Standard deviation |
|||
|
1 |
0.493 |
0.129 |
0.094 |
1.118 |
A |
|
2 |
0.477 |
–0.410 |
–0.425 |
1.050 |
B |
|
3 |
0.522 |
0.012 |
–0.002 |
1.046 |
A |
|
4 |
0.527 |
–0.014 |
0.001 |
1.010 |
A |
|
5 |
0.401 |
0.669 |
0.755 |
1.106 |
D |
As can be seen from Table 1, the most acceptable models for the study region are the model proposed by N.V. Shebalin (1) [Shebalin, 1968], Kovesligethi-type model (3) [Artikov et al., 2020b], and the model (4) in which attenuation coefficient depends on earthquake depth [Artikov et al., 2020b]. According to [Scherbaum et al., 2004], the Blake-Shebalin type relationship (2) [Artikov et al., 2020b] is assigned to rank B which is due primarily to the deviation of the mean and median of the normalized residuals to the left of 0. This testifies to a systematic exceedance of the macroseismic effect predicted. For the same reason but for systematic failure to reach the effect predicted, the worst results among the models tested are shown by relationship (5) based on [Bindi et al., 2011]. According to [Scherbaum et al., 2004], this model is assigned to rank D and is not recommended for the use in seismic hazard assessment of the study area.
In opinion of the authors of the LH method [Scherbaum et al., 2004], a significant disadvantage of LH-based ranking ground motion equations is the need for subjective criteria, e.g., for an acceptability threshold. Besides, the LH-based ranking results for ground motion equations depend on the sampling size which is also a disadvantage. In [Scherbaum et al., 2009] propose to use a more common approach which is free from the disadvantages mentioned above. The essence of this approach is as follows.
Consideration is being given to attenuation models g1, g2, g3 … gk, each characterized by normal probability density functions g1(x), g2(x), g3(x) … gk(x). The parameters for probability density of true attenuation model f are supposed unknown but include, among others, normal distribution and observation sample x={xi}, i=1, … N. The proposed criterion for ranking attenuation models [Scherbaum et al., 2009] involves an attenuation-related LLH parameter derived as:
 (10)
(10)
Thus, the LLH parameter is the number of observations N-based normalization and the negative of log-likelihood function g(x) relative to sample x={xi}. Adequacy of attenuation models implies that the LHH parameter values are approximately equivalent to 1.4–1.6 [Scherbaum et al., 2009]. The dimension of the LLH function is proposed to be used in attenuation model ranking by assigning weight wj to different models:
 (11)
(11)
In our case, the LLH parameter derivation for each attenuation model (1–5) and the consequent model ranking involved the following procedure. For each observed intensity Iobs(i) of an earthquake with magnitude Mi at epicentral distance Ri, consideration was given to normal density function P(µ; σ)(x), in which mean µ is equal to intensity I(Mi, Ri), predicted based on the chosen attenuation law, and σ is standard deviation of this attenuation law. The value of function P(µ; σ)(x) was determined in point xi=Iobs(i). Let us designate this value as pi. Through a set of the observed intensities Iobs(i), consisting of N values, the LLH parameter of this attenuation law was derived as:
 (12)
(12)
Table 2 presents the LLH-based ranks for tested attenuation models.
As is apparent from Table 2, in accordance with LLH criterion, the most acceptable attenuation models for the study area are models (1–4), which generally also corresponds to LH-based ranking.
Table 2. Results of ranking different attenuation models by the LLH method
|
Relationship number |
1 |
2 |
3 |
4 |
5 |
|
LLH value |
1.7016 |
1.7109 |
1.5956 |
1.5454 |
2.0598 |
|
Weight on relationship |
0.200 |
0.200 |
0.213 |
0.221 |
0.166 |
In order to derive a general attenuation law, model 5 was excluded as the worst in terms of ranking results based on the two criteria considered, and there was performed a LLH-based redefinition of weights on relationships (1–4) for the first four models: w1=0.24, w2=0.24, w3=0.26, w4=0.26. The weight coefficients obtained formed the basis of the generalized attenuation model for further probabilistic seismic hazard assessment of Uzbekistan in points of a macroseismic scale.
Probabilistic seismic hazard analysis for Uzbekistan involved seismic source models of three types: an active fault model, a seismogenic zone model, and an area source model.
Along with definition of the geometrical characteristics of each source in both plan and depth, the parametrization of seismic source models implies the determination of source potential, recurrence parameters for earthquakes of different energy levels, source-based kinematics etc. Let us consider this in more detail.
A model of active faults as seismic sources was compiled using the Active Fault Database of Eurasia – AFEAD [Zelenin et al., 2022] (Fig. 3, 4, 5). The AFEAD contains information on morphology and amount of Late Quaternary displacements along each fault (three ranks). The faults of the database are divided into four classes (A, В, С, D) in accordance with the degree of modern geodynamic activity manifestation – CONF attribute. Thus, the AFEAD contains the most complete information for conducting probabilistic seismic hazard analysis.
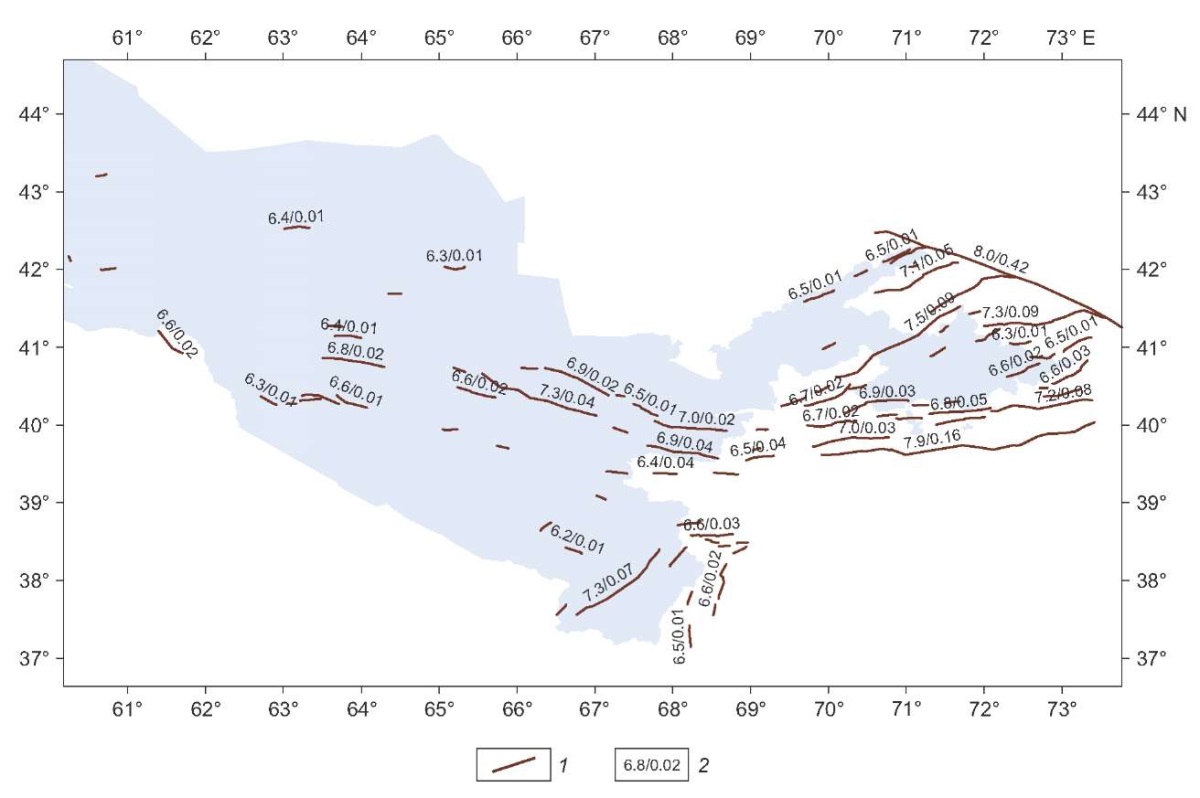
Fig. 3. A model of Class A and B active faults as seismic sources in accordance with the degree of modern geodynamic activity manifestation. 1 – fault geometry; 2 – seismic potential (in the numerator) and seismic activity reduced to magnitude M=5.0 (in the denominator).
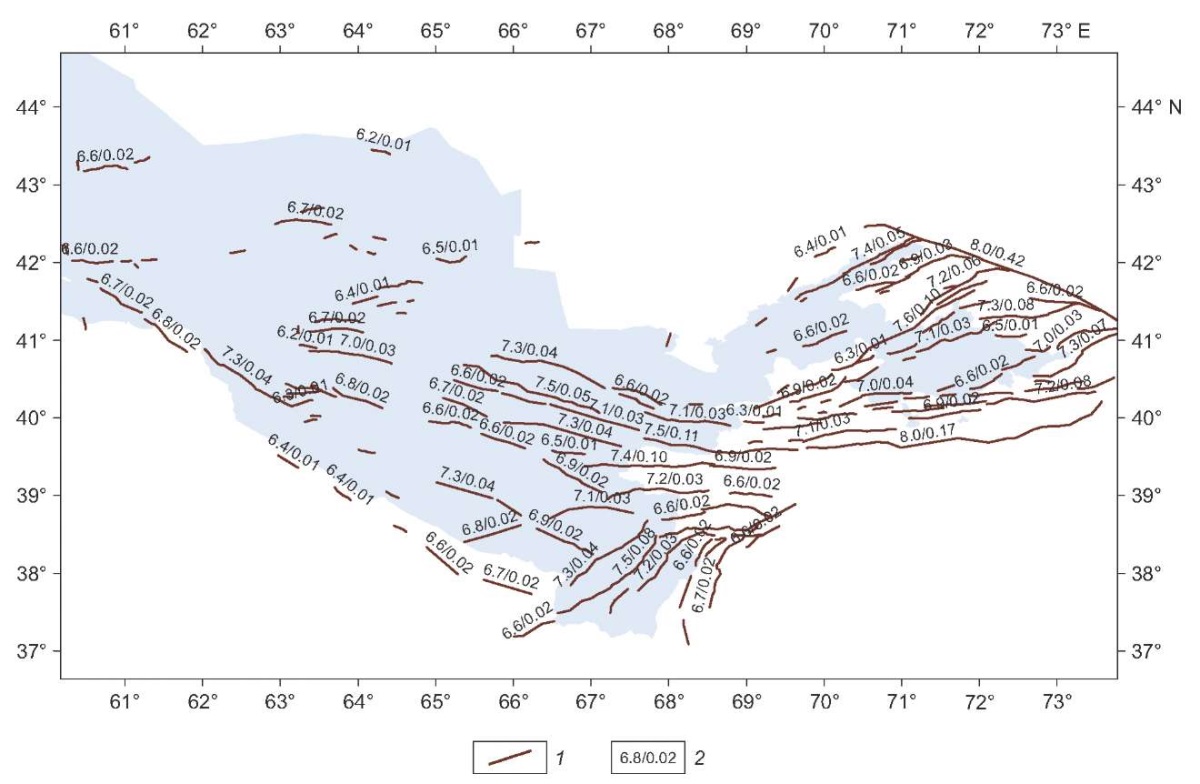
Fig. 4. A model of Class A, B and C active faults as seismic sources in accordance with the degree of modern geodynamic activity manifestation. 1 – fault geometry; 2 – seismic potential (in the numerator) and seismic activity of the fault reduced to magnitude M=5.0 (in the denominator).
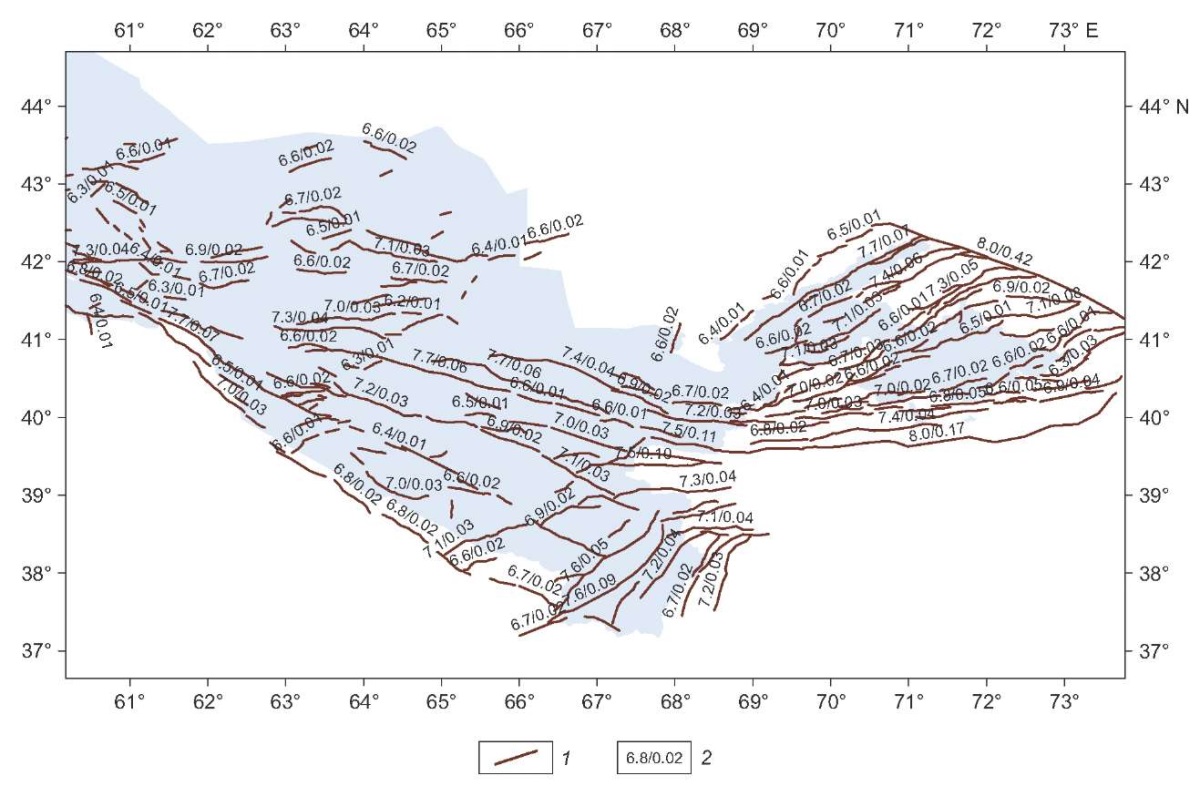
Fig. 5. A model of Class A, B, C and D active faults as seismic sources in accordance with the degree of modern geodynamic activity manifestation. 1 – fault geometry; 2 – seismic potential (in the numerator) and seismic activity of the fault reduced to magnitude M=5.0 (in the denominator).
Geometric configuration of a seismogenic zone model is borrowed from [Ibragimov et al., 2002]. Seismological parametrization of this model, as well as of an area source model, was based on the regional earthquake catalog including the data on historical and instrumentally recorded seismic events. The data on the representativeness of earthquakes of different magnitudes in the regional catalog, its declasterization methods, and relation equations between different types of magnitudes used in PSHA of Uzbekistan can be found in [Artikov et al., 2020a, 2020b; Ibragimov et al., 2022a, 2022b]. A regional catalog-based map of the epicenters of earthquakes for the historical and instrumental periods of observations in the study area is shown in Fig. 6. The insets therein show histograms of depth distribution of seismic events of different magnitudes and a plot of the recurrence of earthquakes of different magnitudes (Gutenberg-Richter Law). As seen from the histograms, most of the earthquakes with М≥5.0 are located in an 11 to 20 km seismoactive layer. Considering that this earthquake magnitude range provides the most significant seismic effects, seismic hazard assessment was based on three potential depths: H1=10 km, H2=15 km and H3=20 km, which were imported into a logic tree with weights w1=0.2, w2=0.6 and w3=0.2. An angular coefficient of the plot of the recurrence of representative earthquakes of the regional catalog is close to 1.0 (b is a parameter in Gutenberg-Richter Law lgN=a–bM).

Fig. 6. A map of earthquake epicenters in the study area for the historical and instrumental periods of observations, compiled from the regional catalog.
Insets (а, б) shows histograms of depth distribution of representative earthquakes from the catalog: (а) – earthquakes with magnitude M<5.0; (б) – M≥5.0. The inset (в) is a graph of earthquakes recurrence. 1 – active faults of Earth’s crust; 2–12 – earthquakes of different magnitudes: 2 – M<2.5, 3 – M=3.0, 4 – M=3.5, 5 – M=4.0, 6 – M=4.5, 7 – M=5.0, 8 – M=5.5, 9 – M=6.0, 10 – M=6.5, 11 – M=7.0, 12 – M>7.0.
Seismic potential of active faults is usually assessed using ratios based on the correlation between Мmax and geometric characteristics of tectonic faulting (fault length L, maximum possible surface fault rupture length l, its corresponding rupture width W, maximum surface rupture area A=l·W). The calculated value of Мmax, in this case, was determined for each active fault by equal-weighted averaging of seismic potential assessments over five different relationships derived in [Hanks, Bakun, 2008; Leonard, 2010, 2014; Wells, Coppersmith, 1994], where Мmax is expressed through rupture length l and its area A. It was assumed that rupture width W is half of its length W=l/2. Since the source kinematics of earthquakes in Uzbekistan corresponds primarily to reverse-faults [Ibragimova et al., 2021; Rebetsky et al., 2020], the assessments of Мmax over the relationships [Hanks, Bakun, 2008; Leonard, 2010, 2014; Wells, Coppersmith, 1994] were made for reverse-fault motion at an earthquake source.
It should be noted that rupture length l, which may be associated with the maximum earthquake magnitude, Мmax, amounts to only a certain percentage of the total fault length L. The study of l/L ratio can be found in a number of publications [Shteinberg, Ponomareva, 1987; Nowroozi, 1985; and others]. In our study, this ratio is accepted as equal to that accepted in [Nowroozi, 1985].
To assess average annual recurrence of earthquakes of different magnitudes N(M), a model of active faulting involved four ratios derived in [Anderson, Luco, 1983; Youngs, Coppersmith, 1985] and their software implementation described in [Bungum, 2007]. The dependencies [Anderson, Luco, 1983; Youngs, Coppersmith, 1985] for determination of earthquake recurrence differ from each other by the character of seismic moment release, with the logarithm of seismic moment linearly dependent on earthquake magnitude. In calculating seismic hazard of the study area, seismic activity N(M), reduced to magnitude M=5.0, was determined as arithmetic mean over the ratios proposed in [Anderson, Luco, 1983; Youngs, Coppersmith, 1985].
Taking into account the degrees of manifestation of recent geodynamic activity (CONF attribute in AFEAD database), consideration was given to three versions of models of active faults as seismic sources. The first version involved Class A and B faults, the second – Class A, B and C faults, and, finally, the third, most conservative version comprised Class A, B, C and D faults. Fig. 3, 4, 5 show the configuration of three above-mentioned models of active faults in the study area. The same figures provide each fault with a fraction with seismic potential, Мmax, as a numerator and average annual recurrence of earthquakes with magnitudes M≥5 as a denominator. The b-value parameter (angular coefficient of earthquake recurrence plot) in each of the three active fault models considered was based on the regional earthquake catalog.
The fault model alone is not sufficiently complete to characterize the area distribution of low-amplitude seismic events. To compensate possible lacking events, the fault model was added to by the background source layer reduced to the maximum magnitude, М=5.5. It was assumed that high-magnitude earthquakes are confined to active fault zones which should be stored in the active fault database.
A seismogenic zone is an area of active dynamic influence of a large fault or a system of closely spaced, identically oriented ruptures which generate large earthquakes at the stage of tectonic activation of the region [Ibragimov et al., 2002]. Based on the seismotectonic and seismological data [Ibragimov et al., 2002], approximately 30 seismogeneraing zones with seismic potential Мmax≥5.5 were defined in Uzbekistan (Fig. 7).
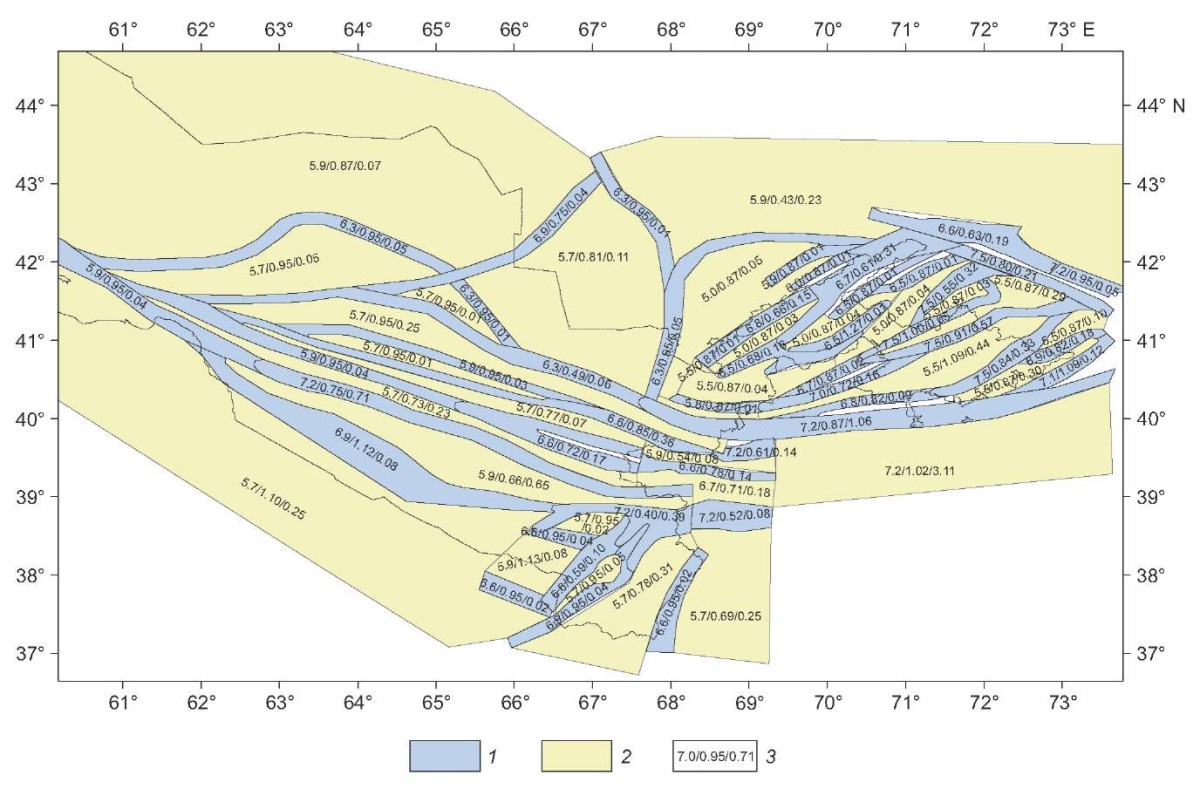
Fig. 7. A model of seismogenic zones as seismic sources for the territory of Uzbekistan.
1 – seismogenic zones; 2 – sources located beyond seismogenic zones; 3 – estimates of seismic potential Мmax, parameter b and seismic activity reduced to magnitude M=4.0.
The maximum possible seismogenic-zone earthquake magnitude, Мmax, was determined using seismological and seismotectonic methods, described in detail in [Ibragimov et al., 2002; Artikov et al., 2020a]. Seismic hazard calculations were based on the results of seismological and seismotectonic determinations of maximum possible magnitude, Мmax, in each one of the seismogenic zones defined. For seismic sources located beyond seismogenic zones, seismic potential was assessed considering half the magnitude added to the maximum earthquake magnitude observed therein.
Seismic recurrence parameters for modeling seismogenic zones as seismic sources were determined as follows. For seismic sources that generated earthquakes in an amount sufficient for reliable plotting of recurrent events, seismic activity reduced to magnitude M=4.0 and the angular coefficient of the line (b-value parameter) were read directly from this plot. Seismogenerating zones as seismic sources that generated a small amount of earthquakes were assigned a regional b-value parameter, and seismic activity at a given value of the slope of the recurrence plot was determined from a sample of earthquakes generated directly by the seismic source. There were used traditional distribution and summation methods [Gorbunova, 1964; Riznichenko, 1985] for seismic activity determination. Seismic potentials and earthquake recurrence parameters for each seismic source in a seissmogenic zone model are shown in Fig. 7.
The area source model was contoured when making general seismic zoning maps of Uzbekistan (GSZ-2017) [Artikov et al., 2020a]. In general, this model clearly shows the block structure of the Earth’s crust and a spatial pattern of seismicity in the orogenic and platform parts of the study area separated by the Tien Shan lineament. Three mega-zones have been marked in eastern Uzbekistan: Tashkent, Talas-Fergana, and the Fergana depression and surrounding mountains. The South Uzbekistan mega-zone including the southwestern spurs of the Gissar Range is considered in southern Uzbekistan. The West and Northwest mega-zones are marked in western Uzbekistan. The area of Gazli was considered separately, due to the special seismological conditions. The mega-zones have also been divided into subzones, i. e., different seismic activity fields. For an adequate seismic hazard assessment of the border areas, consideration was given to additional area zones located partially or completely in neighboring countries.
As assessment of seismic potential of area sources, use has been made of the value obtained by adding 0.3–0.5М magnitude units to the maximum observed earthquake therein. The recurrence parameters for area zones as a source model were determined in the same way as for a seismogenic zone model. The area source model configuration with indication of seismic potential and recurrence parameters is shown in Fig. 8.
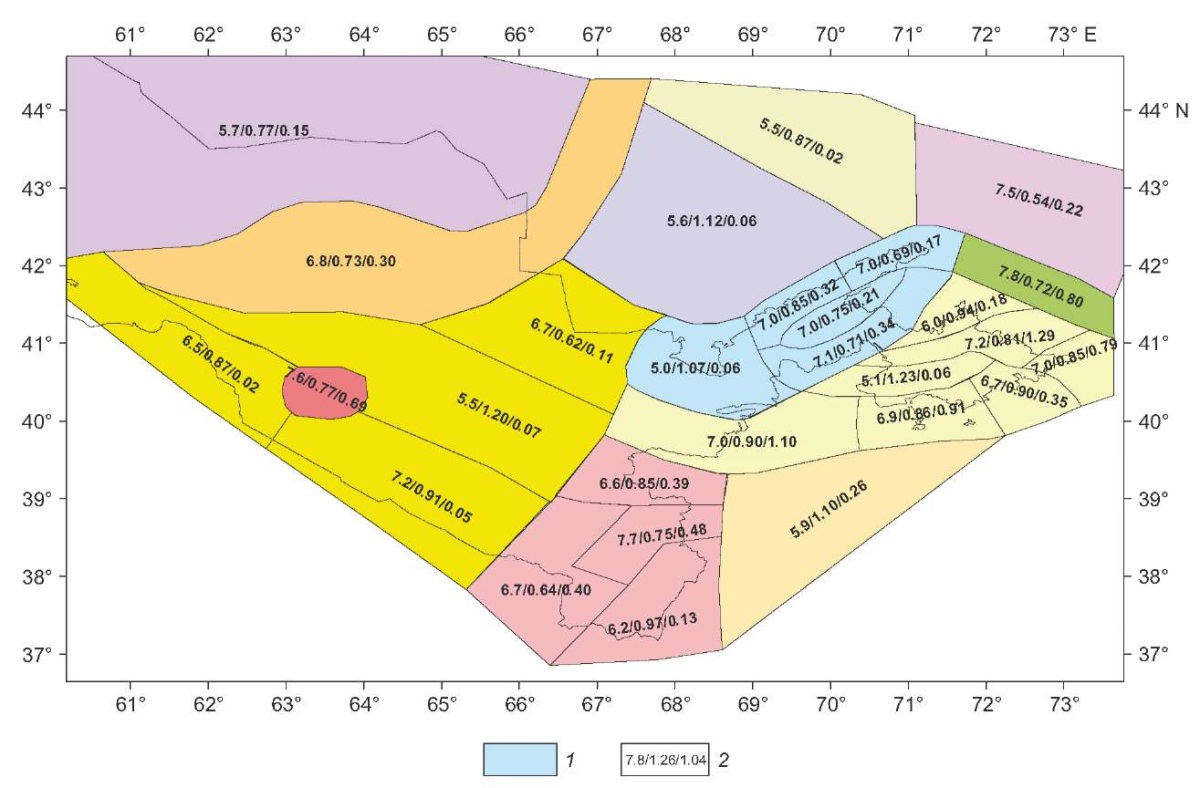
Fig. 8. Model of area sources. 1 – source contours; 2 – estimates of seismic potential Мmax, b-value parameter and seismic activity reduced to magnitude M=4.0.
Seismic hazard calculations were made using software CRISIS [Ordaz et al., 2007] which is available worldwide for the probabilistic seismic hazard analysis. The grid spacing was 0.2×0.2°.
Epistemic uncertainty in seismic source selection was taken into account by drawing a logic tree. Each considered model was assigned a certain weight (w):
Thus, the total weight of all five seismic source models was wΣ=1. The total weight of different-class active fault models was wfault=1/3, i. e., the same as that of area source and seismogenic zone models. The central (class A, B and C) active fault model, as moderately conservative, was assigned a weight lager than the other two models were.
Fig. 9 depicts seismic zoning maps of Uzbekistan in points of a macroseismic scale for probabilities Р=0.90 and Р=0.98 of occurrence of non-exceedance level earthquakes in the next 50 years. Since the intensity-distance attenuation laws are derived for average ground conditions such as category II grounds in Uzbekistan in accordance with their seismic properties, the compiled maps are attributed to this ground category.
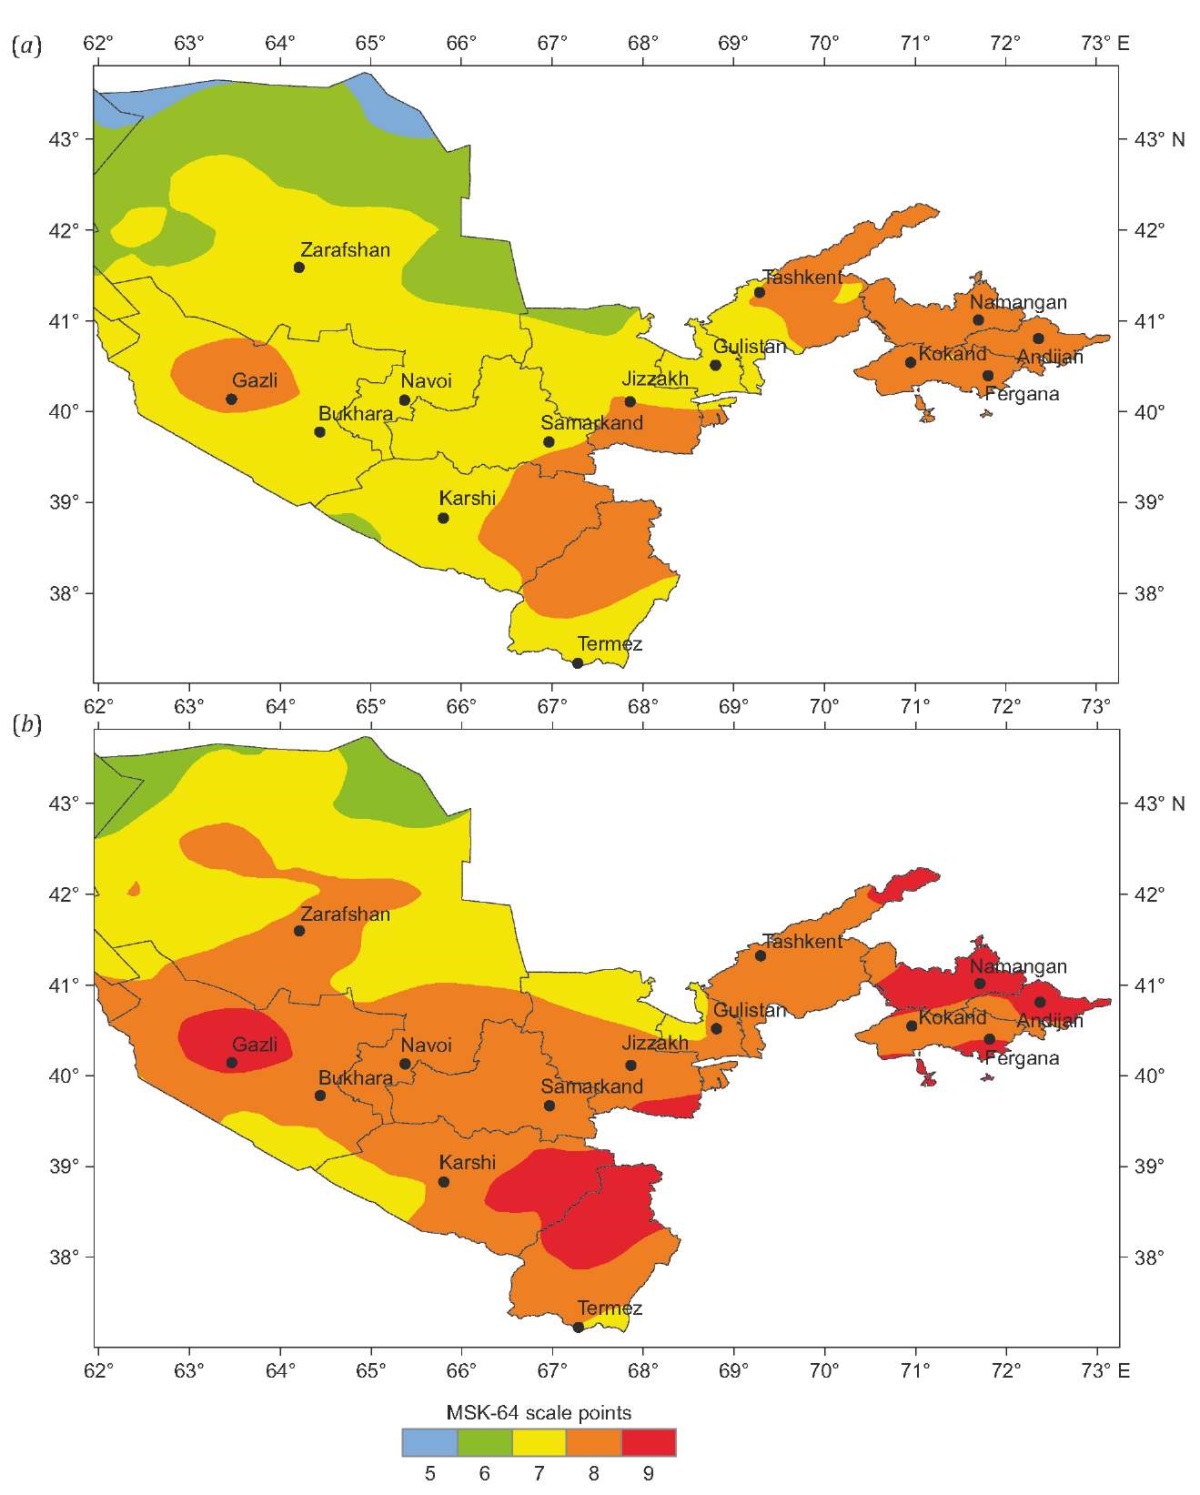
Fig. 9. A seismic zoning map of Uzbekistan in points of the MSK-64 scale for different probabilities P of occurrence of non-exceedance level earthquakes in the next 50 years. (a) – P=0.90; (b) – P=0.98.
Fig. 10 shows hazard curves for some major cities in Uzbekistan. Seismic intensity in points of the MSK-64 scale is plotted on the abscissa; the exceedance probability in the next 50 years is plotted on the ordinate. The horizontal lines show earthquake recurrence periods corresponding to probabilities of occurrence of exceedance-level earthquakes.
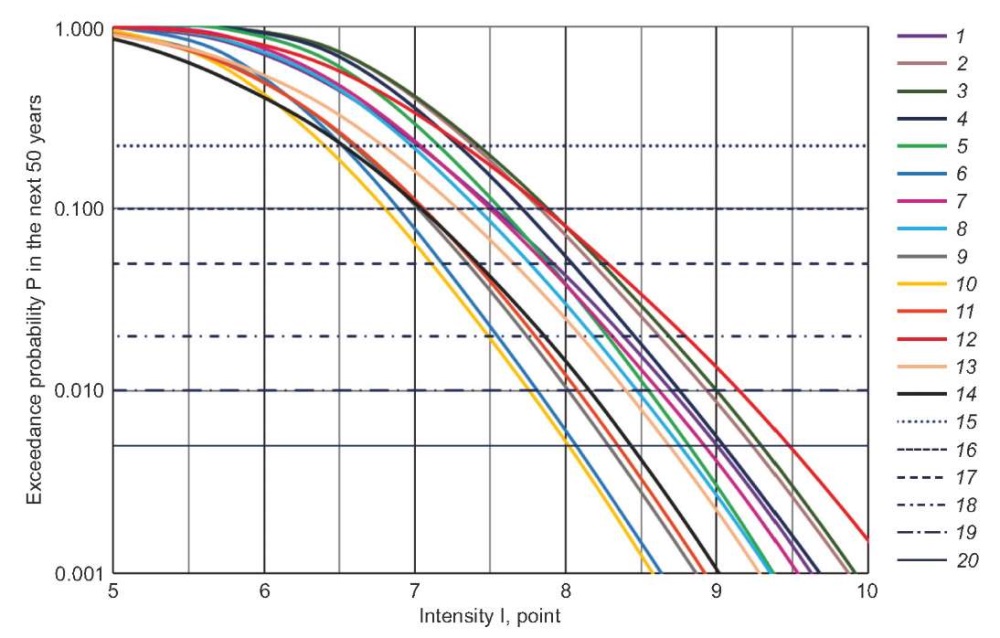
Fig. 10. Hazard curves of some major cities in Uzbekistan.
1–14 – hazard curves of: 1 – Tashkent, 2 – Andijan, 3 – Namangan, 4 – Fergana, 5 – Kokand, 6 – Gulistan, 7 – Jizzakh, 8 – Samarkand, 9 – Karshi, 10 – Termez, 11 – Bukhara, 12 – Gazli, 13 – Navoi, 14 – Zarafshan; 15–20 – lines corresponding to different earthquake recurrence periods (T): 15 – T=200 years, 16 – T=475 years, 17 – T=975 years, 18 – T=2475 years, 19 – T=4975 years, 20 – T=9975 years.
On the basis of the studies, the intensity-distance attenuation laws for Central Asia were ranked using two different methods (LH and LLH). As a result of ranking, there has been made a general intensity-distance attenuation model as applied to earthquakes of different energy levels.
For seismic hazard assessment of Uzbekistan, consideration was given to five alternative seismic source models: an area source model, a seismogenic zone model, and three models of active faults with different degrees of neogeodynamic and recent geodynamic activity manifestation. Seismological parametrization of seismic source models involved determining seismic potential, recurrence parameters for earthquakes of different magnitudes, and the predominant type of motion at each earthquake source.
The available seismic source and seismic effect models were used for probabilistic seismic hazard assessment of Uzbekistan in points of a macroseismic scale. Seismic zoning maps were compiled for different probabilities of occurrence of non-exceedance level earthquakes in the next 50 years. Hazard curves were plotted for some major cities of the republic.
All authors made an equivalent contribution to this article, read and approved the final manuscript.
The authors declare that they have no conflicts of interest relevant to this manuscript.
1. Anderson J.G., Luco J.E., 1983. Consequences of Slip Rate Constants on Earthquake Occurrence Relations. Bulletin of the Seismological Society of America 73 (2), 471–496. DOI:10.1785/BSSA0730020471.
2. Artikov T.U., Ibragimov R.S., Ibragimova T.L., Mirzaev M.A., 2016. Study of Modern Seismic Zoning Maps’ Accuracy (Case for Eastern Uzbekistan). Geodesy and Geodynamics 7 (6), 416–424. https://doi.org/10.1016/j.geog.2016.04.015.
3. Artikov T.U., Ibragimov R.S., Ibragimova T.L., Mirzaev M.A., 2018. Methodology of Developing the New Complex of General Seismic Zoning Maps of Uzbekistan Territory OSR-2017. Georisk 12 (2), 6–24 (in Russian) [Артиков Т.У., Ибрагимов Р.С., Ибрагимова Т.Л., Мирзаев М.А. Методология построения нового комплекса карт общего сейсмического районирования территории Узбекистана ОСР-2017 // Геориск. 2018. Т. 12. № 2. С. 6–24].
4. Artikov T.U., Ibragimov R.S., Ibragimova T.L., Mirzaev M.A., 2020a. Complex of General Seismic Zoning Maps OSR-2017 of Uzbekistan. Geodesy and Geodynamics 11 (4), 273–292. https://doi.org/10.1016/j.geog.2020.03.004.
5. Artikov T.U., Ibragimov R.S., Ibragimova T.L., Mirzaev M.A., 2020b. Models of the Macroseismic Field Earthquakes and Their Influence on Seismic Hazard Assessment Values for Central Asia. Geodynamics & Tectonophysics 11 (3), 606–623 (in Russian) [Артиков Т.У., Ибрагимов Р.С., Ибрагимова Т.Л., Мирзаев М.A. Модели макросейсмического поля землетрясений Центральной Азии и их влияние на результирующие оценки сейсмической опасности // Геодинамика и тектонофизика. 2020. Т. 11. № 3. С. 606–623]. https://doi.org/10.5800/GT-2020-11-3-0494.
6. Bindi D., Parolai S., Oth A., Abdrahmatov K., Muraliev A., Zschau J., 2011. Intensity Prediction Equations for Central Asia. Geophysical Journal International 187 (1), 327–337. https://doi.org/10.1111/j.1365-246X.2011.05142.x.
7. Bungum H., 2007. Numerical Modelling of Fault Activities. Computers & Geophysics 33 (6), 808–820. https://doi.org/10.1016/j.cageo.2006.10.011.
8. Bykova V.V., Tatevosyan R.E., 2015. Basic Principles of Probabilistic of Seismic Hazard Analysis by the Example of the Main Gas Pipeline Section. In: Problems of Integrated Geophysical Monitoring in the Russian Far East. Proceedings of the Fifth Scientific and Technical Conference (September 27 – October 3, 2015). KB FRC GS RAS, Petropavlovsk-Kamchatsky, p. 134–138 (in Russian) [Быкова В.В., Татевосян Р.Э. Об основных принципах вероятностного анализа сейсмической опасности на примере участка магистрального газопровода // Проблемы комплексного геофизического мониторинга Дальнего Востока России: Труды Пятой научно-технической конференции (27 сентября – 3 октября 2015 г.). Петропавловск-Камчатский: КФ ФИЦ ЕГС РАН, 2015. С. 134–138].
9. Chernov Yu.K., 1989. Strong Ground Motions and Quantitative Assessment of Seismic Hazard for the Areas. Fan, Tashkent, 296 p. (in Russian) [Чернов Ю.К. Сильные движения грунта и количественная оценка сейсмической опасности территорий. Ташкент: Фан, 1989. 296 с.].
10. Cornell C.A., 1968. Engineering Seismic Risk Analysis. Bulletin of the Seismological Society of America 58 (5), 1583–1606. https://doi.org/10.1785/BSSA0580051583.
11. Gorbunova I.V., 1964. Constant Accuracy in Mapping. In: Experimental Seismics. Publishing House of the USSR Academy of Sciences, Moscow, p. 138–147 (in Russian) [Горбунова И.В. Построение карт активности с постоянной точностью // Экспериментальная сейсмика. М.: Изд-во АН СССР, 1964. С. 138–147].
12. Hanks T.C., Bakun W.H., 2008. M-logA Observations for Recent Large Earthquakes. Bulletin of the Seismological Society of America 98 (1), 490–494. https://doi.org/10.1785/0120070174.
13. Ibragimov R.N., Nurmatov U.O., Ibragimov O.R., 2002. Seismotectonic Method for Assessing Seismic Hazard and Issues of Seismic Zoning. In: Seismic Zoning and Earthquake Forecasting in Uzbekistan. Hydroingeo, Tashkent, p. 59–74 (in Russian) [Ибрагимов Р.Н., Нурматов У.О., Ибрагимов О.Р. Сейсмотектонический метод оценки сейсмической опасности и вопросы сейсмического районирования // Сейсмическое районирование и прогноз землетрясений в Узбекистане. Ташкент: Гидроингео, 2002. С. 59–74].
14. Ibragimov R.S., Ibragimova T.L., Mirzaev M.A., Ashurov S.H., 2022a. Comparison of Seismic Hazard Assessments Obtained with the Probabilistic and Probabilistic-Deterministic Approaches for the Territory of Uzbekistan. Seismic Instruments 58, S14–S24. https://doi.org/10.3103/S0747923922070040.
15. Ibragimov R.S., Ibragimova T.L., Mirzaev M.A., Ashurov S.H., 2022b. Comparison of Seismic Hazard Assessments Obtained within the Probabilistic and Probabilistic-Deterministic Approaches for the Territory of Uzbekistan. Questions of Engineering Seismology 49 (4), 21–35 (in Russian) [Ибрагимов Р.С., Ибрагимова Т.Л., Мирзаев М.А., Ашуров С.Х. Сопоставление оценок сейсмической опасности, получаемых в рамках вероятностного и вероятностно-детерминистического подходов, для территории Узбекистана // Вопросы инженерной сейсмологии. 2022. Т. 49. № 4. С. 21–35]. https://doi.org/10.21455/VIS2022.4-2.
16. Ibragimova T.L., Ibragimov R.S., Mirzaev M.A., Rebetsky Yu.L., 2021. The Current Stress of Earth’s Crust in the Territory of Uzbekistan According to Focal Earthquake Mechanisms. Geodynamics & Tectonophysics 12 (3), 435–454 (in Russian) [Ибрагимова Т.Л., Ибрагимов Р.С., Мирзаев М.А., Ребецкий Ю.Л. Современное напряженное состояние земной коры территории Узбекистана по данным сборного каталога механизмов очагов землетрясений // Геодинамика и тектонофизика. 2021. Т. 12. № 3. С. 435–454]. https://doi.org/10.5800/GT-2021-12-3-0532.
17. Kovesligethy R., 1907. Seismischer Starkegral und Intensität der Beben. Gerlands Beiträge zur Geophysik 8, 22–29.
18. Leonard M., 2010. Earthquake Fault Scaling: Self-Consistent Relating of Rupture Length, Width, Average Displacement, and Moment Release. Bulletin of the Seismological Society of America 100 (5A), 1971–1988. https://doi.org/10.1785/0120090189.
19. Leonard M., 2014. Self-Consistent Earthquake Fault-Scaling Relations: Update and Extension to Stable Continental Strike-Slip Faults. Bulletin of the Seismological Society of America 104 (6), 2953–2965. https://doi.org/10.1785/0120140087.
20. McGuire R.K., 2004. Seismic Hazard and Risk Analysis. Earthquake Engineering Research Institute, Oakland, California, 240 p.
21. Nowroozi A.А., 1985. Empirical Relations between Magnitude and Fault Parameters for Earthquake in Iran. Bulletin of Seismological Society of America 75 (5), 1327–1338. DOI:10.1785/BSSA0750051327.
22. Ordaz M., Aguilar A., Arboleda J., 2007. CRISIS2007. Program for Computing Seismic Hazard. Available from: https://ecapra.org/topics/crisis-2007 (Last Accessed March 31, 2016).
23. Rebetsky Yu.L., Ibragimova T.L., Ibragimov R.S., Mirzaev M.A., 2020. Stress State of Uzbekistan’s Seismically Active Areas. Seismic Instruments 56, 679–700, https://doi.org/10.3103/S0747923920060079.
24. Riznichenko Yu.V., 1985. Problems of Seismology. Nauka, Moscow, 408 p. (in Russian) [Ризниченко Ю.В. Проблемы сейсмологии. М.: Наука, 1985. 408 с.].
25. Riznichenko Yu.V., Seiduzova S.S., 1984. Spectral-Temporal Characteristics of Seismic Hazard. Nauka, Moscow, 182 p. (in Russian) [Ризниченко Ю.В., Сейдузова С.С. Спектрально-временная характеристика сейсмической опасности. М.: Наука, 1984. 182 с.].
26. Scherbaum F., Cotton F., Smit P., 2004. On the Use of Response Spectral-Reference Data for the Selection of Ground-Motion Models for Seismic Hazard Analysis: The Case of Rock Motion. Bulletin of the Seismological Society of America 94 (6), 2164–2185. https://doi.org/10.1785/0120030147.
27. Scherbaum F., Delavaud E., Riggelsen C., 2009. Model Selection in Seismic Hazard Analysis: An Information-Theoretic Perspective. Bulletin of the Seismological Society of America 99, 3234–3247. https://doi.org/10.1785/0120080347.
28. Shebalin N.V., 1968. Methods to Use Engineering and Seismological Data for Seismic Zoning. In: Seismic Zoning of the USSR. Nauka, Moscow, p. 95–111 (in Russian) [Шебалин Н.В. Методы использования инженерно-сейсмологических данных при сейсмическом районировании // Сейсмическое районирование СССР. М.: Наука, 1968. С. 95–111].
29. Shebalin N.V., 1972. Macroseismic Data as Information on Source Parameters of Large Earthquakes. Physics of the Earth and Planetary Interiors 6 (4), 316–323. https://doi.org/10.1016/0031-9201(72)90016-7.
30. Shteinberg V.V., Ponomareva O.N., 1987. Large Earthquake Source Dimensions. Problems of Engineering Seismology 28, 63–72 (in Russian) [Штейнберг В.В., Пономарева О.Н. О размерах очагов сильных землетрясений // Вопросы инженерной сейсмологии. 1987. Вып. 28. C. 63–72].
31. Wells D.L., Coppersmith K.J., 1994. New Empirical Relationships among Magnitude, Rupture Length, Rupture Width, Rupture Area and Surface Displacement. Bulletin of the Seismological Society of America 84 (4), 974–1002. https://doi.org/10.1785/BSSA0840040974.
32. Youngs R.R., Coppersmith K.J., 1985. Implications of Fault Slip Rates and Earthquake Recurrence Models to Probabilistic Seismic Hazard Estimates. Bulletin of the Seismological Society of America 75 (4), 939–964. DOI:10.1785/BSSA0750040939.
33. Zelenin E., Bachmanov D., Garipova S., Trifonov V., Kozhurin A., 2022. The Active Faults of Eurasia Database (AFEAD): The Ontology and Design behind the Continental-Scale Dataset. Earth System Science Data 14 (10), 4489–4503. https://doi.org/10.5194/essd-14-4489-2022.
3 Zulfiyahonima St, Tashkent 100128
3 Zulfiyahonima St, Tashkent 100128
3 Zulfiyahonima St, Tashkent 100128
3 Zulfiyahonima St, Tashkent 100128
Ibragimov R.S., Ibragimova T.L., Mirzaev M.A., Ashurov S.H. RANKING OF SEISMIC INTENSITY ATTENUATION LAWS AND MODELING OF SEISMIC SOURCES FOR SEISMIC HAZARD ASSESSMENT IN UZBEKISTAN. Geodynamics & Tectonophysics. 2024;15(4):0770. https://doi.org/10.5800/GT-2024-15-4-0770. EDN: PEIYOD


Editor-in-Chief
Sklyarov E.V.664033, Irkutsk, Lermontova St., 128,
IEC SB RAS Institute of the Earth's crust
E-mail.: gt@crust.irk.ru
tel.: 8 3952 425422
Processing of personal data


