


Contents
Scroll to:
https://doi.org/10.5800/GT-2024-15-6-0799
EDN: TSUQKN
Scroll to:
Southeast and Central Sulawesi are the areas characterized by high tectonic activity due to the presence of the active Matano fault. The seismicity along this fault is high. However, the initial hypocenter often deviates from the fault’s trend line, thus causing the need for earthquake relocation with an improved local structure description. The double difference method stands out as a precise technique for hypocenter relocation, utilizing the data on relative travel time between hypocenter pairs. After relocation, the selected hypocenter facilitates the derivation of a focal mechanism, crucial in determining fault types. In this research, we relocated the hypocenters of 485 events of January 2009 to December 2016, ranging in magnitude from M2 to M6.1, 427 of which showed a pattern close to the general trend of major and minor faults. Seismic offsets along the Matano fault are predominantly oriented in the southeast or northwest direction. Moreover, most of the earthquake activity recorded at a depth of 10 km before relocation is no longer visible. Based on the statistics, the time residuals from –2.5 to +2.5 ms resulting from the relocation procedure are better close to 0 than those of –4.5 to +4.5 ms for the events before relocation. The focal mechanism solutions of 16 events of final relocation are dominated by strike-slip faulting. The Matano fault is predominantly sinistral-type. The seismicity along this fault zone results from an activity of this fault, which is the main source of earthquakes, and from its interaction with the neighboring Palu-Koro and Sorong faults.
Massinai M.I., Bamba O.S., Ical A., Aswad S., Massinai M.A., Sulastri INTERPRETING FAULT DYNAMICS IN TERMS OF HYPOCENTER RELOCATION AND FAULT CHARACTERIZATION. Geodynamics & Tectonophysics. 2024;15(6):0799. https://doi.org/10.5800/GT-2024-15-6-0799. EDN: TSUQKN
The intricate dynamics of fault systems in seismically active regions have long captivated geoscientists, offering invaluable insights into seismic hazard assessment and tectonic processes. Among these regions, Southeast and Central Sulawesi stand as compelling landscapes characterized by high tectonic activity attributed to the presence of the Matano fault. The Matano fault, an active fault system in the area, has exhibited substantial seismicity, prompting a meticulous examination to comprehend its behavior and seismic implications.
The Matano fault is well-known as an earthquake source in Sulawesi. This fault has a surface-rupturing earthquake recurrence interval of 200–470 years and a slip rate of 21±9 mm/yr [Patria et al., 2023]. The oldest recorded earthquake in this area dates back to 5218–4446 years BP [Daryono et al., 2021]. One of the damaging earthquakes with magnitude Mw 7.5 occurred on September 28, 2018 and was followed by a 4 to 7 m high tsunami, possibly associated with submarine landslides [Patria, Putra, 2020]. These earthquakes occurred in the vicinity of the Palu-Koro fault.
Many earthquakes ever occurred in Central Sulawesi, Southeast Sulawesi, and South Sulawesi were caused by the active Matano fault. Among them there were a M6.1 earthquake of February 15, 2011 at 23:37 WIT near the west coast of Lake Matano and shallow earthquakes. Earthquakes caused damage to concrete walls and buildings including houses in the Mohalona area [Advokaat et al., 2017]. Another earthquake, which had a magnitude of 4.9, occurred on January 4, 2021, at 02:13 WIT in the Bahodopi area, Southeast Sulawesi, at a depth of 10 km. The earthquake caused damage to many houses in that area.
An earthquake is a natural phenomenon produced from a sudden energy release of rocks in Earth’s crust whose elastic limit is exceeded. There are several earthquake parameters such as origin time, hypocenter, earthquake magnitude, and earthquake intensity. The point of origin of an earthquake that releases energy accumulated inside the Earth is called the hypocenter.
The arrangement of hypocenters might represent a fault or a similar structure. However, in many cases the hypocenter may not be located on a fault, so that an effort needs to be made to relocate an earthquake to describe the in situ structures [Massinai et al., 2017]. Seismicity analysis along the Matano fault often reveals a notable discrepancy between initial hypocenter locations and the anticipated fault trend, necessitating the refinement of earthquake locations for a comprehensive understanding of local fault structures. One of the considered methods that is accurate for determining the hypocenter position is the double difference method [Muttaqy et al., 2023; Waldhauser, Ellsworth, 2000]. The application of the double difference method for hypocenter relocation emerges as a precise technique, leveraging relative travel time data to determine the precise hypocenter positions. This refined seismicity dataset enables a more nuanced exploration of fault characteristics and behavior.
The double difference algorithm uses relative travel time data to move between two adjacent hypocenters. This method has been widely used in various parts of the world. In Indonesia, this method was used, among others, by [Putra et al., 2023] on the Great Sumatera fault, [Muttaqy et al., 2023] in Central and East Java, and [Widiyantoro et al., 2024] in Sunda Arc. A comprehensive understanding of the fault structure and dynamics is attainable through the process of hypocenter relocation and subsequent fault characterization. The focal mechanisms derived based on selected hypocenter relocations facilitate the further determination of fault types, offering key insights into fault movement and seismic behavior along the Matano fault. This feature has been implemented in Indonesia as well as in West Sumatera by [Supendi et al., 2023].
This study aims to delve into the insights gleaned from the precise relocation of hypocenters and subsequent characterization of the Matano fault. This research seeks to contribute to fundamental knowledge crucial for estimating seismic hazard.
In [Advokaat et al., 2017] used the term "suture" to describe complex tectonic events that occur in Indonesia, including those on the island of Sulawesi. There are five sutures in Indonesia: Sulawesi, Maluku, Sorong, Banda, and Kalimantan. According to [Hall, Wilson, 2000], the Sulawesi Suture was formed as a result of the collision between the Sunda and Australian plates; it is a zone of a very complex accretion, consisting of fragments of ophiolites, arc islands, and continents. The Sulawesi Suture is thought to be Late Oligocene to Early Miocene and still exists nowdays. Tectonic activity is a cause of the emergence of an area vulnerable to earthquake damage. There is the manifestation of tectonics on faults and volcanoes. The faults scattered across the island of Sulawesi and its surroundings are Walannae fault (South Sulawesi), Palu-Koro fault (bordering the Makassar Strait), Gorontalo fault, Batui fault (Central Sulawesi), Makassar Strait thrust fault, Matano fault, Lawanopo fault, and Kolaka fault (Southeast Sulawesi) [Massinai et al., 2015].
The Matano fault is a northwest–east–southeast–trending sinistral fault which cuts through Central Sulawesi and Lake Matano. Matano has been active since the Quaternary period [Bellier et al., 2006]. The slip rate along the Matano fault is 4 to 32 mm/year. The geodetic slip rate for the Matano fault is 14 to 44 mm/year [Irsyam et al., 2017]. On land, the Matano fault borders a rectangular valley running from the beach in the southeastern arm of Sulawesi, cutting the Poso thrust fault in Central Sulawesi and, finally, joining the Palu-Koro fault [Massinai et al., 2018].
Some researchers believe that the Matano fault is on the west end of the Sorong fault [Tjia, 1978] while others suggest that it is a continuation of the Palu-Koro fault [Hamilton, 1973; Parkinson, Dooley, 1996; Patria, Putra, 2020; Watkinson, Hall, 2011]. However, the Matano fault area has not been studied enough yet to know the true state of things because of limited research therein [Watkinson, Hall, 2011]. The movement along the Matano fault resulted in earthquakes along the fault line that passes through Central Sulawesi and Southeast Sulawesi [Silver et al., 1983].
The Matano fault is divided into 6 segments that are Kuleana, Pewusai, Matano, Pamsoa, Ballawai, and Geresa (Fig. 1). Based on the data on earthquakes recorded from 1961 to August 2019, the total number of earthquakes occurred in the 58-year period on the Matano fault is 435, classified as that of shallow-focus earthquakes [Kurniawati et al., 2020].
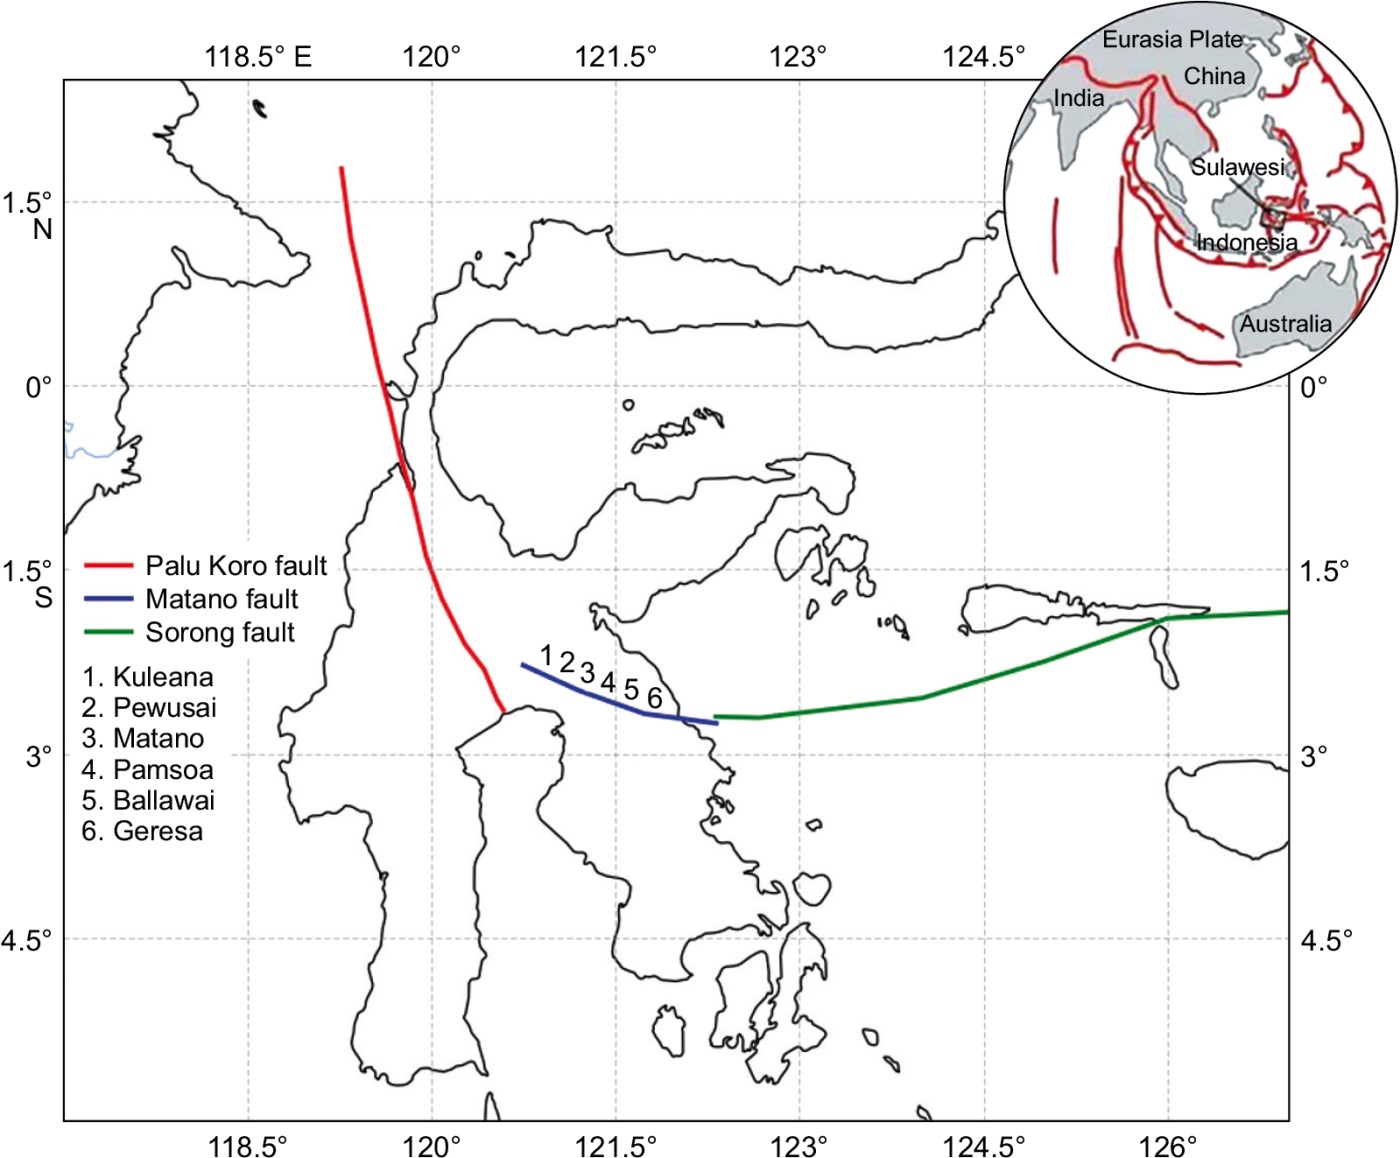
Fig. 1. Matano fault and its 6 segments modified from [Bellier et al., 2006; Daryono et al., 2021].
Рис. 1. Разлом Матано и его 6 сегментов по [Bellier et al., 2006; Daryono et al., 2021].
The study focuses on the tectonically active regions of Southeast and Central Sulawesi, Indonesia. Specifically, the investigation sites at the Matano fault and its proximal areas are in a region of high seismic activity.
This study deals with the earthquakes that occurred in the vicinity of the Matano fault, which is at the coordinates 2.1–2.8°S and 120.6–122.4°E. Geographically, the research area is bounded on the west by South Sulawesi, on the northwest – by Central Sulawesi, on the east – by the Bay of Tolo and the Banda Sea, and on the south – by Southeast Sulawesi. The data involved are the secondary data on the single event determination (SED) results from the Meteorology, Climatology, and Geophysics Agency of Indonesia (Badan Meteorologi Klimatologi dan Geofisika, Indonesia (BMKG)), such as hypocenter data, station location, and magnitude of the events which occurred from January 2009 to December 2016. The selection of data from 2009 to 2016 in this study is based on the availability of the sources referred to herein. The focus on this time period was chosen to ensure consistency in seismic analysis and fault characterisation. Moreover, the selection of a specific time period is in line with our research objective to gain a comprehensive understanding of the fault dynamics and seismic activity in the studied region. Although that data set ends in 2016, we believe that this study provides a solid foundation for future research involving further data or different time periods. Opportunities for research expansion or collaboration with other researchers to deepen the understanding of fault dynamics in this region remain open.
The method used in this research adopts the method used by [Supendi et al., 2023; Putra et al., 2023; Muttaqy et al., 2023], which is to relocate the earthquake using double difference and to determine the type of fault activity using focal mechanism. The double difference method [Waldhauser, Ellsworth, 2000] was implemented in the HypoDD software [Waldhauser, 2001] to relocate earthquakes using a non-linear method. This method assumes that if the distance between pairs of earthquake hypocenters is shorter than their distance to the event-recording station and the scale length of velocity heterogeneity, then the ray paths of the earthquakes are similar. This causes the difference in travel time for two events observed at one station to be attributed to the spatial shift between the hypocenter pairs. The HypoDD software can reduce the residual between the observed and calculated travel times for pairs of hypocenters of earthquakes recorded at the same station. This will minimize errors caused by inaccurate velocity models without station corrections [Muttaqy et al., 2023; Putra et al., 2023].
The earthquake data used as input relocation consist of 485 M2–M6.1 mainshocks occurred between January 2009 and December 2016 at depths of 1–40 km. The whole method of relocation in this research uses the 1D velocity model obtained according to the IASP91 global earth velocity model [Kennett, Engdahl, 1991] assumed to be homogeneous and isotropic. The stations in use are 28 stations spread across Sulawesi and several stations beyond Sulawesi. Other data are the waveform data obtained from the BMKG database for many selected earthquakes. Polarity is a property of a wave that can be positive or negative. From nature conditions, we could know about a wave using polarity data. Waveform polarity data is obtained from wave picking results, which will then be used to determine the focal mechanism.
Fig. 2 shows an epicenter scatter before relocation in active fault zones using the double difference method randomly along the fault.
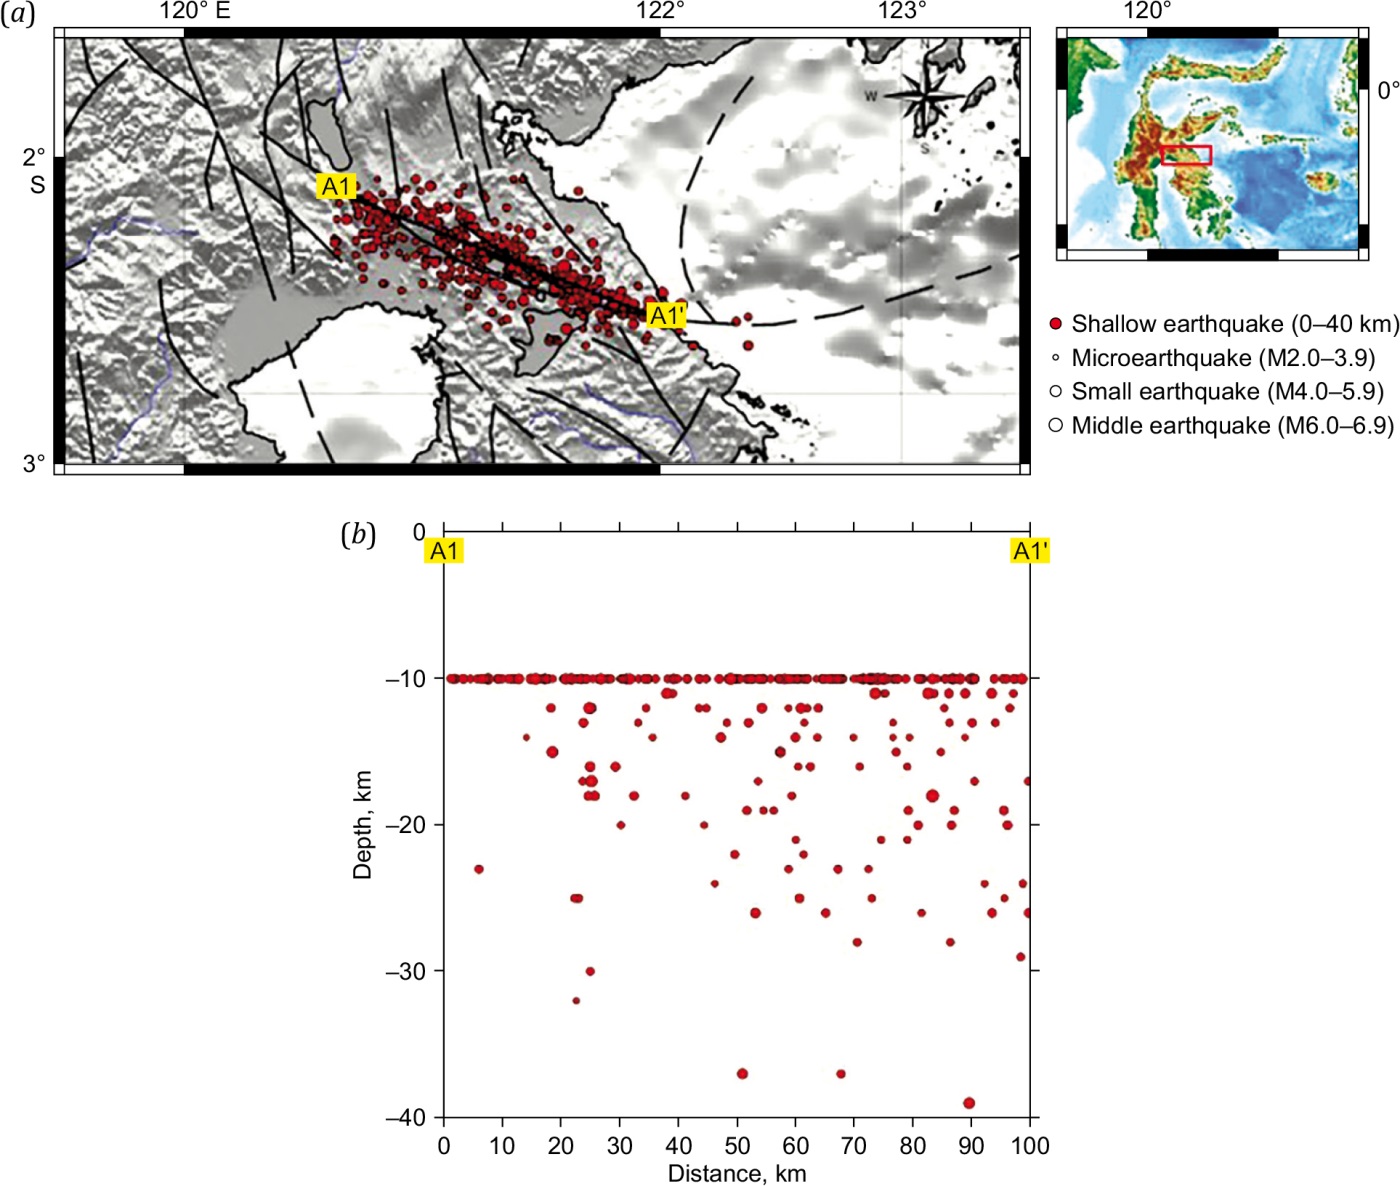
Fig. 2. Epicenters and hypocenters of earthquakes before relocation. (a) – distribution of epicentres before relocation, (b) – A1 - A1' cross section showing the distribution of hypocenters according to depth before relocation.
Рис. 2. Эпицентры и гипоцентры землетрясений до релокации. (a) – распределение эпицентров до релокации, (b) – поперечный разрез A1 - A1', показывающий распределение гипоцентров по глубине до релокации.
The vertical slice in Fig. 2 shows the hypocenter depth distribution. As indicated by A1–A1' slices, the hypocenters are located in a cluster at a depth of 10 km, which depends on the hypocenter distribution by SED. It is needed to conduct relocation because the hypocenter scatter obtained based on the depth starts to vary and becomes more consistent with the geological environment of the area.
Relocation results (Fig. 3) show a cluster consisting of 427 events. The cluster was dominant throughout the entire Matano fault zone. Some earthquakes are not included in the cluster. The earthquakes are likely caused by microfaults around the Matano fault zone.
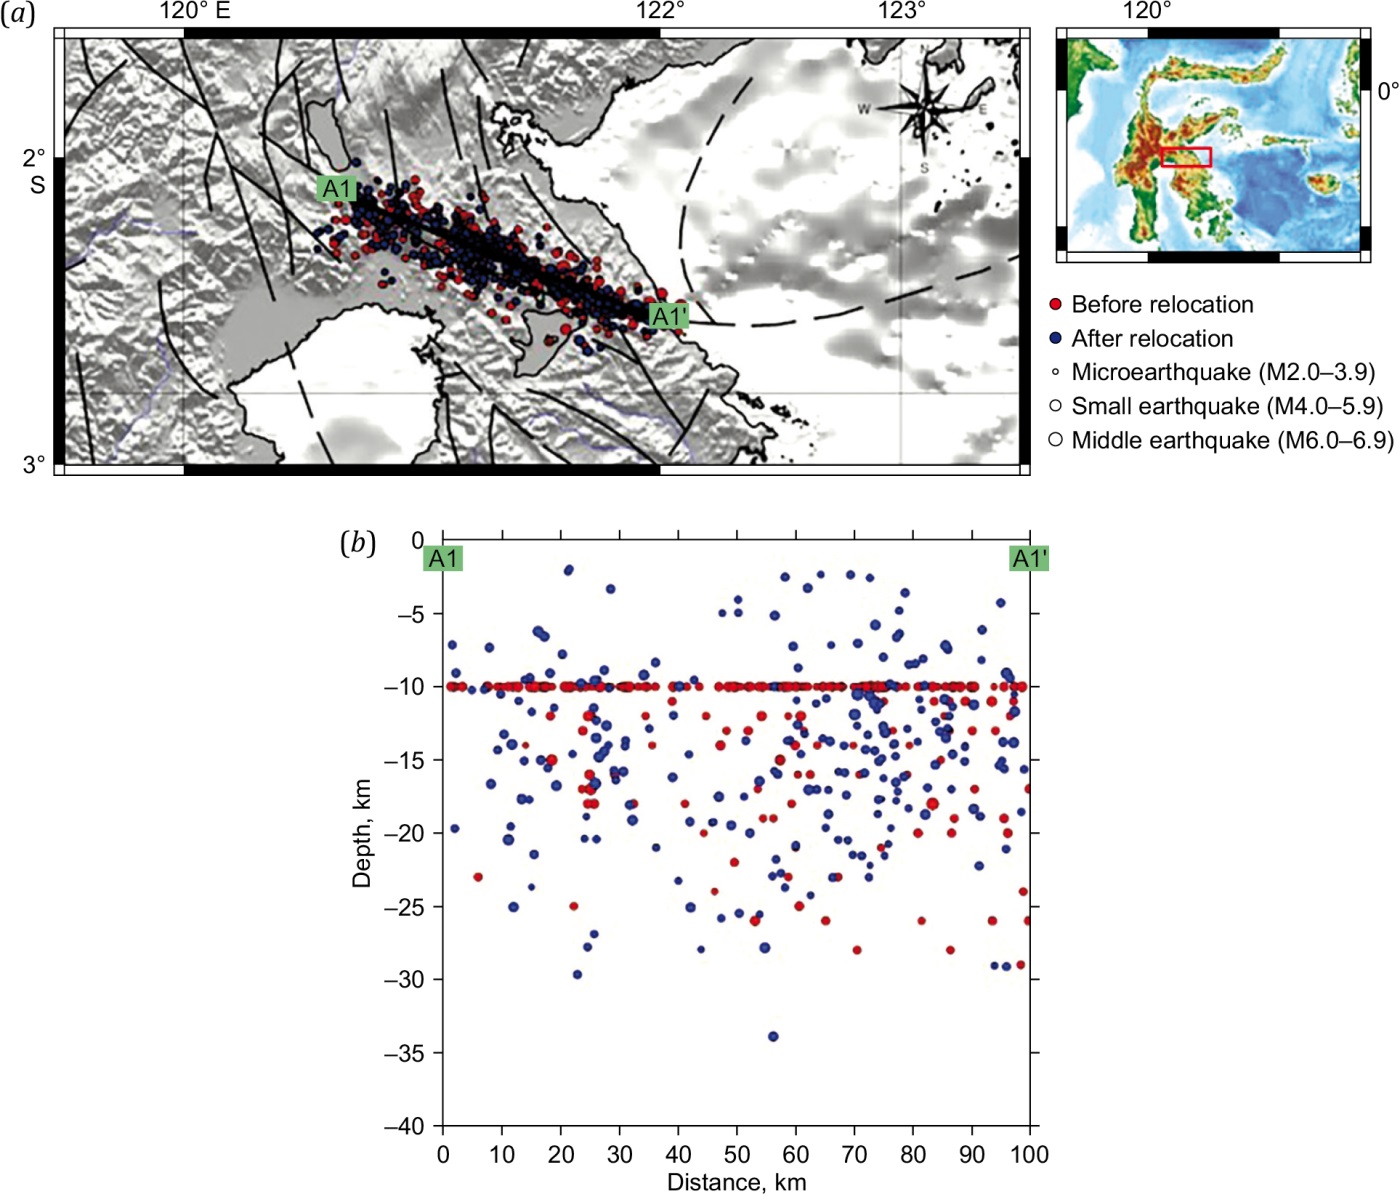
Fig. 3. Epicenters and hypocenters of earthquakes before and after relocation.
(a) – distribution of epicenters before (red dots) and after (blue dots) relocation, (b) – A1 - A1' cross section showing the distribution of hypocenters according to the depth before (red dots) and after (blue dots) relocation.
Рис. 3. Эпицентры и гипоцентры землетрясений до и после релокации.
(a) – распределение эпицентров до (красные точки) и после (синие точки) релокации, (b) – поперечный разрез A1 - A1', показывающий распределение гипоцентров в зависимости от глубины до (красные точки) и после (синие точки) релокации.
This cluster indicates that seismic activity of the Matano fault is concentrated along the inferred Matano fault line. The blue dots in Fig. 3, which are the results of relocation, are located closer to the inferred Matano fault than the red dots, which are initial hypocenters tending to scatter and not tightly arranged in a line showing the inferred Matano fault location. This relocation, resulted in cluster domination. can indicate a close relationship between earthquakes and ongoing tectonic deformation along the Matano fault. These active fault zones may experience accumulation of stress and its periodic release causing a series of earthquakes within the cluster.
However, the presence of several earthquakes beyond this main cluster cannot be ignored. These earthquakes are most likely related to microfault activity around the Matano fault zone. These microfaults, though smaller and less significant than the Matano fault, still play a role in regional seismic dynamics. The activity of these microfaults may reflect the complexity of the tectonic structure in the region and contribute to a better understanding of the distribution and frequency of earthquakes in this area.
Furthermore, the activity of these microfaults suggests that, besides the main faults, there is another source of earthquakes represented as a small-scale fault network that contributes to seismic process as a whole. The microfaulting activty is maintained by the activity of the Matano fault which complicates the fault network therein.
The epicentre distribution in Fig. 3 is that after relocation showing a convergent trend as compared to epicentre distribution before relocation. Vertical slices show hypocenter distribution based on depth. Before relocation, deep events dominated at a depth of 10 km. It may depend on inversion method for single event determination SED. After relocation, the depth varies from 0 to 30 km, fitting with the depth of the Matano fault which is around 30 km [Massinai et al., 2017]. Hypocenter distribution after relocation indicated by blue dots looks more varied as compared to deep earthquake distribution before relocation indicated by red dots.
The application of the double difference method for hypocenter relocation yielded a refined dataset showing the distribution of relocated hypocenters along the Matano fault and its vicinity. The relocated hypocenters exhibited a notable alignment with both major and minor fault structures proximal to the main fault line. Statistical analysis revealed a shift in the distribution of earthquake epicenters predominantly in a southeast to northwest direction along the Matano fault zone.
The rose diagram (Fig. 4) shows the dominant direction of the epicenter change. Earthquake relocation along the Matano fault shows southeast-northwest direction. This is in accordance with the direction of the Matano fault movement, northwest-southeast or southeast-northwest. About 200 earthquakes changed their direction to the northwest and 120 earthquakes – to the southeast. This change is strongly influenced by the double-difference method input parameters and is also affected by the station distribution.
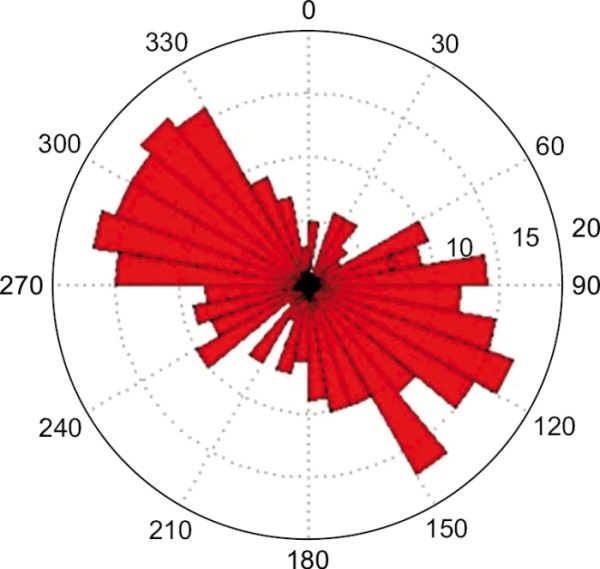
Fig. 4. Rose diagram of relocation.
Рис. 4. Роза-диаграмма релокации.
Relocation results are needed to perform validation by creating a residual time histogram. The validation diagram compares travel-time residuals before and after relocation. The validation can be done depending on whether the results of relocation are confirmed or not. Relocation results are good if the histogram of residuals shows high-frequency travel-time residual close to 0, and the value after relocation is smaller than that before relocation.
In Fig. 5, relocation processing shows a good result with the frequency travel-time residual close to 0 after relocation. The range of residuals before relocation is wider (–4.500…+4.500 ms) than after relocation (–2.500…+2.500 ms). This implies that there is no significant difference between the earth model and its origin, and the model is acceptable. The result of final hypocenter relocation shows a trendline in each cluster. An earthquake cluster is followed by a major eartquake fault structure in the area. A number of a clusters where the trendline does not show a pattern suitable for a pattern of major fault (outliers) is small. This indicates the existence of a new trend pattern, presumably for minor fault movements that can trigger earthquakes on the main fault. Seismicity along the Matano fault is rather high. This is marked by annual high-level seismicity. Earthquakes that occurred are caused by the movements along the Matano fault and minor fault movements nearby. The minor fault may move when the Matano fault is moving.
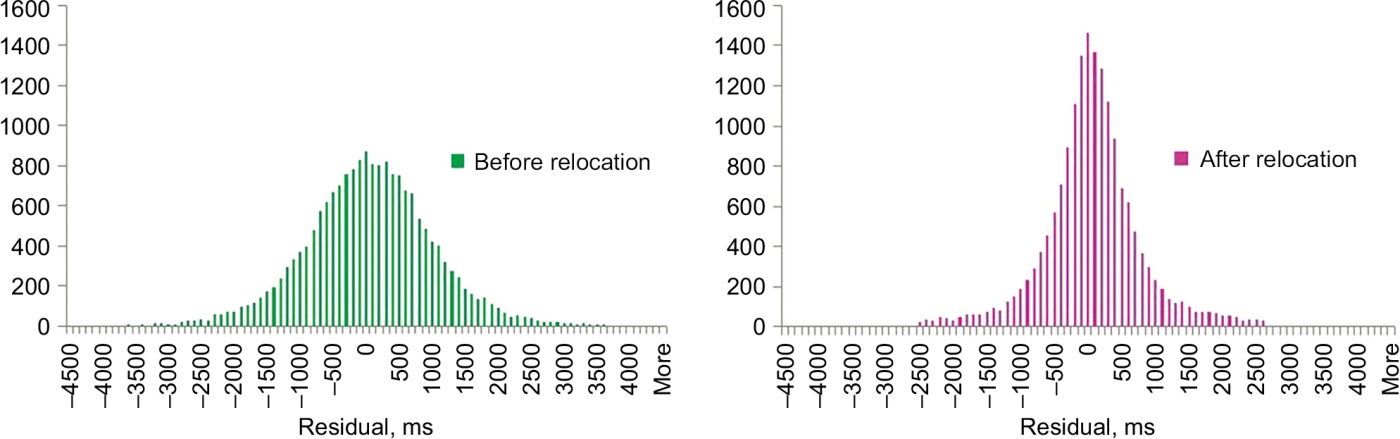
Fig. 5. Validation of travel-time residual before and after relocation.
Рис. 5. Валидация разности времен пробега до и после релокации.
Next are the results of the focal mechanism. Focal mechanisms derived from the relocated hypocenters offered crucial insights into fault behavior and movement patterns. The determined focal mechanisms supported the understanding of fault motion along the Matano fault. Based on earthquake distribution in the Matano fault zone that is 2.25–2.71°S and 120.69–122.04°E, this zone would be divided into four regions with the maximum-magnitude earthquakes representative of each region. The first region lies on the Kuleana and Pewusai segments, the second is in Matano and Pamsoa segments, the third – in the Ballawai segment, and the fourth – in the Geresa segment.
The first region is located on the Kuelana and Pewusai segments. There are four earthquakes (Table 1) with the maximum magnitude in this region. So the four events (Fig. 6) are two dextral-fault (right-lateral strike-slip fault) earthquakes, a sinistral-fault (left-lateral strike-slip fault) earthquake, and an oblique-fault earthquake with a normal component. We can conclude that earthquakes in this region are predominantly strike-slip fault earthquakes, especially right-lateral strike-slip fault (or dextral-fault) earthquakes, although there are also oblique-fault earthquakes.
Table 1. Four selected earthquake details in the first region
Табл. 1. Характеристики четырех отдельно взятых землетрясений в первом регионе
|
№ |
Origin Time (yyyy-mm-dd Thh:mm:ss) |
Latitude, S |
Longitude, E |
Depth, km |
Magnitude |
Focal Mechanism |
|
1 |
2015-01-01 T22:20:05 |
2.22 |
120.88 |
10 |
4.6 |
|
|
2 |
2009-05-15 T22:15:38 |
2.30 |
120.80 |
21 |
4.5 |
|
|
3 |
2010-01-18 T23:17:32 |
2.32 |
121.02 |
31.9 |
4.4 |
|
|
4 |
2016-12-09 T02:26:33 |
2.18 |
120.81 |
36.3 |
4.4 |
|
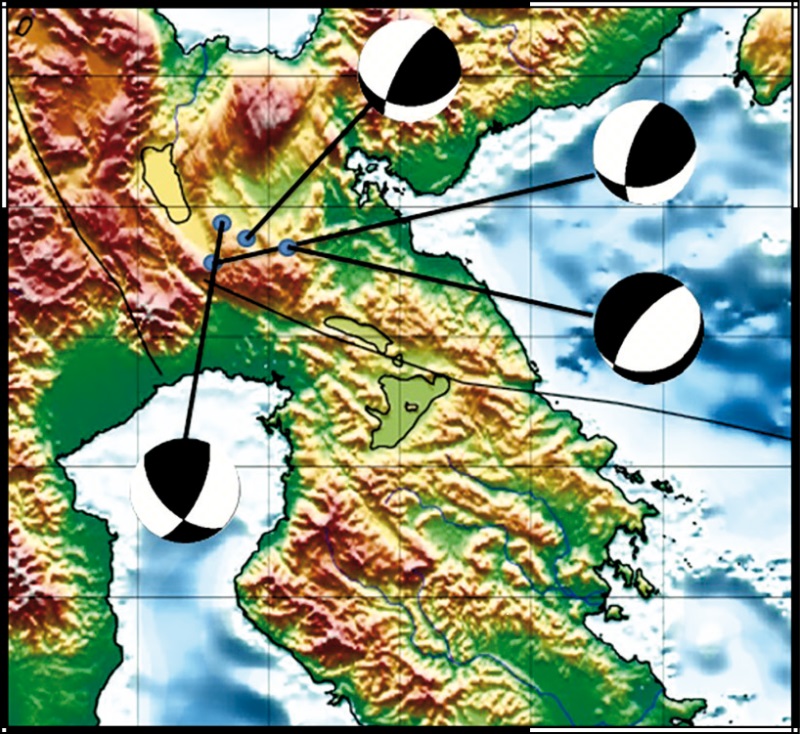
Fig. 6. Earthquake focal mechanism distribution in the first region.
Рис. 6. Распределение механизмов очагов землетрясений в первом регионе.
In the second region, there were selected four events whose parameters and focal mechanisms are listed in Table 2 and shown in Fig 7, respectively. The focal mechanisms are similar to those in the first region, so we can conclude that earthquakes in this region are predominantly right-lateral strike-slip fault earthquakes, though there are also oblique normal faults.
Table 2. The parameters of four earthquakes selected in the second region
Табл. 2. Параметры четырех отдельно взятых землетрясений во втором регионе
|
№ |
Origin Time (yyyy-mm-dd Thh:mm:ss) |
Latitude, S |
Longitude, E |
Depth, km |
Magnitude |
Focal Mechanism |
|
1 |
2009-09-10 T20:24:28 |
2.34 |
121.31 |
10 |
4.7 |
|
|
2 |
2012-01-29 T07:35:19 |
2.32 |
121.30 |
10 |
4.7 |
|
|
3 |
2009-01-02 T02:52:17 |
2.27 |
121.18 |
35 |
4.3 |
|
|
4 |
2011-03-24 T22:03:25 |
2.38 |
121.26 |
22 |
4.1 |
|
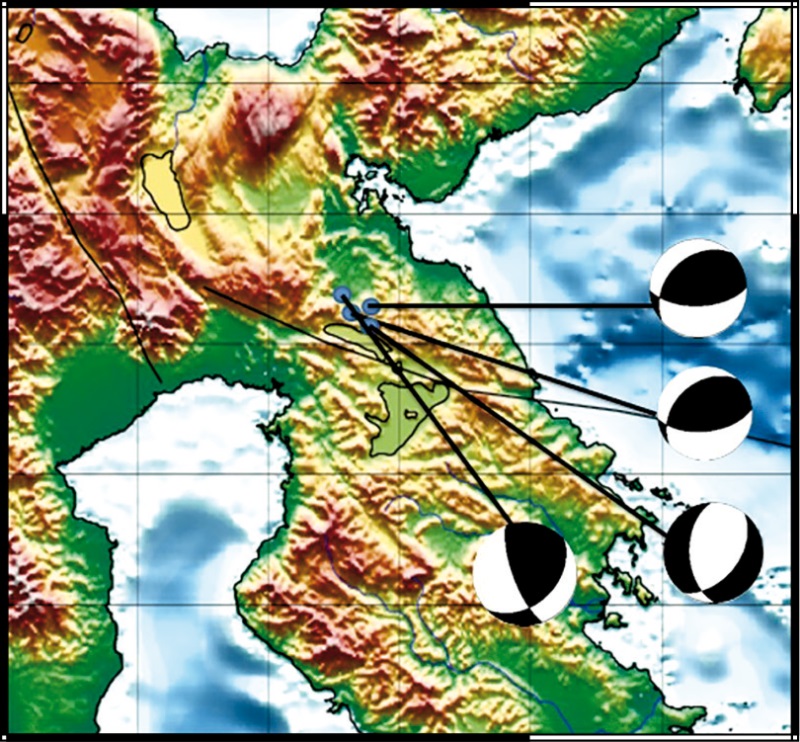
Fig. 7. Earthquake focal mechanism distribution in the second region.
Рис. 7. Распределение механизмов очагов землетрясений во втором регионе.
The pattern is different in the third region. There are three sinistral (leftlateral) and one dextral strike-slip fault earthquakes (Fig. 8). In the first and second regions, the pattern of earthquakes is predominanly represented by dextral strike-slip fault kinematics. The parameters of the events are listed in Table 3.
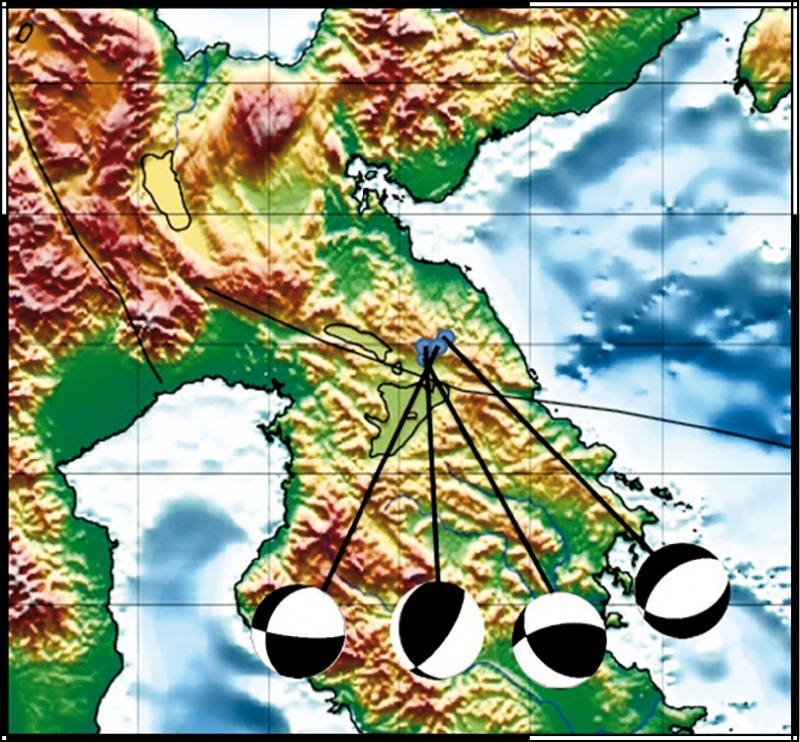
Fig. 8. Earthquake focal mechanism distribution in the third region.
Рис. 8. Распределение механизмов очагов землетрясений в третьем регионе.
Table 3. Parameters of four earthquakes selected in the third region
Табл. 3. Параметры четырех отдельно взятых землетрясений в третьем регионе
|
№ |
Origin Time (yyyy-mm-dd Thh:mm:ss) |
Latitude, S |
Longitude, E |
Depth, km |
Magnitude |
Focal Mechanism |
|
1 |
2011-11-07 T02:29:50 |
2.42 |
121.62 |
11 |
4.3 |
|
|
2 |
2014-02-10 T19:31:57 |
2.49 |
121.56 |
7.9 |
4.5 |
|
|
3 |
2011-02-15 T13:33:55 |
2.47 |
121.55 |
34 |
6.1 |
|
|
4 |
2011-02-15 T23:02:12 |
2.46 |
121.58 |
29.8 |
4.7 |
|
The parameters of events in the fourth region are listed in Table 4. There are three sinistral (left-lateral) strike-slip fault earthquakes and one normal-fault earthquake (Fig. 9). Normal faulting along the Matano fault is of interest. It shows that the Matano fault has a complex structure that involves strike-slip fault with normal-slip component.
Table 4. Parameters of four earthquakes selected in the fourth region
Табл. 4. Параметры четырех отдельно взятых землетрясений в четвертом регионе
|
№ |
Origin Time (yyyy-mm-dd Thh:mm:ss) |
Latitude, S |
Longitude, E |
Depth, km |
Magnitude |
Focal Mechanism |
|
1 |
2012-04-16 T02:17:52 |
2.63 |
121.89 |
27.9 |
5.9 |
|
|
2 |
2012-05-01 T13:59:44 |
2.67 |
121.95 |
39.2 |
5.3 |
|
|
3 |
2012-04-16 T18:01:18 |
2.59 |
121.90 |
39.8 |
5.3 |
|
|
4 |
2012-05-17 T23:50:07 |
2.65 |
121.92 |
35 |
4.9 |
|
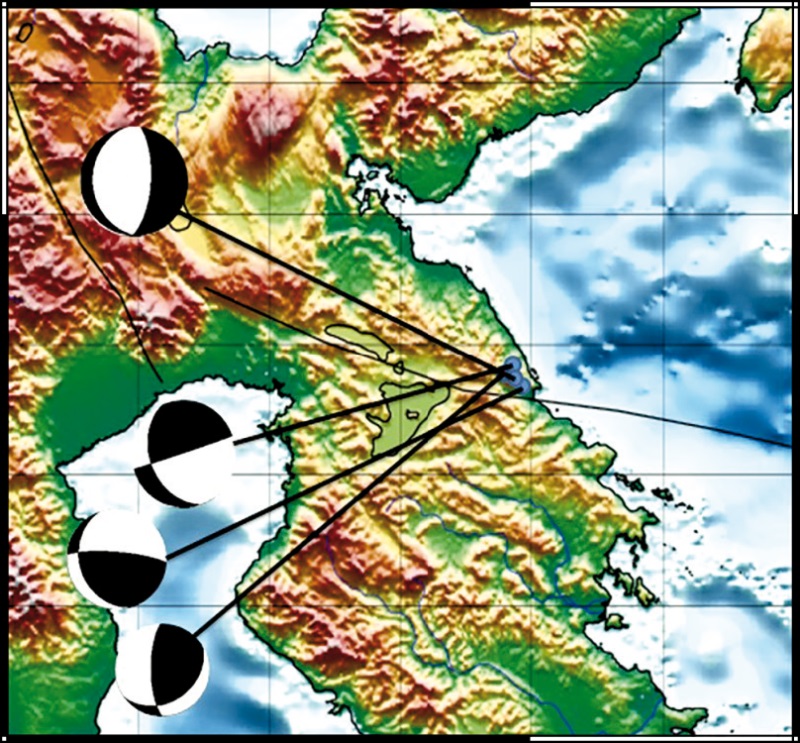
Fig. 9. Earthquake focal mechanism distribution in the fourth region.
Рис. 9. Распределение механизмов очагов землетрясений в четвертом регионе.
The final hypocenter is chosen from as many as 16 events (M4.1–6.1) that can represent the Matano fault. In Fig. 10, those 16 beachballs in 4 regions are dominated by strike-slip faults. Among them, there are 8 sinistral faults, 5 dextral faults, 2 oblique (thrust-slip) faults, and 1 normal fault. Analysis of the obtained 16 beachballs supported the understanding of fault motion along the Matano fault, emphasizing the significance of sinistral faulting as the dominant fault mechanism, even though there were found other fault types. Many previous research studies such as done by [Massinai et al., 2015; Watkinson, Hall, 2017; Kurniawati et al., 2020] showed that the Matano fault is sinistral. The sinistral fault pattern that occurs in the direction of the study area follows the movement of the Matano fault trending northwest-southeast or southeast-northwest. In the study area, there are some other fault patterns such as normal fault. The previous research studies done by [Vuillemin et al., 2023] also supported that the Matano fault has a normal component. However, there are also other influences on tectonic regime. This tectonic regime may be influenced by the Sorong fault [Massinai et al., 2015]. Sorong fault is in the east, where the direction of movement is west. The movement of the Sorong fault follows the westward movement pattern of the Matano fault. The Matano fault is connected to the South Sula fault and to the Tolo thrust [Patria et al., 2023]. Besides the Sorong fault, the Palu-Koro fault also affects the Matano fault movement. The direction of movement of the Palu-Koro fault is northwest-southeast. The Palu-Koro fault is assumed to be connected to the Matano fault at its southern end [Watkinson, Hall, 2011]. The Palu–Koro and Matano faults have been reactivated due to the Mid-Pliocene E–W collision between the East Sulawesi and the Banggai Sula blocks in the eastern arm of Sulawesi. Both faults accommodate left-lateral slip transferred from the E–W convergence [Patria, Putra, 2020]. The Palu-Koro fault movement will spread south, and the Matano fault is west-trending [Watkinson, Hall, 2011]. There is the possibility that the Palu-Koro fault and Matano fault are in the process of merging.
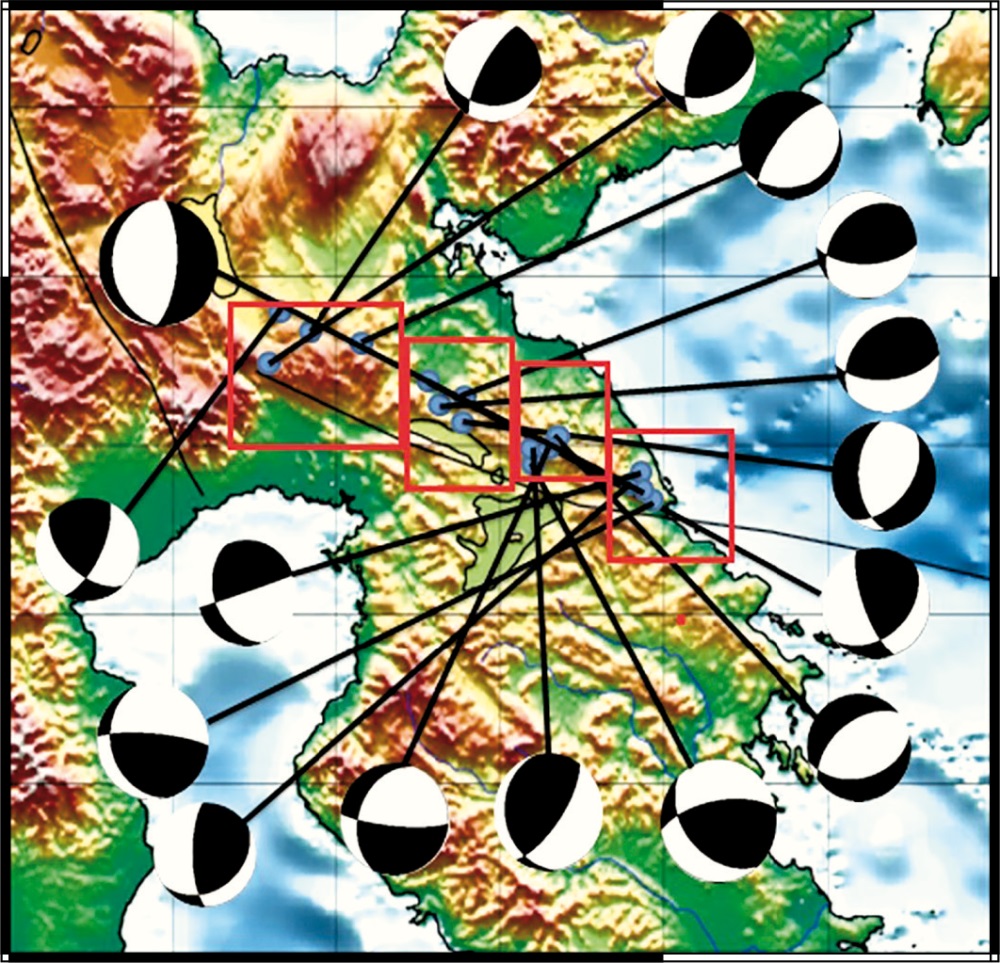
Fig. 10. Distribution of focal mechanisms in the Matano fault area.
Рис. 10. Распределение механизмов очагов землетрясений в районе разлома Матано.
The comprehensive analysis of seismicity distribution, fault characterization, and focal mechanisms provides vital inputs for seismic hazard assessment in the region. Understanding the fault dynamics along the Matano fault aids in delineating potential seismic hotspots and provides essential data for seismic risk mitigation strategies in Southeast and Central Sulawesi.
In conclusion, the elucidation of fault dynamics and seismic behavior along the Matano fault in Southeast and Central Sulawesi is still pivotal in advancing our understanding of regional seismic hazards. Seismicity in this area is affected by the Matano fault, which is the main source of earthquakes and influences minor faults. Relocation results for 427 events in total show the hypocenters following the trend and location of the Matano fault. To validate it, a comparison between timing residuals was made showing that the range of residual time after relocation is narrower (–2.500…+2.500 ms) than that before relocation (–4.500…+4.500 ms). So the relocation results can be accepted. The predominant southeast-northwest trend in epicenters of earthquakes on the Matano fault is consistent with the direction of movement therealong. The faults related to 16 earthquakes in the Matano fault area are predominantly sinistral-type, which follows the type of movement along the Matano fault itself. The other types of faults obtained, unaffected by the Matano fault, were influenced by other faults such as the Sorong and Palu-Koro faults. The comprehensive analysis presented in this study contributes to fundamental insights essential for seismic risk assessment, disaster mitigation, and future research studies in seismically active areas.
The authors would like to thank all those who have contributed to the research. This research was supported by data from the Department of Geophysics, Faculty of Mathematics and Natural Sciences, Hasanuddin University, and Meteorological Climatological and Geophysical Agency (BMKG). The authors used GMT [Wessel et al., 2019] for producing see Figs 2, 3, 6, 7, 8, 9, 10.
M.F.I. Massinai made the concept, analyzed the results and wrote the manuscript.
O.S. Bamba performed the hypocenter relocation and analysis. A. Ical performed the focal mechanism determination and analysis.
S. Aswad, M.A. Massinai and Sulastri held a comprehensive discussion about the methodology and seismological and geological results.
The authors declare that they have no conflicts of interest relevant to this manuscript. All authors read and approved the final manuscript.
1. Advokaat E.L., Hall R., White L.T., Watkinson I.M., Rudyawan A., Boudagher-Fadel M.K., 2017. Miocene to Recent Extension in NW Sulawesi, Indonesia. Journal of Asian Earth Sciences 147, 378–401. https://doi.org/10.1016/j.jseaes.2017.07.023.
2. Bellier O., Sébrier M., Seward D., Beaudouin T., Villeneuve M., Putranto, E., 2006. Fission Track and Fault Kinematics Analyses for New Insight Into the Late Cenozoic Tectonic Regime Changes in West-Central Sulawesi (Indonesia). Tectonophysics 413 (3–4), 201–220. https://doi.org/10.1016/j.tecto.2005.10.036.
3. Daryono M.R., Kumarawarman B., Muslim I.H., Triwurjani R., Permadi R., Prihatmoko S., Wibowo S., Tutuko G.H., 2021. Two Earthquake Events on the Pamsoa Segment of the Matano Fault, Sulawesi. IOP Conference Series: Earth and Environmental Science 873, 012053. https://doi.org/10.1088/1755-1315/873/1/012053.
4. Hall R., Wilson M.E.J., 2000. Neogene Sutures in Eastern Indonesia. Journal of Asian Earth Sciences 18 (6), 781–808. https://doi.org/10.1016/S1367-9120(00)00040-7.
5. Hamilton W.B., 1973. Tectonics of the Indonesian Region. Bulletin of the Geology Society of Malaysia 6, 3–10. https://doi.org/10.7186/bgsm06197301.
6. Irsyam M., Widiyantoro, S., Natawidjaja D.H., Meilano I., Rudyanto A., Hidayati S., Triyoso W., Hanifa N.R., Djarwadi D., Faizal L., Sunarjito (Eds), 2017. Peta Sumber dan Bahaya Gempa Indonesia Tahun 2017. Bandung, Indonesia, 376 p.
7. Kennett B.L.N., Engdahl E.R., 1991. Traveltimes for Global Earthquake Location and Phase Identification. Geophysical Journal International 105 (2), 429–465. https://doi.org/10.1111/j.1365-246X.1991.tb06724.x.
8. Kurniawati I., Ratri A.D.P., Gunawan T., 2020. Karakteristik Gempabumi DI Sesar Matano Menggunakan Analisis Energi Kumulatif dan Periode Ulang. Jurnal Geocelebes 4 (1), 33–40. https://doi.org/10.20956/geocelebes.v4i1.8919.
9. Massinai M.A., Massinai M.F.I., Harimei B., Alimuddin F., 2018. Analysis of Focal Mechanism Distribution in Northern Sulawesi. Journal of Physics: Conference Series 1093, 012038. https://doi.org/10.1088/1742-6596/1093/1/012038.
10. Massinai M.F.I., Lantu L., Aswad S., Massinai M.A., 2015. Tectonics Earthquake Distribution Pattern Analysis Based Focal Mechanisms (Case Study Sulawesi Island, 1993–2012). AIP Conference Proceedings 1658, 030013. https://doi.org/10.1063/1.4915021.
11. Massinai M.F.I., Nugraha A.D., Ramdhan M., Wandono W., 2017. Precise Hypocenter Determination Around Palu Koro Fault: A Preliminary Results. IOP Conference Series: Earth and Environmental Science 62, 012056. https://doi.org/10.1088/1755-1315/62/1/012056.
12. Muttaqy F., Nugraha A.D., Puspito N.T., Sahara D.P., Zulfakriza Z., Rohadi S., Supendi P., 2023. Double-Difference Earthquake Relocation Using Waveform Cross-Correlation in Central and East Java, Indonesia. Geoscience Letters 10, 5. https://doi.org/10.1186/s40562-022-00259-2.
13. Parkinson C., Dooley T., 1996. Basin Formation and Strain Partitioning Along Strike-Slip Fault Zones. Bulletin of the Geological Survey of Japan 47 (8), 427–436.
14. Patria A., Natawidjaja D.H., Rahmawan M., Daryono D., Hanif M., Puji A.R., Tsutsumi H., 2023. Tectonic Landform and Paleoseismic Events of the Easternmost Matano Fault in Sulawesi, Indonesia. Tectonophysics, 852, 229762. https://doi.org/10.1016/j.tecto.2023.229762.
15. Patria A., Putra P.S., 2020. Development of the Palu–Koro Fault in NW Palu Valley, Indonesia. Geoscience Letters 7, 1. https://doi.org/10.1186/s40562-020-0150-2.
16. Putra A.S., Nugraha A.D., Sahara D.P., Zulfakriza Z., Puspito N.T., Muttaqy F., Supendi P., 2023. Seismicity Pattern of the Great Sumatran Fault System from Hypocenter Relocation of Regional Seismic Network. Indonesian Journal on Geoscience 10 (1), 83–95. DOI:10.17014/ijog.10.1.83-95.
17. Silver E.A., McCaffrey R., Smith R.B., 1983. Collision, Rotation, and the Initiation of Subduction in the Evolution of Sulawesi, Indonesia. Journal of Geophysical Research: Solid Earth 88 (B11), 9407–9418. https://doi.org/10.1029/JB088iB11p09407.
18. Supendi P., Rawlinson N., Setiyo B., Sianipar D., Ash H., Dian A., Sahara D.P., Daryono D. et al., 2023. A Previously Unidentified Fault Revealed by the February 25, 2022 (Mw 6.1) Pasaman Earthquake, West Sumatra, Indonesia. Physics of the Earth and Planetary Interiors 334, 106973. https://doi.org/10.1016/j.pepi.2022.106973.
19. Tjia H.D., 1978. Active Faults in Indonesia. Bulletin of Geology Society of Malaysia 10, 73–92. https://doi.org/10.7186/bgsm10197806.
20. Vuillemin A., Mayr C., Schuessler J.A., Friese A., Bauer K.W., Lücke A., Heuer V.B., Glombitza C. et al., 2023. A One-Million-Year Isotope Record from Siderites Formed in Modern Ferruginous Sediments. Geological Society of America Bulletin 135 (1–2), 504–522. https://doi.org/10.1130/B36211.1.
21. Waldhauser F., 2001. HypoDD–A Program to Compute Doubledifference Hypocenter Locations. USGS Open-File Report 2001-113. https://doi.org/10.3133/ofr01113.
22. Waldhauser F., Ellsworth W.L., 2000. A Double-Difference Earthquake Location Algorithm: Method and Application to the Northern Hayward Fault, California. Bulletin of the Seismological Society of America 90 (6), 1353–1368. https://doi.org/10.1785/0120000006.
23. Watkinson I.M., Hall R., 2011. The Palu-Koro and Matano Faults, Sulawesi, Indonesia: Evolution of an Active Strike-Slip Fault System. Geophysical Research Abstract 13, EGU 2011-8270.
24. Watkinson I.M., Hall R., 2017. Fault Systems of the Eastern Indonesian Triple Junction: Evaluation of Quaternary Activity and Implications for Seismic Hazards. Geological Society of London Special Publications 441, 71–120. https://doi.org/10.1144/SP441.8.
25. Wessel P., Luis J.F., Uieda L., Scharroo R., Wobbe F., Smith W.H.F., Tian D., 2019. The Generic Mapping Tools Version 6. Geochemistry, Geophysics, Geosystems 20 (11), 5556–5564. https://doi.org/10.1029/2019GC008515.
26. Widiyantoro S., Supendi P., Rawlinson N., Daryono M.R., Rosalia S., 2024. A Note on the Seismicity of Sumatra, Western Sunda Arc, Indonesia, in Relation to the Potential for Back-Arc Thrusting. Scientific Reports 14, 13115. https://doi.org/10.1038/s41598-024-64076-7.
Makassar 90245
Makassar 90245
Makassar 90245
Makassar 90245
Makassar 90245
Jakarta Pusat, DKI Jakarta 10610
Massinai M.I., Bamba O.S., Ical A., Aswad S., Massinai M.A., Sulastri INTERPRETING FAULT DYNAMICS IN TERMS OF HYPOCENTER RELOCATION AND FAULT CHARACTERIZATION. Geodynamics & Tectonophysics. 2024;15(6):0799. https://doi.org/10.5800/GT-2024-15-6-0799. EDN: TSUQKN


Editor-in-Chief
Sklyarov E.V.664033, Irkutsk, Lermontova St., 128,
IEC SB RAS Institute of the Earth's crust
E-mail.: gt@crust.irk.ru
tel.: 8 3952 425422
Processing of personal data


