


Contents
Scroll to:
https://doi.org/10.5800/GT-2024-15-6-0798
EDN: MPINZE
Scroll to:
The 2004 M9.2 Sumatra-Andaman earthquake in the tectonically active northern Sumatra, could generate postseismic deformation up to a recent period and needs to be considered for earthquake potential study. The GNSS velocities before and 15 years after the earthquake were used to obtain preliminary indicator of whether the postseismic deformation still takes place. Recent velocities were calculated from the horizontal coordinate time series that is obtained using Bernese GNSS software version 5.2. To do this, a comparison was made of velocities and strain rates over two periods. The velocities of 5.5 to 40.5 mm/yr and the strain rate up to 47.2 μstrain/yr were obtained from the recently acquired GNSS data. The pattern for the two-period values can be defined where the direction of vector velocities is trenchward, and extensional behavior occurs more often in the northern area. This indicates that postseismic deformation still occurs therein even 15 years after the earthquake.
Alif S.M., Anggara O., Jihad M.F., Perdana R.S. GNSS VELOCITY AND STRAIN FIELD IN THE NORTHERN SUMATRA 15 YEARS AFTER THE 2004 M9.2 SUMATRA ANDAMAN EARTHQUAKE. Geodynamics & Tectonophysics. 2024;15(6):0798. https://doi.org/10.5800/GT-2024-15-6-0798. EDN: MPINZE
Background. The study of past earthquakes is important for earthquake potential study in the future, and considering the postseismic deformation was the big issue. The postseismic deformations of the 2004 M9.2 Sumatra-Andaman or other earthquakes would overweigh the earthquake potential calculation. The earthquake, which occurred on 26 December 2004 00:58:53 UTC at 3.295° N, 95.982° E at a depth of 30.0 km according to the United States Geological Survey (USGS), produced coseismic slip of 16–25 m off the northern Sumatra [Fujii et al., 2021]. The coseismic slip model and the rheology (viscosity of asthenosphere) are the key estimate for the postseismic deformation of the earthquake [Lubis et al., 2013]. The question asises, however, what earthquake mechanism contributes most to the postseismic effects [Gunawan et al., 2014]. The studies using the data for more than a 10-year period after the earthquake could be a tool for the existing model validation and studying whether the postseismic deformation still takes place in the affected area [Mendoza et al., 2022].
Geological Settings. The northern Sumatra is one of the most tectonically active regions in the world, especially after the 2004 M9.2 Sumatra-Andaman earthquake. It is due to the oblique subduction of the Indo-Australia plate beneath the Sundaland plate [McCaffrey, 2009] of the western part of the Sumatra Island with the rate of plate convergence 44–48 mm/yr [DeMets et al., 2010]. The Sumatran fault zone that extends from southern to northern Sumatra [Natawidjaja, 2018] and exhibits a slip rate of 20 mm/yr [Ito et al., 2012] in the region makes up to 40 % of the trench-parallel component of the subduction (Fig. 1, a). The Northern Sumatra, which covers the Aceh Province and the North Sumatra Province in Indonesia, is the most affected region of the disastrous 2004 M9.2 Sumatra-Andaman earthquake and has been the subject of numerous studies, especially coseismic and postseismic modeling [Chlieh et al., 2007; Panet et al., 2010]. Unlike Alaska and Chile that also had produced M>9 earthquakes, the northern Sumatra was in a thermal state which led to a higher potential for other large earthquakes [Simoes et al., 2004].

Fig. 1. Tectonic settings of the Northern Sumatra (a). Red beach balls show series of earthquake with magnitude more than 7 from 2004 to 2010. Distribution of GNSS sites used in this research (b).
Рис. 1. Тектоническая обстановка северной части о. Суматра (а). Кружками красно-белого цвета обозначены серии землетрясений 2004–2010 гг. с магнитудой выше 7. Распределение ГНСС-приемников, используемое в настоящей работе (b).
The 2004 M9.2 Sumatra-Andaman earthquake in the northern Sumatra was followed by a large number of earthquakes in the Sumatra region, the most nearby and the largest of which is the 2005 M8.6 Nias earthquake that occurred in Nias, also in the northern Sumatra. The slip distribution of this earthquake is separated from that of the 2004 earthquake by a persistent barrier beneath the Simeulue Island [Morgan et al., 2017]. Other earthquakes (M>7) in Sumatra after the main 2004 events are the 2007 M8.5 Bengkulu earthquake, the 2008 M7.4 Simeulue earthquake, the 2009 M7.6 Padang earthquake, the 2010 M7.8 Mentawai earthquake, and the 2010 M7.8 Simeulue earthquake. The 2012 M8.6 earthquake which occurred west of the Sunda Trench, the boundary between the Indo-Australian plate and the Sundaland plate, was also affecting the northern and even the southern Sumatra [Alif et al., 2016]. These earthquakes were studied somewhat better than the 2004 earthquake, since the need emerged for more Global Navigation Satellite System (GNSS) monitoring sites after the 2004 earthquake.
The GNSS-based velocity monitoring tools become indispensable in the study of postseismic [Anugrah et al., 2015] or crustal deformations [Alif et al., 2021, 2023] and volcanoes [Anggara et al., 2023; Natadikara et al., 2023]. The study which only utilizes the GNSS velocities could be a preliminary indicator whether the postseismic deformation still takes place. The GNSS velocities relative to the plate (Sundaland plate in case of the northern Sumatra), should be directed toward the epicenter or toward the trench if the postseismic deformation still takes place. No study on GNSS velocities in northern Sumatra has been conducted to clarify the existence of the postseismic deformation. A similar approach has been applied to the 2007 M8.5 Bengkulu earthquake [Lubis, 2021] which showed no postseismic deformations during the period 2018–2020. This study will utilize the GNSS velocities and strain field 15 years after the 2004 M9.2 Sumatra-Andaman earthquake to obtain a preliminary indicator whether the postseismic deformation still takes place in the northern Sumatra.
Materials. The data used in this research are the GNSS data from 2017 to 2021 and the GNSS-velocities before 2004. These velocities are calculated from the campaign GNSS data collected at 34 sites scattered throughout Sumatra [Prawirodirdjo et al., 2010] before the 2004 M9.2 Sumatra Andaman earthquake. Meanwhile, the GNSS data recently collected at 28 permanent sites (Table 1) were provided by the Geospatial Agency of Indonesia (BIG) and the Earth Observatory of Singapore (EOS), named as Indonesia Continuous Operating Reference Stations (InaCORS) and Sumatran GPS Array (SuGAr) [McLoughlin et al., 2011], respectively. 7 SuGAr sites and 21 InaCORS sites, used in this research, are located in Aceh Province and North Sumatra Province, in mainland of Sumatra and surrounding small islands (Fig. 1, b). These sites were installed a relatively long time ago as compared to other InaCORS sites in Indonesia and SuGAr sites in Sumatra, and have been used for other crustal deformation studies [Maulida et al., 2016].
Table 1. GNSS sites used in this research
Таблица 1. ГНСС-станции, данные которых были использованы в настоящей работе
|
No. |
Site name |
Longitude (°) |
Latitude (°) |
Location |
Data period |
Reference |
|
1 |
CBDA |
95.6093 |
5.2963 |
Kota Jantho |
2019.0–2021.5 |
BIG |
|
2 |
CBKJ |
97.3435 |
3.9903 |
Blangkejeren |
2020.0–2021.5 |
BIG |
|
3 |
CBOH |
96.1298 |
4.1356 |
Meulaboh |
2018.5–2021.3 |
BIG |
|
4 |
CBPI |
96.8393 |
3.7399 |
Blangpidie |
2018.5–2021.5 |
BIG |
|
5 |
CBRS |
98.3979 |
2.0050 |
Barus |
2020.0–2021.5 |
BIG |
|
6 |
CKBJ |
98.4970 |
3.1023 |
Kabanjahe |
2018.5–2021.5 |
BIG |
|
7 |
CKCN |
97.3334 |
3.4875 |
Babussalam |
2020.0–2021.5 |
BIG |
|
8 |
CKTF |
97.3334 |
3.0868 |
Kluet Utara |
2018.5–2021.2 |
BIG |
|
9 |
CLAN |
95.5777 |
4.6348 |
Krueng Sabee |
2018.5–2021.4 |
BIG |
|
10 |
CLSA |
97.9659 |
4.4737 |
Langsa Kota |
2018.5–2021.3 |
BIG |
|
11 |
CPID |
96.2477 |
5.2513 |
Meureudu |
2018.5–2021.5 |
BIG |
|
12 |
CSAB |
95.3165 |
5.8936 |
Sabang |
2017.0–2021.5 |
BIG |
|
13 |
CSBL |
98.4051 |
2.7419 |
Sumbul |
2018.5–2021.5 |
BIG |
|
14 |
CSBS |
98.0011 |
2.6433 |
Simpang Kiri |
2020.0–2021.5 |
BIG |
|
15 |
CSIB |
98.7764 |
1.7409 |
Sibolga Kota |
2017.0–2021.5 |
BIG |
|
16 |
CSNB |
96.3855 |
2.4723 |
Simeulue Timur |
2020.0–2021.5 |
BIG |
|
17 |
CSSH |
96.8098 |
3.7204 |
Susoh |
2020.0–2021.5 |
BIG |
|
18 |
CTAK |
96.8477 |
4.6217 |
Lut Tawar |
2018.6–2021.5 |
BIG |
|
19 |
LHMI |
96.9470 |
5.2285 |
Muara Batu |
2018.5–2021.5 |
BIG |
|
20 |
NIAN |
97.5755 |
1.3037 |
Gunungstoli |
2019.0–2021.5 |
BIG |
|
21 |
SAMP |
98.7147 |
3.6216 |
Tembung |
2017.0–2021.5 |
BIG |
|
22 |
BIT2 |
97.8114 |
1.0786 |
Biouti–2 |
2017.0–2021.5 |
SuGAr |
|
23 |
BNON |
96.1509 |
2.5207 |
Bunon |
2017.0–2021.4 |
SuGAr |
|
24 |
LEWK |
95.8041 |
2.9235 |
Lewak |
2019.2–2021.4 |
SuGAr |
|
25 |
MREK |
98.5381 |
2.9699 |
SD Negeri Merek |
2017.0–2021.4 |
SuGAr |
|
26 |
RNDG |
97.8572 |
2.6652 |
Rundeng |
2018.7–2020.8 |
SuGAr |
|
27 |
SDKL |
98.1929 |
2.7966 |
Sidikang |
2017.0–2021.3 |
SuGAr |
|
28 |
UMLH |
95.3391 |
5.0531 |
Udjung Muloh |
2017.0–2021.5 |
SuGAr |
Methods. The new GNSS data were processed to obtain recent velocities in North Sumatra. The data which had the sampling interval of 30 seconds were processed using Bernese 5.2 [Dach et al., 2015] in a consistent reference frame. The daily solution of coordinates was obtained based on the double-difference positioning with the International GNSS Service (IGS) sites used as constrained sites (ALIC, DARW, DGAR, IISC, KARR, PIMO, YAR2) [Johnston et al., 2017]. The data from all sites were processed in ITRF2014 [Altamimi et al., 2016]. The IGS final ephemeris, the Earth rotation parameters, the IERS Conventions 2010, and the DRY-GMF model were utilized in the GNSS data processing to obtain more precise coordinates.
The recent velocities were calculated using linear regression of the processed coordinates. This linear regression can be conducted since the logarithmic trend or exponential trendlines were not found in the coordinate time series. Nevertheless, considering coordinate jumps induced by antenna replacement or some unknown factors, the stepwise linear regression [Feng et al., 2015] was applied to each clear offset. The least-square linear regression was performed after removing outliers with larger than 95 % confidence in the coordinate time series. In order to obtain recent velocities and velocities before 2004 in the same reference frame, the recent velocities were transformed from ITRF2014 position to the Sundaland plate reference frame. Prior to this transformation, all velocities were first transformed to ITRF2000 [Altamimi et al., 2016], since the velocities before 2004 were measured with respect to the ITRF2000-based Sundaland plate reference frame. The transformation to the Sundaland plate reference frame was calculated using Euler’s formula [Stein, Wysession, 2009] and the Euler pole parameter from the ITRF2000-based Sundaland plate model [Simons et al., 2007].
The postseismic deformations from the 2004 earthquake were analysed by doing a comparison between recent velocities and velocities before 2004 in the similar Sundaland Plate reference frame. The comparison was made in three ways. The first way is to perform a direct analysis of the velocity vector in these two time periods. The second way is to calculate strain in the area for these two time periods. The strain is calculated in each grid cell at a spacing of 25 km. The strain analysis was conducted to understand extension and shortening behaviour in this area before and 15 years after the 2004 earthquake. The third way is to perform the velocity subtraction between these two periods. The two steps necessarily conducted prior to the subtraction were as follows: interpolating inner-region velocities in each time period on a grid with spacing of 0.25° and finding all points between two given points on a grid. In short, the final comparison has been drawn between the interpolated velocities for common grid points.
The recent velocities range from 7.6 to 45.6 mm/yr within the ITRF2014 (Table 2). These velocities are horizontal velocities calculated from linear regression for horizontal coordinate time series of 28 GNSS sites (Fig. 2). There are three types of spatial patterns of these velocities (Fig. 3). The first type is the northeastward velocity pattern obtained from a relatively high velocity in small islands. This pattern follows the direction of subduction of the Indo-Australian plate. The second type refers to the southeastward velocities of the southern GNSS sites of the Sumatra Island. This pattern follows the direction of motion of the Sundaland plate with the velocity comparable to that of 15.3–31.4 mm/yr, reported by [Hanifa et al., 2014]. The third type follows the southward direction of motion of the GNSS sites in the northernmost area. This pattern appears to be highly related to the effect of postseismic deformation since it does not follow the direction of either subducting plate or plate motion.
Table 2. The velocities of the GNSS sites in ITRF 2014 and Sundaland Plate
Таблица 2. Скорости ГНСС-станций в системе ITRF 2014 и относительно плиты Сандаленд
|
Site |
ITRF2014 (mm/yr) |
Sundaland Plate (mm/yr) |
||||||
|
VE |
VN |
σVE |
σVN |
VE |
VN |
σVE |
σVN |
|
|
CBDA |
–3.9 |
–15.7 |
0.7 |
0.4 |
–33.3 |
–14.3 |
0.7 |
0.4 |
|
CBKJ |
19.6 |
0.4 |
1.3 |
0.9 |
–9.3 |
2.6 |
1.3 |
0.9 |
|
CBOH |
7.6 |
0.6 |
0.5 |
0.3 |
–21.3 |
2.2 |
0.5 |
0.3 |
|
CBPI |
15.9 |
5.4 |
0.2 |
0.1 |
–12.9 |
7.3 |
0.2 |
0.1 |
|
CBRS |
14.7 |
6.6 |
0.6 |
0.4 |
–13.3 |
9.4 |
0.6 |
0.4 |
|
CKBJ |
23.8 |
–7.4 |
0.2 |
0.1 |
–4.6 |
–4.6 |
0.2 |
0.1 |
|
CKCN |
27.0 |
3.3 |
1.0 |
0.7 |
–1.6 |
5.7 |
1.0 |
0.7 |
|
CKTF |
18.8 |
9.3 |
0.4 |
0.3 |
–9.6 |
11.5 |
0.4 |
0.3 |
|
CLAN |
1.4 |
–13.1 |
0.5 |
0.3 |
–27.8 |
–11.8 |
0.5 |
0.3 |
|
CLSA |
22.4 |
–7.2 |
0.3 |
0.1 |
–6.7 |
–4.7 |
0.3 |
0.1 |
|
CPID |
7.1 |
–12.5 |
0.2 |
0.2 |
–22.3 |
–10.8 |
0.2 |
0.2 |
|
CSAB |
1.1 |
–25.1 |
0.3 |
0.2 |
–28.6 |
–23.8 |
0.3 |
0.2 |
|
CSBL |
19.8 |
–1.5 |
0.2 |
0.1 |
–8.5 |
1.2 |
0.2 |
0.1 |
|
CSBS |
12.6 |
4.2 |
2.5 |
1.4 |
–15.7 |
6.7 |
2.5 |
1.4 |
|
Site |
ITRF2014 (mm/yr) |
Sundaland Plate (mm/yr) |
||||||
|
VE |
VN |
σVE |
σVN |
VE |
VN |
σVE |
σVN |
|
|
CSIB |
15.3 |
3.6 |
0.1 |
0.1 |
–12.5 |
6.5 |
0.1 |
0.1 |
|
CSNB |
31.9 |
27.6 |
0.7 |
0.4 |
3.7 |
29.3 |
0.7 |
0.4 |
|
CSSH |
2.2 |
19.9 |
0.6 |
0.3 |
–26.5 |
21.9 |
0.6 |
0.3 |
|
CTAK |
18.4 |
–4.2 |
0.3 |
0.2 |
–10.8 |
–2.2 |
0.3 |
0.2 |
|
LHMI |
13.1 |
–10.3 |
0.3 |
0.1 |
–16.3 |
–8.3 |
0.3 |
0.1 |
|
NIAN |
24.2 |
30.6 |
0.7 |
0.4 |
–3.4 |
33.0 |
0.7 |
0.4 |
|
SAMP |
20.9 |
–8.3 |
0.5 |
0.3 |
–7.8 |
–5.5 |
0.5 |
0.3 |
|
BIT2 |
25.9 |
26.5 |
0.4 |
0.2 |
–1.6 |
29.0 |
0.4 |
0.2 |
|
BNON |
33.9 |
22.1 |
0.1 |
0.1 |
5.8 |
23.7 |
0.1 |
0.1 |
|
LEWK |
37.8 |
25.6 |
0.5 |
0.3 |
9.5 |
27.1 |
0.5 |
0.3 |
|
MREK |
24.1 |
–6.2 |
0.3 |
0.2 |
–4.3 |
–3.4 |
0.3 |
0.2 |
|
RNDG |
15.6 |
7.2 |
1.4 |
0.6 |
–12.6 |
9.7 |
1.4 |
0.6 |
|
SDKL |
17.5 |
–0.3 |
0.1 |
0.1 |
–10.8 |
2.3 |
0.1 |
0.1 |
|
UMLH |
–6.7 |
–19.6 |
0.1 |
0.1 |
–36.1 |
–18.4 |
0.1 |
0.1 |

Fig. 2. Horizontal coordinate time series from 2017 to 2021 calculated in this research.
Рис. 2. Временные ряды горизонтальных координат, рассчитанные в настоящей работе за период 2017–2021 гг.

Fig. 3. ITRF2014 velocity data from 2017 to 2021.
Рис. 3. Данные скоростей за период 2017–2021 гг. в Международной системе наземных координат ITRF2014.
There is also a distinguishable pattern of velocity with reference to the Sundaland plate and its derived grid velocities. This pattern direction is changed for the velocities which refer to the Sundaland plate (Fig. 4). The first-type pattern for the small islands changes its direction to northward, the second-type pattern changes its direction to northwestward, and the third-type pattern changes its direction to westward. The velocities of 5.5 to 40.5 mm/yr refer to the Sundaland plate. The northernmost area is dominated by high velocities. The recent pattern for this area is also much different from the pattern of velocity prior to 2004 in the same area (Fig. 5). In general, the velocities prior to 2004 had smaller values and were more uniform as compared to the recent velocities.

Fig. 4. Velocities from 2017 to 2021 according to the Sundaland plate reference frame.
Рис. 4. Данные скоростей за период 2017–2021 гг. в системе отсчета движения плиты Сандаленд.
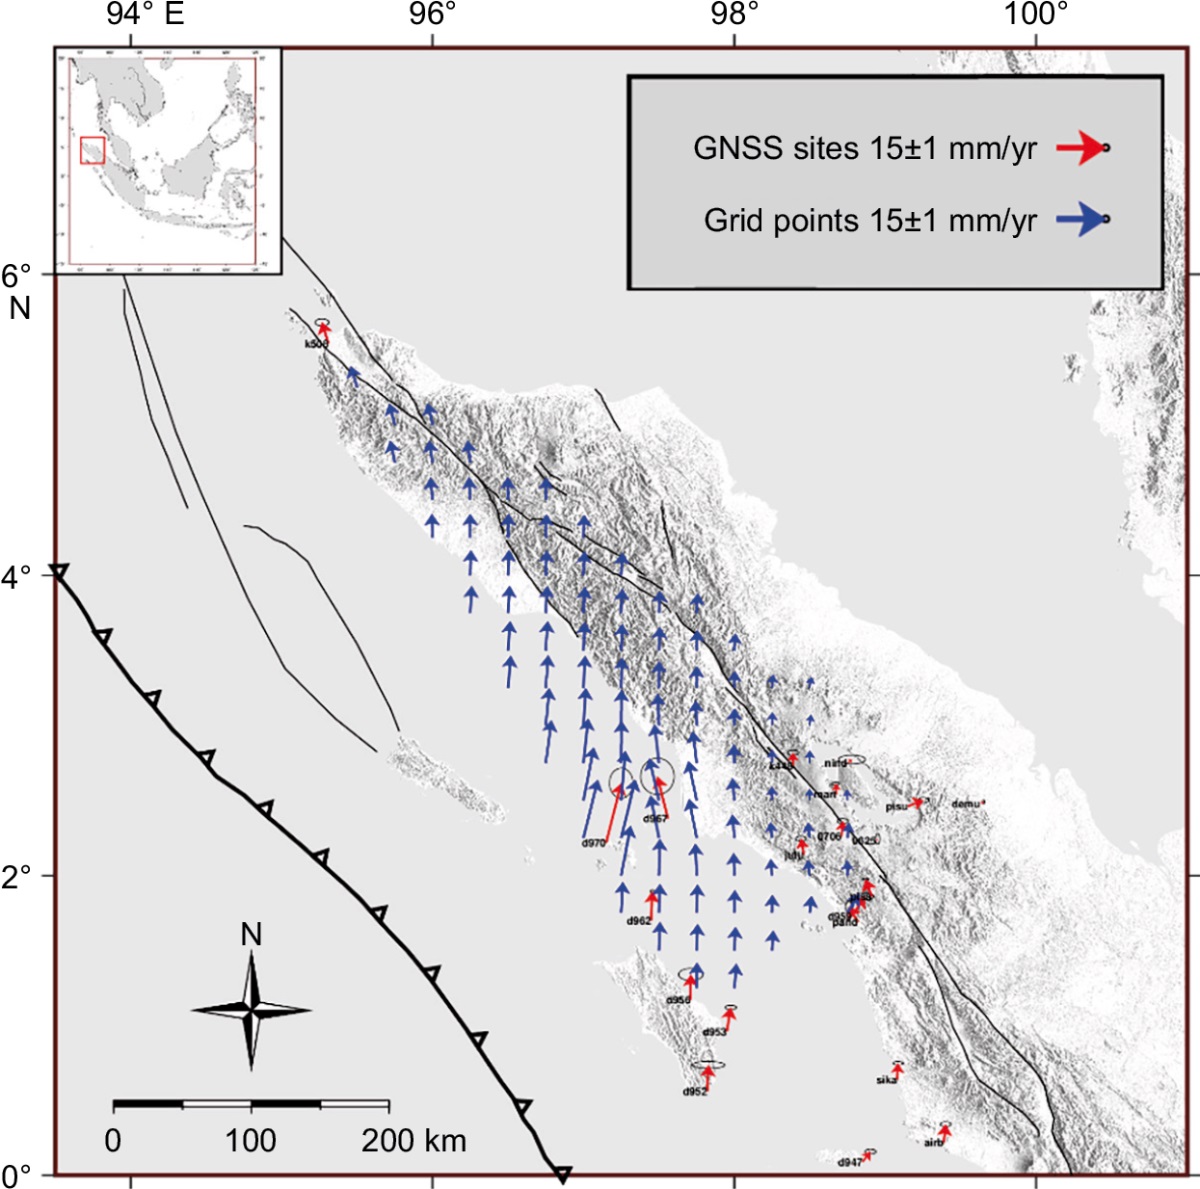 Fig. 5. Velocities in the northern Sumatra before 2004 according to the Sundaland plate reference frame.
Рис. 5. Данные скоростей в северной части о. Суматра до 2004 г. в системе отсчета движения плиты Сандаленд.
The strains calculated from the velocities show a different shortening-extension pattern for the recent velocities and the velocities prior to 2004. These strains are calculated from the interpolated grid points. The statistics of the velocities on the grid points shows that the recent velocities are lower than the velocities prior to 2004 (Table 3). Therefore, the recent strain is lower than the strain prior to 2004. However, the strain field pattern for these two periods is different. In general, the dominant pattern is shortening due to convergence of the Indo-Australian Plate and the Sundaland plate [Alif, Pratama, 2019]. High strain rates prior to 2004 are concentrated on the southern area between small islands and the Sumatra Island (Fig. 6). Meanwhile, the amount of shortening in that area is lower for the recent strain (up to 47.2 μstrain/yr as compared to up to 33.8 μstrain/yr). Furthermore, the recent strain rates are associated with the extension in the northern Sumatara Island (Fig. 7). This is possibly caused by the postseismic deformation therein.
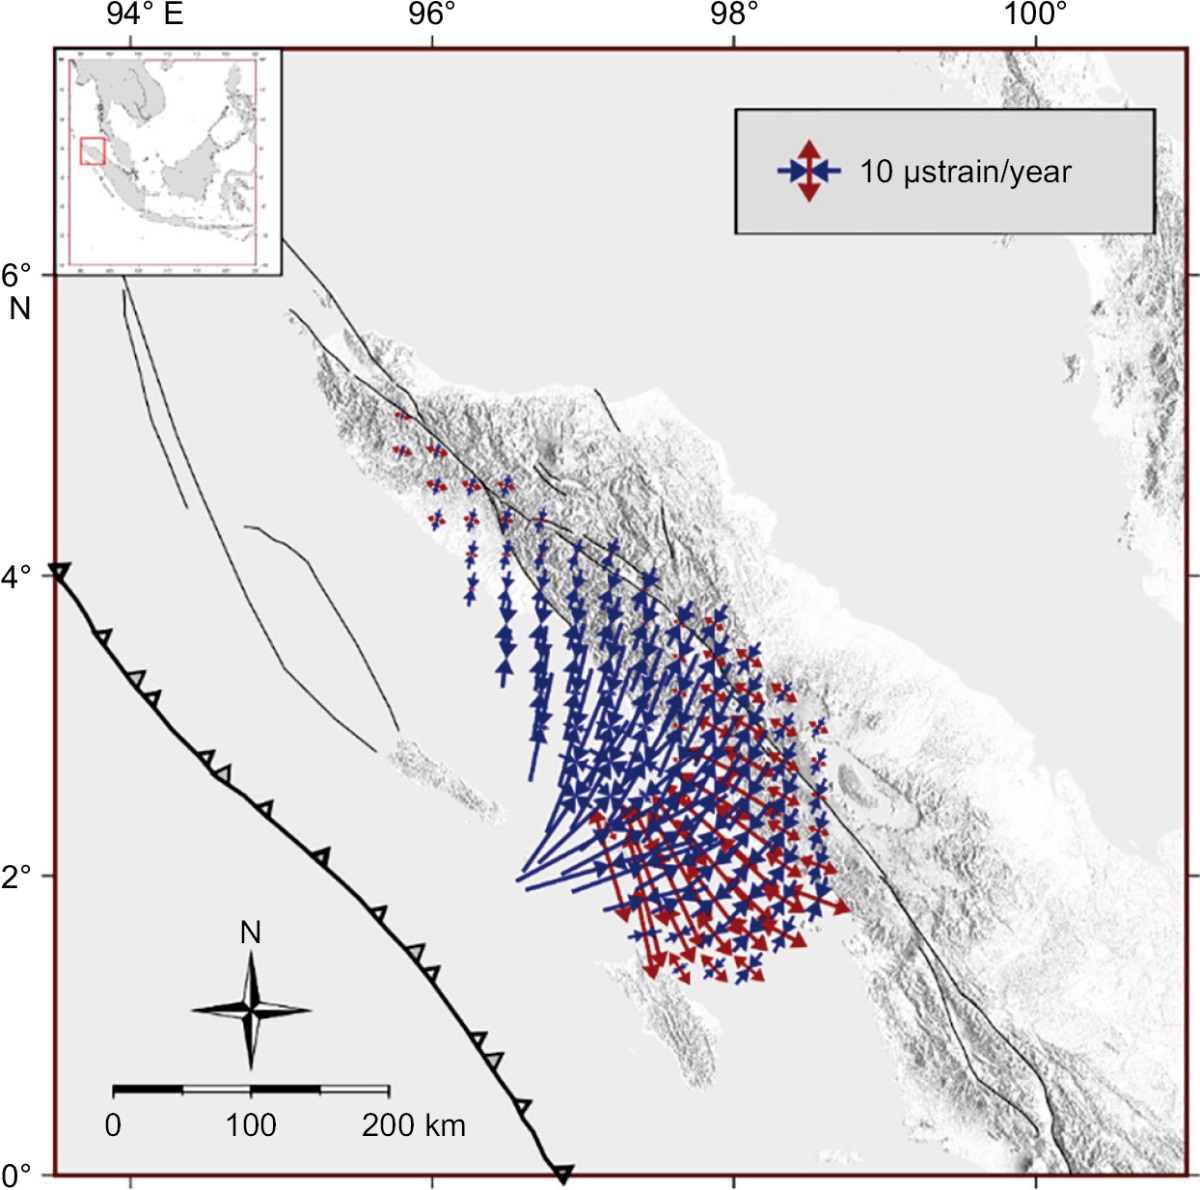
Fig. 6. Strain rate before 2004 calculated from velocities on grid points.
Рис. 6. Данные скоростей деформаций до 2004 г., рассчитанных на основе значений скоростей узлов сетки.
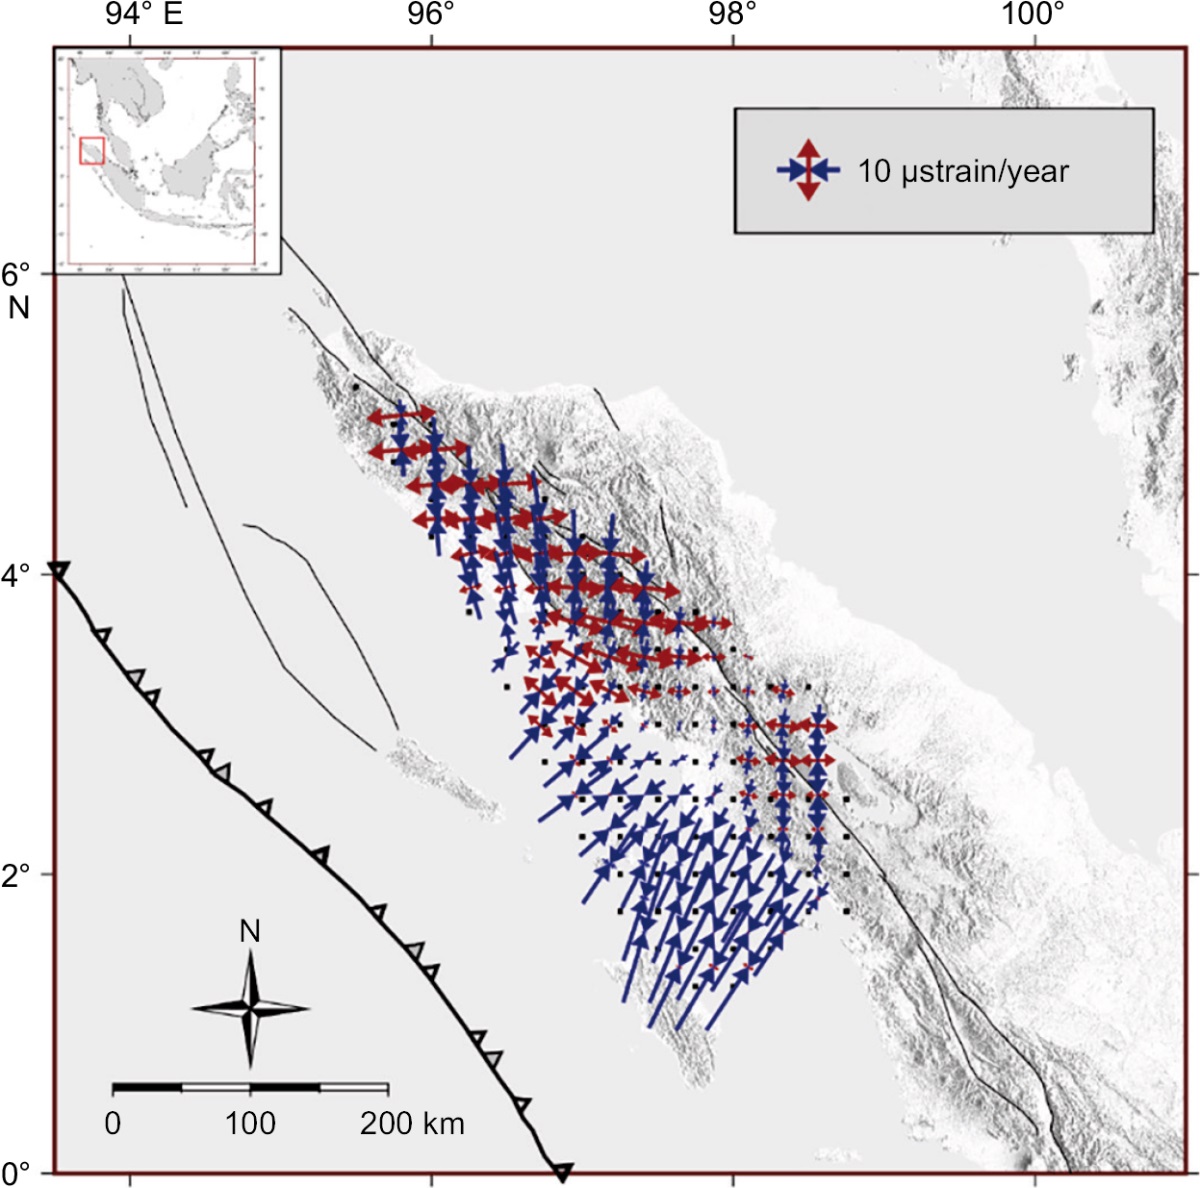
Fig. 7. Strain rate calculated from velocities on grid points.
Рис. 7. Данные скоростей деформаций, рассчитанных на основе значений скоростей узлов сетки.
Table 3. The statistics of grid point velocities and strains
Таблица 3. Статистические значения скоростей и деформаций узлов сетки
|
Statistics |
Velocity (mm/yr) |
Strain rate (μ strain/yr) |
||
|
Before 2004 |
Recent |
Before 2004 |
Recent |
|
|
Maximum |
66.5 |
33.4 |
47.2 |
33.8 |
|
Minimum |
11.7 |
1.7 |
0.09 |
0.0006 |
|
Standard Deviation |
11.6 |
6.4 |
10.2 |
7.8 |
The postseismic deformation in the northern Sumatra is associated with velocities and strain field. The first, direct analysis approach for the velocity vectors shows that the vector in the northern area has been recently directed towards the west and was directed towards the north prior to 2004. The second, strain comparison approach shows the extension in the northern area while the dominant shortening direction indicates no postseismic deformation. The third approach which consists in subtracting velocities between these two periods shows the trenchward orientation of the vector (Fig. 8). This trenchward motion at a rate of up to 26.3 mm/yr indicates postseismic deformation [Wang et al., 2012].
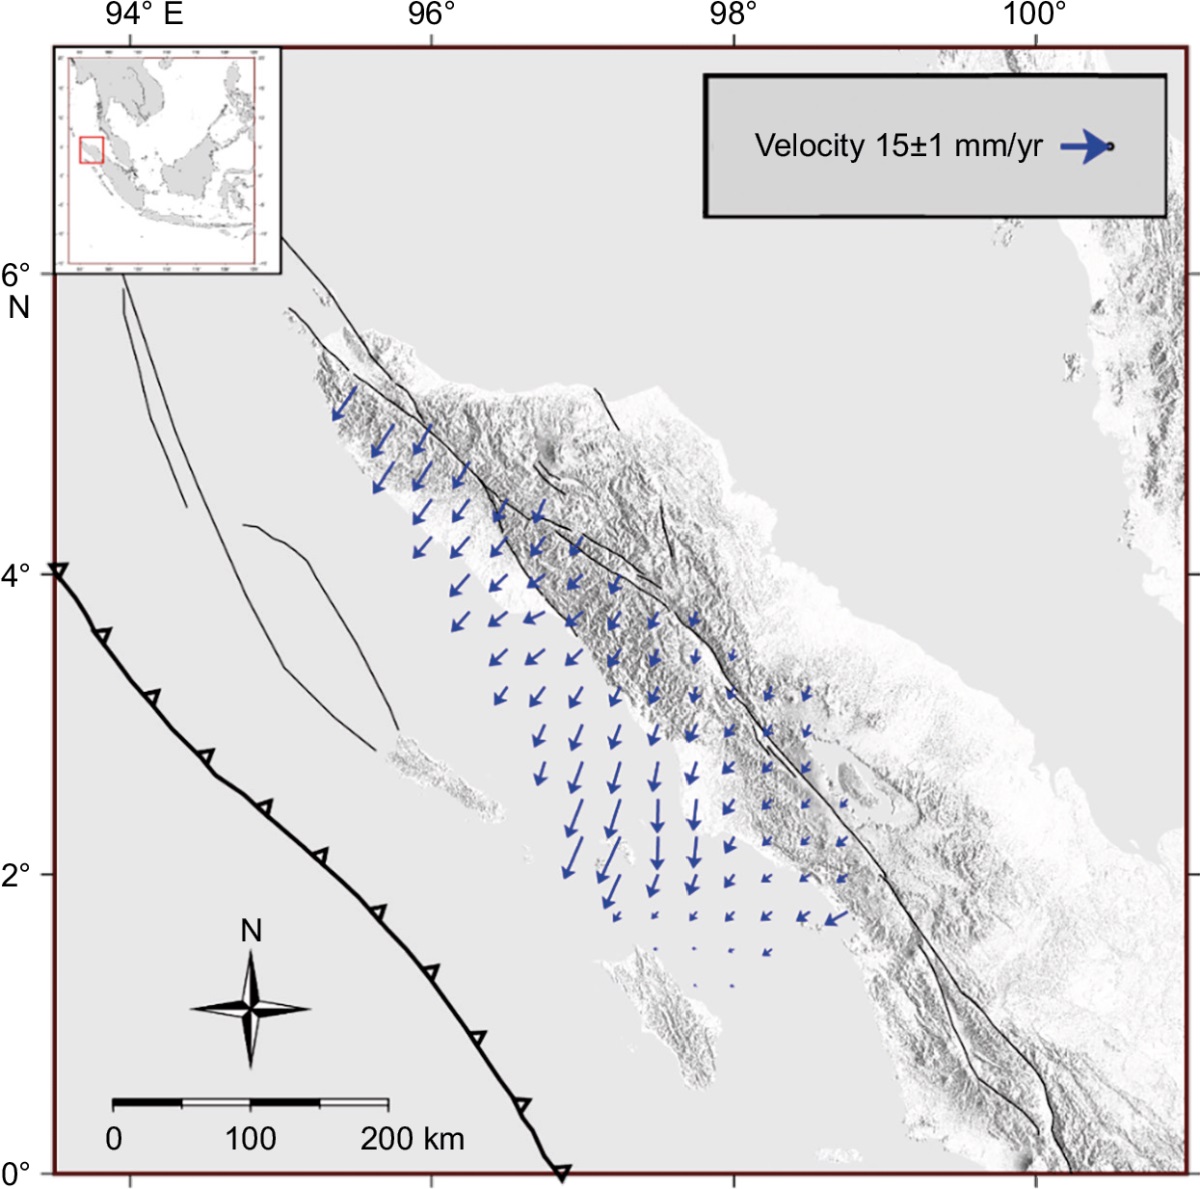
Fig. 8. Velocities difference on grid points between two periods.
Рис. 8. Разница скоростей узлов сетки, рассчитанных для двух периодов.
The occurrence of postseismic deformation should be taken into consideration while studying other crustal deformations in this area, especially with assessment of earthquake potential utilizing only interseismic deformation. Modeling new postseismic deformation or applying the existing postseismic model is a possible solution for this issue. The existing postseismic model implies a long-term constant dominance of viscoelastic relaxation [Gunawan et al., 2014]. The recent velocities and strain rates, which are calculated from the data for a period of more than 10 years after the earthquake, can help in evaluating the validity of the existing model, especially in that of the viscoelastic relaxation model. Viscosity of the asthenosphere that causes the viscoelastic relaxation has been studied many times due to the 2004 M9.2 Sumatra-Andaman earthquake. The viscosities of 3·1017 [Paul et al., 2012], 2.5·1018 [Lubis et al., 2013], 5·1018 [Han et al., 2008], 8·1018 [Panet et al., 2010], and 1·1019 Pa·s [Hu, Wang, 2012] could be validated with the herein-obtained recent velocities and strain rates for further research.
The postseismic deformation of the 2004 M9.2 Sumatra-Andaman earthquake still occurs in the northern Sumatra 15 years thereafter, as shown by the study on the GNSS-based velocities and strain field determinations. The trenchward velocity vector direction and the extensional strain field were the herein-determined indicators of the postseismic deformation. The difference between GNSS velocities from 2017 to 2021 and the velocities prior to 2004 shows different deformation pattern and behavior of the crust in the northern Sumatra. These postseismic deformations should be considered when studying earthquake potential in this area. These results can help in evaluating the validity of the existing postseismic model, or even in generating a new postseismic model.
Figures were drawn using the Generic Mapping Tools (GMT) software [Wessel et al., 2013]. Thanks are given to the Geospatial Information Agency of Indonesia (BIG) for providing us with continuous GPS data.
All authors made an equivalent contribution to this article, read and approved the final manuscript.
The authors declare that they have no conflicts of interest relevant to this manuscript.
1. Alif S.M., Fattah E.I., Kholil M., Anggara O., 2021. Source of the 2019 Mw6.9 Banten Intraslab Earthquake Modelled with GPS Data Inversion. Geodesy and Geodynamics 12 (4), 308–314. https://doi.org/10.1016/j.geog.2021.06.001.
2. Alif S.M., Meilano I., Gunawan E., Efendi J., 2016. Evidence of Postseismic Deformation Signal of the 2007 M8.5 Bengkulu Earthquake and the 2012 M8.6 Indian Ocean Earthquake in Southern Sumatra, Indonesia, Based on GPS Data. Journal of Applied Geodesy 10 (2), 103–108. https://doi.org/10.1515/jag-2015-0019.
3. Alif S.M., Pratama A., 2019. Analysis of Southern Segment of Sumatran Fault Monitoring Bench Mark as Preliminary Approach in Updating Earthquake Hazard Map. Journal of Science and Applicative Technology 2 (1), 183–191. https://doi.org/10.35472/281470.
4. Alif S.M., Siagian J.M., Anggara O., 2023. Present-Day Crustal Deformation in West Sumatra After Series of Sumatran Great Earthquake from 2004–2010. Journal of Earth and Marine Technology 3 (2), 59–68. DOI:10.31284/j.jemt.2023.v3i2.3733.
5. Altamimi Z., Rebischung P., Métivier L., Collilieux X., 2016. ITRF2014: A New Release of the International Terrestrial Reference Frame Modeling Nonlinear Station Motions. Journal of Geophysical Research: Solid Earth 121 (8), 6109–6131. https://doi.org/10.1002/2016JB013098.
6. Anggara O., Welly T.K., Fauzi A.I., Alif S.M., Perdana R.S., Oktarina S.W., Nuha M.U., Rosadi U., 2023. Monitoring Ground Deformation of Sinabung Volcano Eruption 2018–2019 Using DInSAR Technique and GPS Data. AIP Conference Proceedings 2654 (1), 050012. https://doi.org/10.1063/5.0114428.
7. Anugrah B., Meilano I., Gunawan E., Efendi J., 2015. Estimation of Postseismic Deformation Parameters from Continuous GPS Data in Northern Sumatra After the 2004 Sumatra-Andaman Earthquake. Earthquake Science 28, 347–352. https://doi.org/10.1007/s11589-015-0136-x.
8. Chlieh M., Avouac J.P., Hjorleifsdottir V., Song T.R.A., Ji C., Sieh K., Sladen A., Hebert H., Prawirodirdjo L., Bock Y., Galetzka J., 2007. Coseismic Slip and Afterslip of the Great Mw 9.15 Sumatra-Andaman Earthquake of 2004. Bulletin of the Seismological Society of America 97 (1A), S152–S173. https://doi.org/10.1785/0120050631.
9. Dach R., Lutz S., Walser P., Fridez P. (Eds), 2015. Bernese GNSS Software. Version 5.2. University of Bern, 862 p. https://doi.org/10.7892/boris.72297.
10. DeMets C., Gordon R.G., Argus D.F., 2010. Geologically Current Plate Motions. Geophysical Journal International 181 (1), 1–80. https://doi.org/10.1111/j.1365-246X.2009.04491.x.
11. Feng L., Hill E.M., Banerjee P., Hermawan I., Tsang L.L., Natawidjaja D.H., Suwargadi B.W., Sieh K., 2015. A Unified GPS-Based Earthquake Catalog for the Sumatran Plate Boundary Between 2002 and 2013. Journal of Geophysical Research: Solid Earth 120 (5), 3566–3598. https://doi.org/10.1002/2014JB011661.
12. Fujii Y., Satake K., Watada S., Ho T.C., 2021. Re-Examination of Slip Distribution of the 2004 Sumatra-Andaman Earthquake (Mw 9.2) by the Inversion of Tsunami Data Using Green’s Functions Corrected for Compressible Seawater over the Elastic Earth. Pure and Applied Geophysics 178, 4777–4796. https://doi.org/10.1007/s00024-021-02909-6.
13. Gunawan E., Sagiya T., Ito T., Kimata F., Tabei T., Ohta Y., Meilano I., Abidin H.Z., Nurdin I., Sugiyanto D., 2014. A Comprehensive Model of Postseismic Deformation of the 2004 Sumatra-Andaman Earthquake Deduced from GPS Observations in Northern Sumatra. Journal of Asian Earth Sciences 88, 218–229. https://doi.org/10.1016/j.jseaes.2014.03.016.
14. Han S.C., Sauber J., Luthcke S.B., Ji C., Pollitz F.F., 2008. Implications of Postseismic Gravity Change Following the Great 2004 Sumatra‐Andaman Earthquake from the Regional Harmonic Analysis of GRACE Intersatellite Tracking Data. Journal of Geophysical Research: Solid Earth 113 (B11), B11413. https://doi.org/10.1029/2008JB005705.
15. Hanifa N.R., Sagiya T., Kimata F., Efendi J., Abidin H.Z., Meilano I., 2014. Interplate Coupling Model Off the Southwestern Coast of Java, Indonesia, Based on Continuous GPS Data in 2008–2010. Earth and Planetary Science Letters 401, 159–171. https://doi.org/10.1016/j.epsl.2014.06.010.
16. Hu Y., Wang K., 2012. Spherical-Earth Finite Element Model of Short-Term Postseismic Deformation Following the 2004 Sumatra Earthquake. Journal of Geophysical Research: Solid Earth 117 (B5), B05404. https://doi.org/10.1029/2012JB009153.
17. Ito T., Gunawan E., Kimata F., Tabei T., Simons M., Meilano I., Ohta Y., Nurdin I., Sugiyanto D., 2012. Isolating Along-Strike Variations in the Depth Extent of Shallow Creep and Fault Locking on the Northern Great Sumatran Fault. Journal of Geophysical Research: Solid Earth 117 (B6), B06409. https://doi.org/10.1029/2011JB008940.
18. Johnston G., Riddell A., Hausler G., 2017. The International GNSS Service. In: P.J.G. Teunissen, O. Montenbruck (Eds), Springer Handbook of Global Navigation Satellite Systems. Springer, Cham, p. 967–982. https://doi.org/10.1007/978-3-319-42928-1_33.
19. Lubis A.M., 2021. Pemanfaatan Survey GPS Geodetik Untuk Pengamatan Deformasi Inter-Seismik Setelah Satu Dekade Kejadian Gempa Bumi Bengkulu 2007 (Mw 8.4) di Daerah Bengkulu Bagian Utara. Jurnal Geosains dan Teknologi 4 (1), 1–10. DOI:10.14710/jgt.4.1.2021.1-10.
20. Lubis A.M., Hashima A., Sato T., 2013. Analysis of Afterslip Distribution Following the 2007 September 12 Southern Sumatra Earthquake Using Poroelastic and Viscoelastic Media. Geophysical Journal International 192 (1), 18–37. https://doi.org/10.1093/gji/ggs020.
21. Maulida P., Meilano I., Gunawan E., Efendi J., 2016. Analysis of 2012 M8.6 Indian Ocean Earthquake Coseismic Slip Model Based on GPS Data. AIP Conference Proceedings 1730 (1), 040006. https://doi.org/10.1063/1.4947396.
22. McCaffrey R., 2009. The Tectonic Framework of the Sumatran Subduction Zone. Annual Review of Earth and Planetary Sciences 37, 345–366. https://doi.org/10.1146/annurev.earth.031208.100212.
23. McLoughlin I.V., Wong K.J., Tan S.L., 2011. Data Collection, Communications and Processing in the Sumatran GPS Array (SuGAr). Proceedings of the World Congress on Engineering (July 6–8, 2011). Vol. 2. London, p. 1732–1736.
24. Mendoza L.P.O., Richter A., Marderwald E.R., Hormaechea J.L., Connon G., Scheinert M., Dietrich R., Perdomo R.A., 2022. Horizontal and Vertical Deformation Rates Linked to the Magallanes‐Fagnano Fault, Tierra del Fuego: Reconciling Geological and Geodetic Observations by Modeling the Current Seismic Cycle. Tectonics 41 (1), e2021TC006801. https://doi.org/10.1029/2021TC006801.
25. Morgan P.M., Feng L., Meltzner A.J., Lindsey E.O., Tsang L.L., Hill E.M., 2017. Sibling Earthquakes Generated Within a Persistent Rupture Barrier on the Sunda Megathrust Under Simeulue Island. Geophysical Research Letters 44 (5), 2159–2166. https://doi.org/10.1002/2016GL071901.
26. Natadikara R., Fauzi A.I., Anggara O., Perdana R.S., Alif S.M., Julzarika A., Nurtyawan R., Rohman A., 2023. Monitoring Deformation of Anak Krakatoa Volcano Using Differential Interferometry Synthetic Aperture Radar (DInSAR) Method. AIP Conference Proceedings 2941 (1), 030018. https://doi.org/10.1063/5.0181540.
27. Natawidjaja D.H., 2018. Updating Active Fault Maps and Sliprates Along the Sumatran Fault Zone, Indonesia. IOP Conference Series: Earth and Environmental Science 118, 012001. https://doi.org/10.1088/1755-1315/118/1/012001.
28. Panet I., Pollitz F., Mikhailov V., Diament M., Banerjee P., Grijalva K., 2010. Upper Mantle Rheology from GRACE and GPS Postseismic Deformation After the 2004 Sumatra-Andaman Earthquake. Geochemistry, Geophysics, Geosystems 11 (6), Q06008. https://doi.org/10.1029/2009GC002905.
29. Paul J., Rajendran C.P., Lowry A.R., Andrade V., Rajendran K., 2012. Andaman Postseismic Deformation Observations: Still Slipping After All These Years? Bulletin of the Seismological Society of America 102 (1), 343–351. https://doi.org/10.1785/0120110074.
30. Prawirodirdjo L., McCaffrey R., Chadwell C.D., Bock Y., Subarya C., 2010. Geodetic Observations of an Earthquake Cycle at the Sumatra Subduction Zone: Role of Interseismic Strain Segmentation. Journal of Geophysical Research: Solid Earth 115 (B3), B03414. https://doi.org/10.1029/2008JB006139.
31. Simoes M., Avouac J.P., Cattin R., Henry P., 2004. The Sumatra Subduction Zone: A Case for a Locked Fault Zone Extending Into the Mantle. Journal of Geophysical Research: Solid Earth 109 (B10), B10402. https://doi.org/10.1029/2003JB002958.
32. Simons W.J.F., Socquet A., Vigny C., Ambrosius B.A.C., Haji Abu S., Promthong C., Subarya C., Sarsito D.A., Matheussen S., Morgan P., Spakman W., 2007. A Decade of GPS in Southeast Asia: Resolving Sundaland Motion and Boundaries. Journal of Geophysical Research: Solid Earth 112 (B6), B06420. https://doi.org/10.1029/2005JB003868.
33. Stein S., Wysession M., 2009. An Introduction to Seismology, Earthquakes, and Earth Structure. Wiley-Blackwell, 511 p.
34. Wang L., Shum C.K., Simons F.J., Tapley B., Dai C., 2012. Coseismic and Postseismic Deformation of the 2011 Tohoku-Oki Earthquake Constrained by GRACE Gravimetry. Geophysical Research Letters 39 (7), L07301. https://doi.org/10.1029/2012GL051104.
35. Wessel P., Smith W.H., Scharroo R., Luis J., Wobbe F., 2013. Generic Mapping Tools: Improved Version Released. Eos, Transactions American Geophysical Union 94 (45), 409–410. https://doi.org/10.1002/2013EO450001.
Tainan 701, South Lampung 35365, Indonesia
South Lampung 35365
South Lampung 35365
South Lampung 35365
Alif S.M., Anggara O., Jihad M.F., Perdana R.S. GNSS VELOCITY AND STRAIN FIELD IN THE NORTHERN SUMATRA 15 YEARS AFTER THE 2004 M9.2 SUMATRA ANDAMAN EARTHQUAKE. Geodynamics & Tectonophysics. 2024;15(6):0798. https://doi.org/10.5800/GT-2024-15-6-0798. EDN: MPINZE


Editor-in-Chief
Sklyarov E.V.664033, Irkutsk, Lermontova St., 128,
IEC SB RAS Institute of the Earth's crust
E-mail.: gt@crust.irk.ru
tel.: 8 3952 425422
Processing of personal data


