


Contents
Scroll to:
https://doi.org/10.5800/GT-2024-15-4-0771
EDN: IBNQWM
Scroll to:
Crustal thickness beneath Mongolia was determined using the teleseismic receiver function H-k stacking method, which employed waveform data from broadband seismic stations in Mongolia. The findings reveal that the crust of Mongolia thickens from east to west, with the thickness reaching 63 km in west Mongolia and 35.9 km in east Mongolia. In the central part of Mongolia, the average thickness of the crust is approximately 45 km. The characteristics of P-to-S converted phases and negative amplitudes in stacked receiver functions, may be attributed to regional tectonostratigraphic terranes in Mongolia. Subsequently, a general map of the crustal thickness of Mongolia was generated by combining the results of this study with those of other seismological studies and the CRUST1.0 model of the Earth’s crust.
Tsagaan B., Chimed O., Tsermaa B., Khukhuudei Y. THE CRUSTAL THICKNESS AND Vp/Vs RATIO IN MONGOLIA. Geodynamics & Tectonophysics. 2024;15(4):0771. https://doi.org/10.5800/GT-2024-15-4-0771. EDN: IBNQWM
Seismic waves are the mechanical waves that has capable of propagating through the Earth and its interior, and they are commonly used to study the elastic properties of the crust. The characteristics and frequency contents of seismic waves emitted by earthquakes depend greatly on the Earth’s interior, especially the structure and composition of the crust. In seismological studies, such as determining the main parameters, calculating synthetic seismograms, carrying out seismic hazard analysis, and studying the seismo-tectonics of the region, the internal structure of the crust, namely the seismic velocity model, is used.
One of the important parameters of seismic velocity reference models such as PREM, IASP91, AK135, and CRUST1.0 used in seismological research is the crustal thickness and its Vp/Vs velocity ratio. The crustal thickness and seismic velocity of these seismic velocity models are slightly different than each other and they are not suitable for the seismological study of Mongolia.
Currently, two seismic velocity models with a layer over a half-space are employed to process earthquake data in Mongolia. The crustal thickness values in these models are 45 km and 35 km for western and central Mongolia, and for eastern Mongolia, respectively. With the increase in the number and the detection capabilities of permanent seismic stations operating in Mongolia, it is unreasonable to continue using such an isotropic seismic velocity model in the seismological study of the region.
In the past, several research works have been conducted to investigate the characteristics of the Mongolian crust, including its thickness and shear wave velocity structure. The thickness of the crust and its seismic velocity characteristics beneath the temporary seismic network installed in a certain part of the Mongolian territory were studied in the frame of seismological projects such as "The Baikal Rift Zone Experiment, 1991–1992" [Davis et al., 2001; Mordvinova et al., 1996], "Mongolian Baikal Lithosphere Seismological Transect – 2003" [Mordvinova et al., 2007], "The Geophysical Investigation and Deep Structure Modeling for Seismic Hazard Assessment in the Far East, 2011–2012" [He et al., 2016], and "Collaborative Research: Intracontinental Deformation and Surface Uplift – Geodynamic Evolution of the Hangay Dome, Mongolia Central Asia, 2012–2016" [Stachnik et al., 2014]. Additionally, the thickness of the crust and its S shear wave velocity structure beneath the Ulaanbaatar region were studied by teleseismic receiver function and genetic algorithm inversion [Baasanbat, Shibutani, 2015].
In this study, our objective was to determine the crust’s thickness and its seismic Vp/Vs ratio and Poisson’s ratio beneath broadband permanent seismic stations in Mongolia using the teleseismic receiver function H-k stacking method. Additionally, we aimed to make a general map illustrating the crustal thickness beneath Mongolia by integrating the results of this study with those of previous seismological studies conducted in Mongolia, as well as the CRUST1.0 reference model.
The Institute of Astronomy and Geophysics (IAG) of the Mongolian Academy of Sciences (MAS) operates and maintains a seismic network in Mongolia. For this study, we utilized seismic waveforms recorded by both permanent and temporary broadband seismic stations of the Mongolian seismic network (Fig. 1). We selected the waveforms of teleseismic events with a high signal-to-noise ratio from the database between 2012 and 2023. The selected events had magnitudes of mb≥5.5 and epicentral distances ranging from 30° to 90° (Fig. 2). It is important to mention that the number of selected events varied depending on the time frame of each seismic station’s operation. Overall, the distribution of selected teleseismic events provided adequate azimuthal coverage for most permanent seismic stations. The teleseismic receiver function analysis is one of the main methods for studying the thickness of the crust and its seismic velocity structure [Ammon et al., 1990; Langston, 1977; Ligorría, Ammon, 1999].
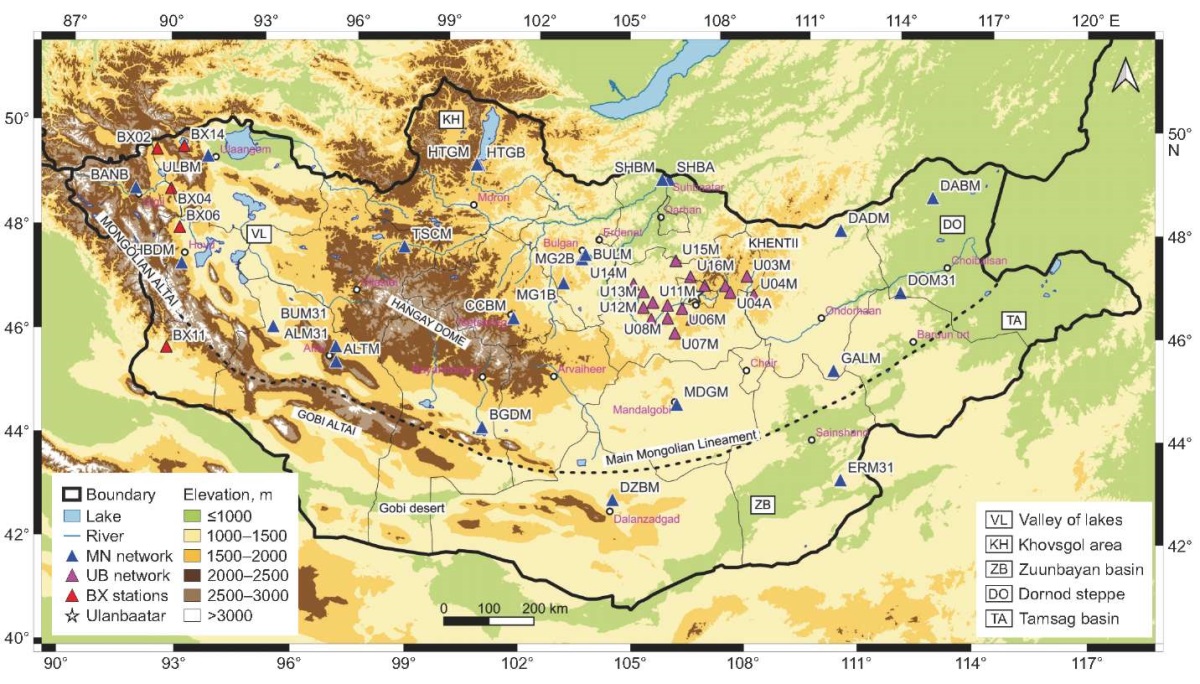
Fig. 1. The distribution of temporary and permanent broadband stations of the Mongolian Seismic Network.
Рис. 1. Распределение временных и постоянных широкополосных станций Монгольской сейсмической сети.
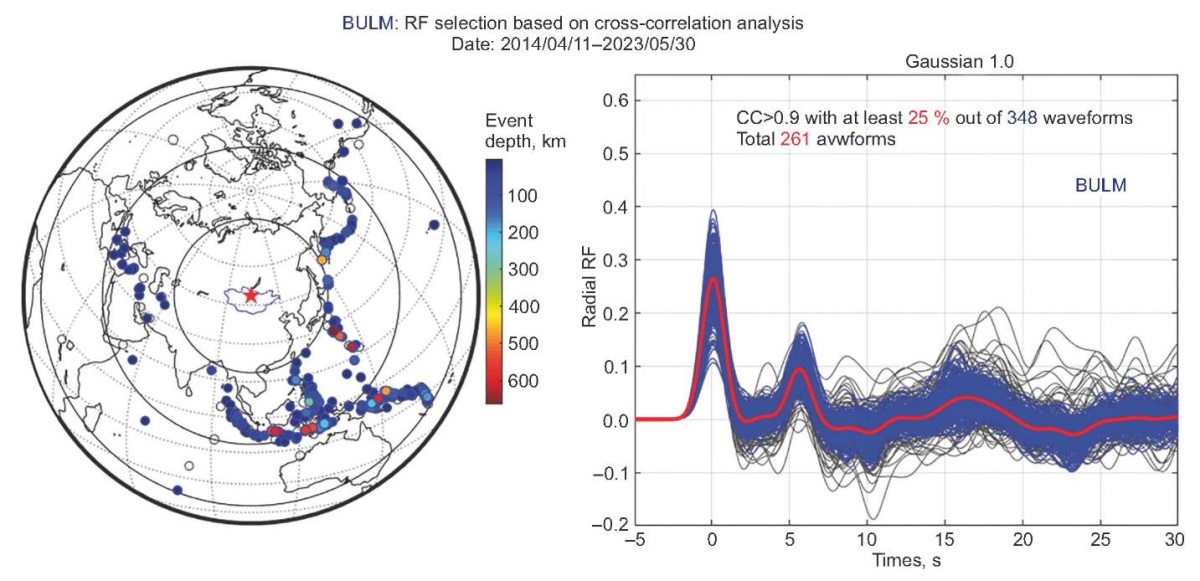
Fig. 2. BULM station: the distribution of selected events for the analysis along their observed receiver functions.
Observed receiver functions are depicted as gray curves, those selected by correlation analysis are represented by blue curves, and the stacked receiver function is illustrated by a red curve.
Рис. 2. Станция BULM: распределение выбранных событий для анализа по их наблюдаемым функциям приемника.
Наблюдаемые функции приемника изображены серыми кривыми, выбранные с помощью корреляционного анализа – синими кривыми, а составная функция приемника – красной кривой.
A receiver function is highly sensitive to velocity contrasts beneath a seismic station, making it an invaluable tool in research aimed at determining the deep structure of the Earth, particularly the thickness of the crust. It is assumed that the teleseismic P wave results from a convolution of the earthquake source time function, the instrument response, and the effect of the path through the mantle and the crust beneath the receiver [Ammon et al., 1990]. Over time, several deconvolution methods have been developed to isolate the near-receiver function [Ammon et al., 1990; Clayton, Wiggins, 1976]. In this study, we employed the time-domain deconvolution method [Ligorría, Ammon, 1999].
We prepared seismic signals with a length of 200 seconds, beginning 50 seconds before the first P arrival and extending 150 seconds after the P phase to ensure that the waveform contains the requisite converted phases at the Moho discontinuity. We removed the trend and mean from the waveforms, and applied both a bandpass filter and a Gaussian filter with a width factor of 1.0, 1.5, and 2.5 to the selected waveforms. Finally, we selected mutually coherent radial receiver functions using the cross-correlation technique [Tkalčić et al., 2011].
The teleseismic receiver function H-k stacking method [Zhu, Kanamori, 2000] is employed to determine the average crustal thickness (H) and Vp/Vs ratio (k) for selected stations. This method involves summing the amplitudes of individual receiver functions at the predicted arrival times of Ps, PpPs, and PpSs+PsPs phases for various crustal thickness (H) and Vp/Vs velocity ratios (k=Vp/Vs). Subsequently, the average crustal thickness is estimated by stacking the individual receiver functions in the H-k domain [Porritt, Miller, 2018] (Fig. 3). The arrival times of multiple converted phases can be expressed as follows:
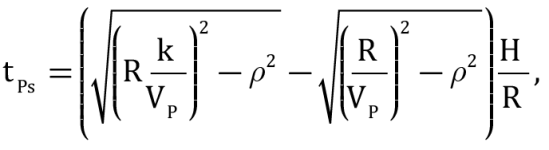 (1)
(1)
 (2)
(2)
 (3)
(3)
where R is given Earth’s radius, ρ is the ray parameter, H is the crustal thickness, and Vp is the assumed P wave velocity, k is the Vp/Vs velocity ratio. The standard deviation of crustal thickness and Vp/Vs ratio is calculated by the statistical bootstrap method [Efron, Tibshirani, 1986]. This bootstrap method involves generating multiple bootstrap samples from the original dataset by resampling with replacement.
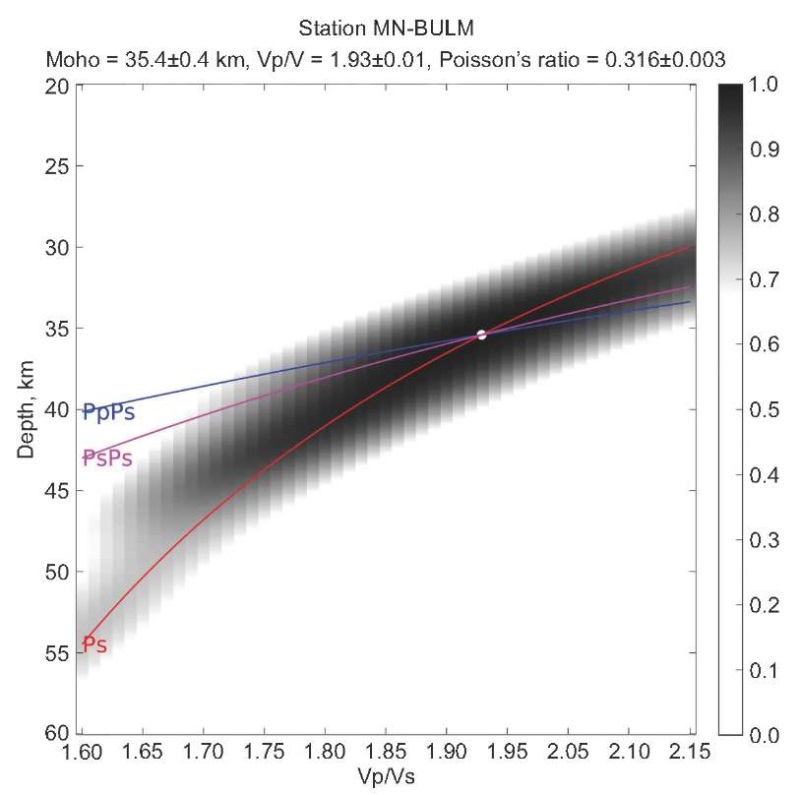
Fig. 3. Example of H-k stacking inversion.
Рис. 3. Пример инверсии H-k суммирования.
We determined the average crustal thickness beneath 45 permanent broadband seismic stations using the receiver function H-k stacking method. Our study findings indicate a trend wherein the crustal thickness in the study area progressively increases from east to west (Fig. 4). This observation suggests lateral variations in crustal thickness across the study area, with thicker crust observed towards the western extent of the study area. The average thickness of the crust is approximately 45 km, with variations ranging from 35.9 km to 63.1 km. The minimum crustal thickness is observed beneath the DABM station in the east, while the maximum thickness is observed beneath the HBDM station in the west of Mongolia (Fig. 4). Notably, regions such as the Mongol Altai, Gobi-Altai, and Hangay dome mountainous area exhibit a relatively thicker crust, with an average value of 51.5 km. It is worth mentioning that stations indexed as BX exhibit larger uncertainty due to the shorter operational period. The average thickness of the crust beneath central Mongolia is approximately 42.7 km. Interestingly, we noted a relatively shallow crust beneath BULM and MG2B stations in north-central Mongolia. The crustal thickness beneath the Ulaanbaatar region ranges from 41.9 to 44.2 km, a result that closely aligns with the findings of Yu.A. Zorin et al [Zorin et al., 2002].
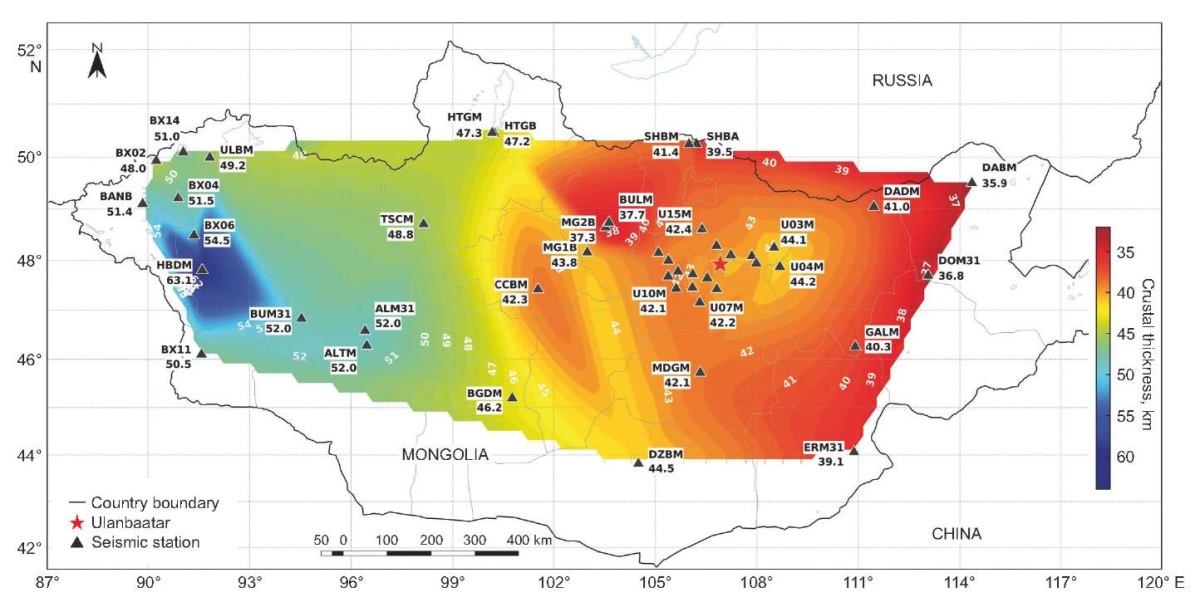
Fig. 4. A contour map depicting the crustal thicknesses beneath the stations used in this study.
Рис. 4. Карта, показывающая толщину земной коры под станциями, использованными в этом исследовании.
The estimated bulk crustal Vp/Vs ratios beneath the permanent broadband stations vary between 1.68 and 1.92, with an average of 1.75 (Fig. 5). Notably, lower Vp/Vs ratios are observed beneath the UB stations located in the west of the Hentei Mountain range, attributed to the presence of Devonian Carboniferous turbidite basin terrane. Conversely, higher Vp/Vs ratios of around 1.8 are identified beneath HTGB and HTGM stations in northern Mongolia, associated with Cambrian shelf carbonate rocks terrane. Furthermore, relatively higher Vp/Vs (1.88 and 1.92) ratios are determined beneath MG2B and BULM stations, indicative of Permian Triassic volcanic plutonic belt terrane. Poisson’s ratio is directly related to Vp/Vs ratio. The determined bulk crustal Poisson’s ratios beneath the stations range between 0.23 and 0.31 with an average of 0.25 (Fig. 6).
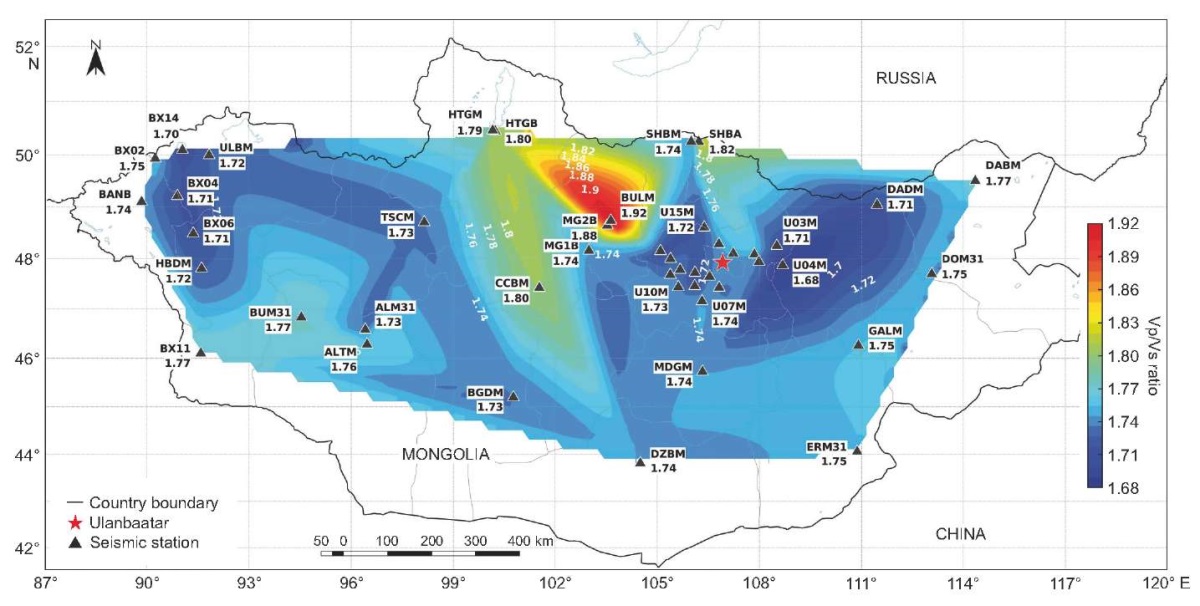
Fig. 5. A contour map of Vp/Vs ratio in the crust beneath the stations used in this study.
Рис. 5. Карта отношения Vp/Vs в земной коре под станциями, использованными в данном исследовании.
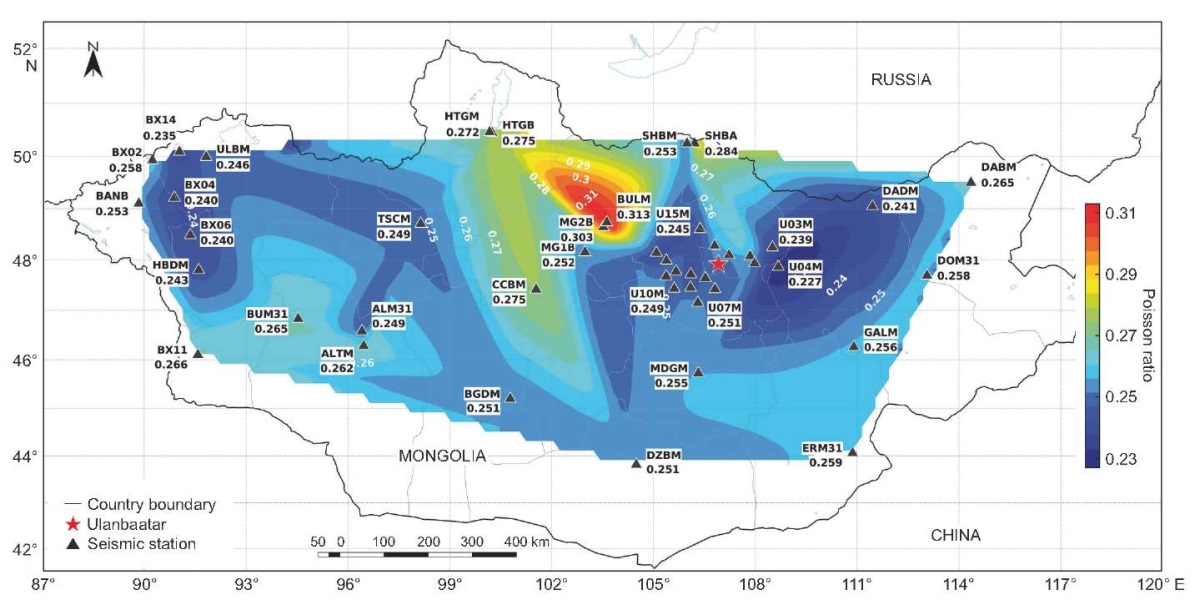
Fig. 6. A contour map of Poisson’s ratio in the crust beneath the stations used in this study.
Рис. 6. Карта коэффициента Пуассона в земной коре под станциями, использованными в этом исследовании.
The main results of the previous studies were crustal thicknesses beneath the temporary seismic stations installed within the framework of these projects. V.V. Mordvinova et al. [Mordvinova et al., 1996] determined the crustal thickness beneath the Irkutsk – Ulaanbaatar – Undurshil profile using the spectral ratio of vertical and horizontal seismograms from short period instruments with the natural frequency of 1Hz. According to their study, the thickness of the crust beneath the stations numbered 80–90, located in Mongolia ranges between 41.8–43.7 km. Yu.A. Zorin et al. [Zorin et al., 2002] also determined the thickness of the crust beneath the profile using the teleseismic receiver function analysis. According to the result of this study, the crustal thickness beneath the stations varies between 42–50 km. They suggest thick low-velocity zones in the upper crust beneath the central and southeastern part of the profile at depths of 10–20 km and 5–15 km, respectively. J.C. Stachnik et al. [Stachnik et al., 2014] and J. He et al. [He et al., 2016] both used the teleseismic receiver function H-k stacking method to determine the thickness of the crust, as well as Vp/Vs ratio, beneath the temporary array stations installed in certain parts of Mongolia. In the central northern side of Mongolian border, crustal thickness around 49 km under the Khamar-Daban Range and thinning to 38 km under Baikal Lake. In Ulaanbaatar, it is 43–44 km [Mordvinova et al., 1996, 2019]. Using deep seismic sounding in the Baikal Rift Zone and its adjacent areas, the Moho depth varies from 35 to 50 km. The 35–37 km depth zones extend southwest from Chita city, connecting to the northeastern border of Mongolia [Suvorov et al., 2002].
To make a general map of the crustal thickness of Mongolia, we integrated the findings from previous studies with the results obtained in this study. Subsequently, to complete the mapping of outer areas, we used the CRUST1.0 crustal reference model [Laske et al., 2013]. The resulting general map of crustal thickness of Mongolia is depicted in Fig. 7. This map provides a holistic view of crustal lateral variation across Mongolia, incorporating both finding data from studies and modeled estimates from the CRUST1.0 reference model.
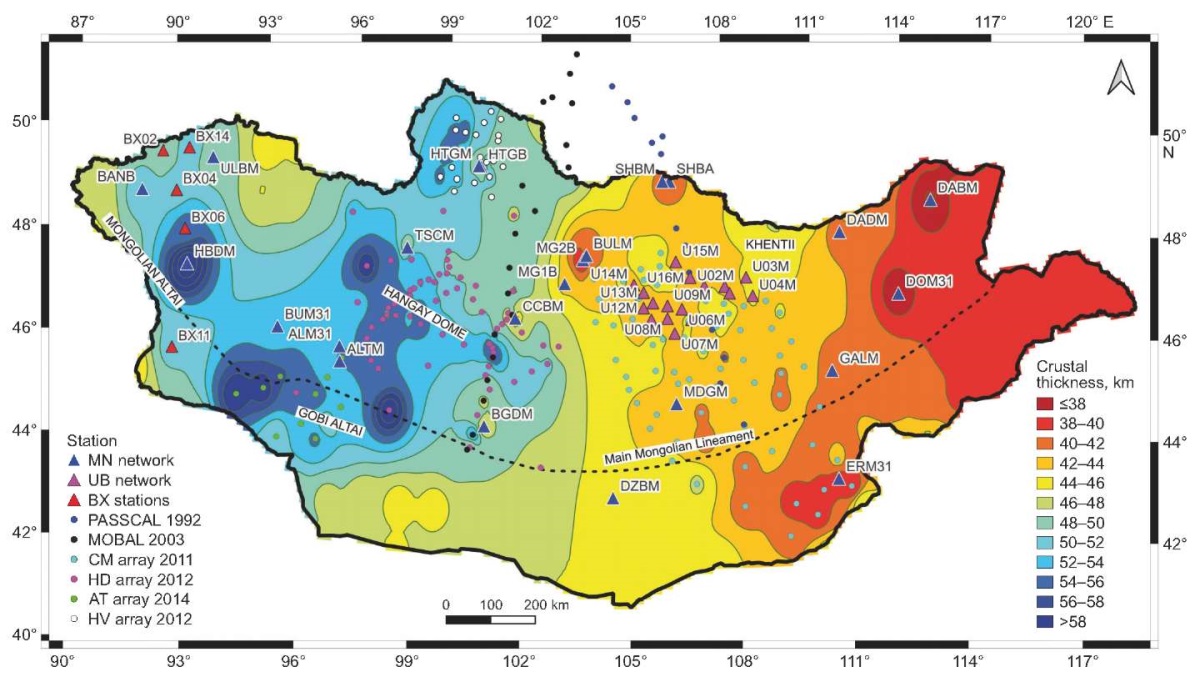
Fig. 7. A general map of the crustal thickness of Mongolia.
Рис. 7. Общая карта мощности земной коры Монголии.
From our analysis of the radial receiver functions calculated in the time domain for most stations, we have observed distinct direct P phases and sharp P-to-S (Ps) converted phases at the Moho, occurring approximately 5–6 seconds after the P arrival. It can be observed that the amplitude of the observed transverse receiver functions is close to the pre-noise before the direct P phase. We have noted that negative amplitudes between the direct P phases and P-to-S converted phases in the receiver functions from certain azimuths. This phenomenon may be attributed to seismically low-velocity zones within the crust beneath the seismic station. Moreover, we have observed variations in the characteristics of P-to-S converted phases across different azimuths. This variability could be explained by the presence of an anisotropic structure within the crust and the potential for a dipping Moho beneath the stations. These observations suggest the presence of complex and heterogeneous crustal structures, which contribute to the diversity in seismic wave propagation characteristics observed in our receiver functions analysis.
Our findings suggest that the characteristics of P-to-S converted phases, as well as the presence of negative amplitudes in stacked receiver functions, may be correlated with regional tectonostratigraphic terranes in Mongolia [Badarch et al., 2002]. For instance, the BULM station, situated in the Permian Triassic volcanic plutonic belt, exhibits a distinctively sharp and narrow high P-to-S converted phase in its observed receiver functions. Contrarily, the DZBM station, located in southern Mongolia within the Gurvansayhan Island Arc Terrane, shows a wider and moderately sized amplitude of the P-to-S converted phase. On the other hand, the HBDM station, positioned on the Hovd Accretionary Wedge Terrane, showcases a less pronounced and sharper P-to-S converted phase at Moho discontinuity. Additionally, observed receiver functions from the HBDM, BX02, BX04, and BX06 stations exhibit converted phases between P and P-to-S arrivals. The terrane is complex as fault-bounded disrupted blocks, thrust sheets, and tectonic slivers with polydeformed, metamorphosed volcanoclastic and sedimentary rocks. Overall, the accretion wedge’s structural complexity may influence the characteristics of incoming teleseismic waveforms.
The Vp/Vs ratio and Poisson ratio are indicative of the composition of the continental crust [Zandt, Ammon, 1995; Christensen, 1996]. With an average crustal Vp/Vs ratio of 1.75, our study suggests a slightly lower value compared to the global average Vp/Vs ratio of 1.77 in the continental crust. In our teleseismic receiver function H-k stacking inversion, we used a Vp value of 6.11 km/s, except for the BULM station. Our study results indicate that the crust beneath the Hentei Mountain ranges, the Valley of Lakes, and eastern Mongolia exhibits more felsic composition compared to other regions. Conversely, the presence of high Vp/Vs ratios and Poisson’s ratios beneath MG2B, BULM, and SHBM stations, situated on the Permian Triassic volcanic plutonic belt, suggests more mafic crust beneath these locations. It is important to note that the timing of P, Ps, and later multiples observed in receiver functions is directly related to the Vp/Vs ratio. Therefore, the mafic composition of the crust beneath these stations may contribute to the observed low S wave velocity and high Vp/Vs ratio.
The lateral variation in crustal thickness across Mongolian territory exhibits a considerable range, generally characterized by thicker crust beneath mountainous regions and thinner crust towards eastern Mongolia. However, the limited number of seismic stations spread across the vast territory makes it challenging to fully explain this variation using Airy isostasy theory [Airy, 1855]. The significant differences observed, such as the thick crust beneath the Mongol-Altai, Gobi-Altai, Hangay dome, Khuvsgul, and Khentii mountains, contrasted with the thin crust in lowland areas, are more likely attributable to the complex tectonic evolution of Mongolia.
The distribution of seismic stations of the UB network operating around Ulaanbaatar overlaps with the stations in the northern part of the CM network [He et al., 2016]. The results obtained from both the UB and CM network stations regarding the thickness of the crust beneath the Ulaanbaatar region show similarity. For instance, stations U05M and CM24 are approximately 7 km apart, and the average crustal thickness beneath each station is 43.3 and 44.9 km, respectively. This consistency in the crustal thickness estimates from stations in both networks reinforces the reliability of the findings and provides mutual validation of the results obtained from independent seismic networks.
The locations of the CCBM station of the MN network and the TSET station of the MOBAL transect are close to each other. The thickness of the crust beneath the TSET station was determined to be 50.0 km thick [Mordvinova et al., 2007], whereas we determined the crustal thickness beneath the CCBM station as 42.3±0.3 km by H-k stacking analysis. Despite the stations being only 10 km apart, the difference in crustal thicknesses may be attributed to the methods used in the studies, as well as the quantity and quality of the data used for the receiver function analysis.
The permanent stations BGDM, ALTM, HTGM, and BULM of the MN network are situated near HD09, AT06, HV14, and HD72 stations of HD, AT, and HV networks [Meltzer et al., 2019]. Some of these stations are even positioned at the same geographical coordinates. The thickness of the crust beneath the HD, AT, and HV stations was determined by teleseismic receiver function H-k stacking analysis [Stachnik et al., 2014], making the results more suitable for comparison with this study. Specifically, beneath the BGDM station, the thickness of the crust is 46.2 km, whereas beneath the HD09 station, it measures 48.4 km. At the ALTM station, the thickness of the crust is 52.0 km, whereas it is estimated to be 56.7 km at AT06. The HTGM station has a crustal thickness of 47.3 km, while the HV14’s crustal thickness is estimated at 51.4 km. The thickness of the crust beneath the BULM station was determined to be 37.7 km, whereas the HD72’s crust is estimated to be 43.8 km thick. Stations BULM and HD72 are located exactly at the same location, yet there is a 6 km disparity in estimated crustal thickness values.
The BULM station is a permanent seismic broadband station, and our study utilized 261 receiver functions derived from teleseismic events occurring between 2014 and 2023 to determine the crustal thickness and its characteristics (see Fig. 2). Correlation-selected receiver functions with high signal-to-ratio and their stacked receiver function clearly show P-to-S phases and other multiples. Additionally, the teleseismic events used in our analysis exhibit a broad azimuthal distribution, enhancing the reliability of the average crustal thickness determination beneath the BULM station. We hypothesize that the thin crustal thickness and high Vp/Vs and Poisson’s ratios beneath the BULM and MG2B stations can be attributed to the effects of a mantle plume and crustal thinning process.
The distribution of the Bouguer anomaly closely reflects the structure of the Earth’s crust, particularly the upper crust. Typically, a high negative gravity Bouguer anomaly corresponds to a thick crust whereas a low negative anomaly is associated with a thinner crust. We have observed that the general map of the crustal thickness reasonably correlates with the Bouguer gravity model of Mongolia [Baatarchuluun, Daariimaa, 2017]. In the mountainous regions such as Mongol Altai, Gobi-Altai, Hangay, and Khentii, where the crust tends to be thicker, there is a notable negative Bouguer anomaly with high intensity, ranging from –300 to –180 mGal. Contrastingly, in the plains of southern and eastern Mongolia, where the crust is thinner, we observe a low negative Bouguer anomaly with lower intensity, ranging from –130 to –60 mGal (Fig. 8).
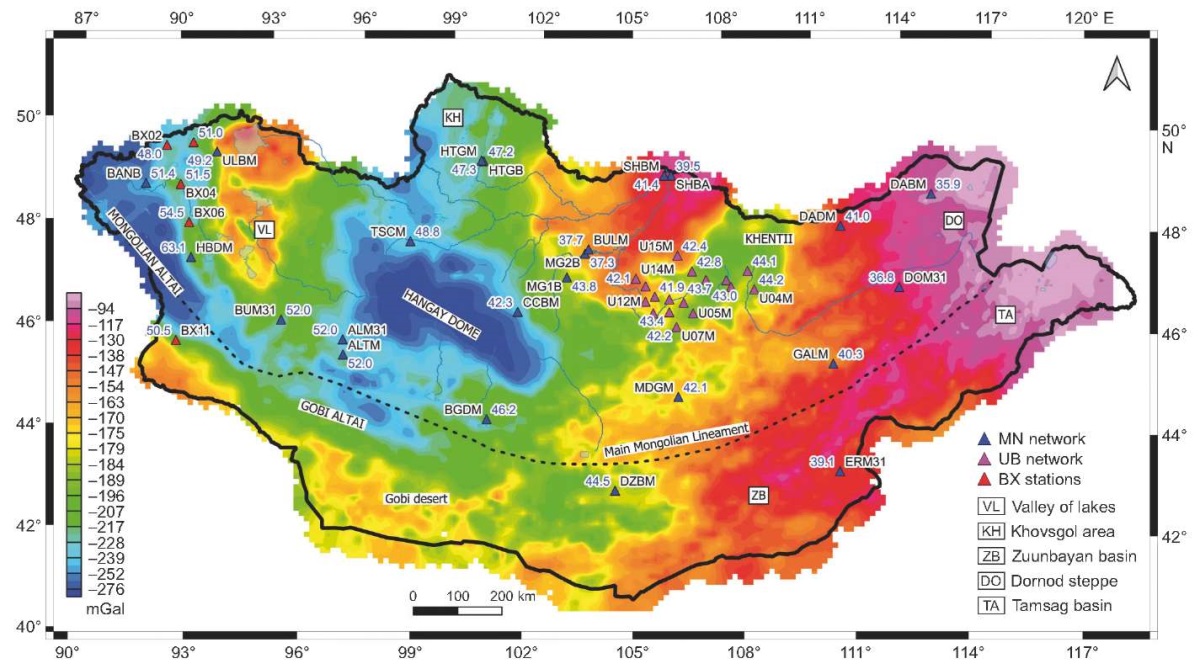
Fig. 8. Map of Bouguer gravity anomalies and the thickness of the crust beneath the stations used in the study.
The background map depicts the Bouguer gravity anomalies across Mongolian territory (Baatarchuluun T., Daariimaa B., 2017). Triangles and numbers denote the Mongolian Seismic Network’s temporary and permanent broadband stations, along with the corresponding values of crustal thickness.
Рис. 8. Карта гравитационных аномалий Буге и мощности коры под станциями, использованными в исследовании.
На фоновой карте изображены гравитационные аномалии Буге на территории Монголии (Баатарчулуун Т., Даариимаа Б., 2017). Треугольники и цифры обозначают временные и постоянные широкополосные станции Монгольской сейсмической сети и соответствующее значение толщины земной коры.
We estimated the crustal thickness, average crustal Vp/Vs ratio and ν- Poisson’s ratio beneath 45 permanent broadband seismic stations using teleseismic receiver function H-k stacking analysis. Combining our findings with previous studies, we generated a general map illustrating crustal thickness across Mongolia. Our study revealed that the crustal thickness ranges from 35.9 to 63.1 km, with a mean value of 45 km. Notable, crustal thickness exhibits a gradual increase from east to west in Mongolia, a trend that aligns reasonably with the country’s topography and the Bouguer anomaly model. One interesting anomaly resulting from our receiver function is a notable anomaly regarding the BULM stations in the Orkhon-Selenge region, where the average crustal thickness was estimated to be 37.7±0.4 км. To further investigate this anomaly, we installed the temporary MG2B station in the same region. Remarkably, the thickness of the crust beneath the MG2B station was determined to be 37.3±1.2 km, confirming the consistency of the anomaly.
The bulk crustal Vp/Vs ratio exhibits a range of 1.68 and 1.92, with an average value of 1.74. Notably, the Vp/Vs ratio in the crust of northern Mongolia tends to be relatively higher than the average value, falling within the range of 1.80–1.92. Interestingly, there is no discernible correlation between an elevation of the stations and Vp/Vs ratios, as well as Poisson’s ratio. Based on the elevation of the stations and the map of the crustal thickness, we can conclude that in general, thicker crust is typically found in mountainous and elevated regions, while thinner crust is more prevalent in lowlands. However, it is important to acknowledge the limitations of our study. The study area is expansive, and the number of seismic stations is relatively small and sparsely distributed. Therefore, while these general trends are observed, further research with denser station coverage would provide a more detailed understanding of crustal characteristics across Mongolia. Finally, the application of our study results to the update of the current seismic model and the processing of earthquake data will be a significant contribution to seismological research in Mongolia.
The authors express their sincere appreciation for the support provided by the Department of Science, Technology, Innovation Policy, and Coordination of Policy Implementation of the Ministry of Education and Science of Mongolia and the Seismological Department of the Institute of Astronomy and Geophysics, Mongolian Academy of Sciences, as well as Department of Geology and Geophysics of the National University of Mongolia. We also acknowledge the utilization of waveform data from the broadband seismic stations of the Mongolian Seismic Network in our research. The authors acknowledge the use of ChatGPT3.5 to improve our draft and correct English sentence structure. We used the Free and Open Source QGIS and MATLAB to create the map plots.
Baasanbat Tsagaan played a significant role in conceiving the study, implementing the methodology, utilizing software, scripting, preparing data, drawing figures, interpreting results, and drafting the original manuscript. Odonbaatar Chimed valuably contributed to the research design and implementation, as well as participated in the writing process through reviewing and editing. Baatarchuluun Tsermaa provided valuable contributions by comparing the study results with the Bouguer anomaly model, validating the findings, and participating in the writing process through reviewing and editing. Ulambadrakh Khukhuudei responsibly contributed by comparing the study results with the regional tectonostratigraphic terrane map, validating the findings, and participating in the writing process through reviewing and editing.
The authors declare that they have no conflicts of interest relevant to this manuscript.
1. Airy G., 1855. III. On the Computation of the Effect of the Attraction of Mountain-Masses, as Disturbing the Apparent Astronomical Latitude of Stations in Geodetic Surveys. Philosophical Transactions of the Royal Society of London 145, 101–104. https://doi.org/10.1098/rstl.1855.0003.
2. Ammon C.J., Randall G.E., Zandt G., 1990. On the Nonuniqueness of Receiver Function Inversions. Journal of Geophysical Research: Solid Earth 95 (B10), 15303–15318. https://doi.org/10.1029/JB095iB10p15303.
3. Baasanbat T., Shibutani T., 2015. Receiver Function Study in the Ulaanbaatar Region. IISEE Abstract Database. Available from: https://iisee.kenken.go.jp/syndb/?action=abstr&id=MEE14601&est=S&year=20 (Last accessed March 14, 2024).
4. Badarch G., Cunningham D.W., Windley B.F., 2002. A New Terrane Subdivision for Mongolia: Implications for the Phanerozoic Crustal Growth of Central Asia. Journal of Asian Earth Sciences 21 (1), 87–110. https://doi.org/10.1016/S1367-9120(02)00017-2.
5. Christensen N.I., 1996. Poisson’s Ratio and Crustal Seismology. Journal of Geophysical Research: Solid Earth 101 (B2), 3139–3156. https://doi.org/10.1029/95JB03446.
6. Clayton R.W., Wiggins R.A., 1976. Source Shape Estimation and Deconvolution of Teleseismic Bodywaves. Geophysical Journal International 47 (1), 151–177. https://doi.org/10.1111/j.1365-246X.1976.tb01267.x.
7. Davis P.M., Gao S., Borton L., 2001. Analysis of Digital Teleseismic Array Data Collected in South Central Siberia and Northern Mongolia, GSN SKS Waves and S Wave from Lop nor Nuclear Explosions. Final Technical Report. University of California, Los Angeles, 74 p.
8. Efron B., Tibshirani R., 1986. Bootstrap Methods for Standard Errors, Confidence Intervals, and Other Measures of Statistical Accuracy. Statistical Science 1 (1), 54–75 https://doi.org/10.1214/ss/1177013815.
9. He J., Wu Q.-J., Sandvol E., Ni J., Gallegos A., Gao M., Sodnomsambuu D., 2016. The Crustal Structure of South Central Mongolia Using Receiver Functions. Tectonics 35 (6), 1392–1403. https://doi.org/10.1002/2015TC004027.
10. Langston C.A., 1977. The Effect of Planar Dipping Structure on Source and Receiver Responses for Constant Ray Parameter. Bulletin of the Seismological Society of America 67 (4), 1029–1050. DOI:10.1785/BSSA0670041029.
11. Laske G., Masters G., Ma Z., Pasyanos M., 2013. Update on CRUST1.0 – A 1-degree Global Model of Earth’s Crust. In: Abstracts of the General Assembly of the European Geosciences Union (April 7–12, 2013, Vienna, Austria). Vol. 15. EGU, EGU2013-2658. https://doi.org/10.17611/DP/emccrust10.
12. Ligorría J.P., Ammon Ch.J., 1999. Iterative Deconvolution and Receiver-Function Estimation. Bulletin of the Seismological Society of America 89 (5), 1395–1400. https://doi.org/10.1785/BSSA0890051395.
13. Meltzer A., Stachnik J.C., Sodnomsambuu D., Munkhuu U., Tsagaan B., Dashdongog M., Russo R., 2019. The Central Mongolia Seismic Experiment: Multiple Applications of Temporary Broadband Seismic Arrays. Seismological Research Letters 90 (3), 1364–1376. https://doi.org/10.1785/0220180360.
14. Mordvinova V.V., Deshamps A., Tundev D., Deverchere J., Munkhuu U., Sankov V.A., Perrot J., 2007. Velocity Structure of the Lithosphere on the 2003 Mongolian-Baikal Transect from SV Waves. Izvestiya, Physics of the Solid Earth 43, 119–129. https://doi.org/10.1134/S1069351307020036.
15. Mordvinova V.V., Kobelev M.M., Khritova M.A., Turutanov E.Kh., Kobeleva E.A., Trynkova D.S., Tsydypova L.R., 2019. The Deep Velocity Structure of the Southern Margin of the Siberian Craton with Respect to Baikal Rifting. Doklady Earth Sciences 484, 66–70. https://doi.org/10.1134/S1028334X19010033.
16. Mordvinova V.V., Zorin Y.A., Gao S., Davis P., 1996. Thickness of the Crust along the Irkutsk-Ulan-Bator-Undurshil Profile from Spectral Ratios of Body Seismic Wave. Izvestiya, Physics of the Solid Earth 31 (9), 727–734.
17. Porritt W.R., Miller S.M., 2018. Updates to Funclab, a Matlab Based Gui for Handling Receiver Functions. Computers & Geosciences, 111, 260–271. https://doi.org/10.1016/j.cageo.2017.11.022.
18. Stachnik J.C., Meltzer A., Souza S., Munkhuu U., Tsagaan B., Russo R.M., 2014. Lithospheric Structure beneath the Hangay Dome, Central Mongolia. In: AGU Fall Meeting (December 15–19, 2014, San Francisco). AGU, T21A-4555.
19. Suvorov V.D., Mishenkina Z.M., Petrick G.V., Sheludko I.F., Seleznev V.S., Solovyov V.M., 2002. Structure of the Crust in the Baikal Rift Zone and Adjacent Areas from Deep Seismic Sounding Data. Tectonophysics 351, (1–2), 61–74. https://doi.org/10.1016/S0040-1951(02)00125-7.
20. Tkalčić H., Chen Y., Liu R., Zhibin H., Chan W., 2011. Multistep Modelling of Teleseismic Receiver Functions Combined with Constraints from Seismic Tomography: Crustal Structure beneath Southeast China. Geophysical Journal International 187 (1), 303–326. https://doi.org/10.1111/j.1365-246X.2011.05132.x.
21. Zandt G., Ammon C.J., 1995. Continental Crust Composition Constrained by Measurements of Crustal Poisson’s Ratio. Nature 374, 152–154. https://doi.org/10.1038/374152a0.
22. Zhu L., Kanamori H., 2000. Moho Depth Variation in Southern California from Teleseismic Receiver Functions. Journal of Geophysical Research: Solid Earth 105 (B2), 2969–2980. https://doi.org/10.1029/1999JB900322.
23. Zorin Yu.A., Mordvinova V.V., Turutanov E.Kh., Belichenko B.G., Artemyev A.A., Kosarev G.L., Gao S.S, 2002. Low Seismic Velocity Layers in the Earth’s Crust beneath Eastern Siberia (Russia) and Central Mongolia: Receiver Function Data and Their Possible Geological Implication. Tectonophysics 359 (3–4), 307–327. https://doi.org/10.1016/S0040-1951(02)00531-0.
Ulaanbaatar 13343; Ulaanbaatar 14200
Ulaanbaatar 13343
Ulaanbaatar 14200
Ulaanbaatar 14200
Tsagaan B., Chimed O., Tsermaa B., Khukhuudei Y. THE CRUSTAL THICKNESS AND Vp/Vs RATIO IN MONGOLIA. Geodynamics & Tectonophysics. 2024;15(4):0771. https://doi.org/10.5800/GT-2024-15-4-0771. EDN: IBNQWM


Editor-in-Chief
Sklyarov E.V.664033, Irkutsk, Lermontova St., 128,
IEC SB RAS Institute of the Earth's crust
E-mail.: gt@crust.irk.ru
tel.: 8 3952 425422
Processing of personal data


