


Contents
Scroll to:
https://doi.org/10.5800/GT-2025-16-6-0858
EDN: KNGEMO
Scroll to:
This study presents the results of investigations into volcanic strata of the Zharma-Saur zone, located in the western part of the Hercynian Ob’-Zaisan folded area at its boundary with the Early Paleozoic Boshchekul-Chingiz folded area, which forms part of the Kazakhstan composite block (paleocontinent). U-Pb geochronological studies revealed two distinct groups of volcanic rocks within the zone: Early Carboniferous (~345 Ma) and Late Carboniferous (~303 Ma). Low-K tholeiitic and calc-alkaline basalts, basaltic andesites, and andesites represent the Early Carboniferous volcanic rocks, which are the main constituents of the eastern Zharma-Saur zone. The Late Carboniferous rocks comprise a trachybasalt to trachyrhyolite bimodal series, which forms an isolated brachysyncline in the eastern part of the zone. The formation of the early volcanic rocks corresponds to the subductional phase of the zone evolution, while the later volcanics may be associated with post-collisional extension processes.
Penkina V.A., Kotler P.D., Khromykh S.V., Xu Y., Kulikova A.V. VOLCANISM OF THE ZHARMA-SAUR ZONE, EASTERN KAZAKHSTAN: GEOCHRONOLOGY, GEOCHEMISTRY AND TECTONIC IMPLICATIONS. Geodynamics & Tectonophysics. 2025;16(6):858. https://doi.org/10.5800/GT-2025-16-6-0858. EDN: KNGEMO
The Zharma-Saur zone is a junction area between Late Paleozoic formations of the Irtysh-Zaisan (Ob’-Zaisan) folded area and Early Paleozoic formations of the Boshchekul-Chingiz folded area in the western part of the Central Asian Orogenic Belt (CAOB) (Fig. 1). The complexes of the Zharma-Saur zone are primarily composed of Devonian-Carboniferous volcanic, volcano-sedimentary, and sedimentary rocks, whose formation is associated with the evolution of the northeastern active margin of the Kazakhstan composite block. However, several aspects regarding this zone remain debated, including its position within the Ob’-Zaisan (Irtysh) paleo-ocean relative to the continental blocks, as well as the timing of the onset of subduction and the dip direction of the subducting slab [Didenko, Morozov, 1999; Filippova et al., 2001; Shen et al., 2012; Chen et al., 2017; Song et al., 2020; Xu et al., 2022; Safonova, Perfilova, 2023]. Thus, a comprehensive understanding of the geological structure and evolutionary history of this structural zone may be the key to resolving such issues of regional tectonics and geodynamics as the interaction between the Caledonian and Hercynian fold systems of the CAOB and the evolution of the closure of the Ob’-Zaisan paleo-ocean during the Carboniferous period.
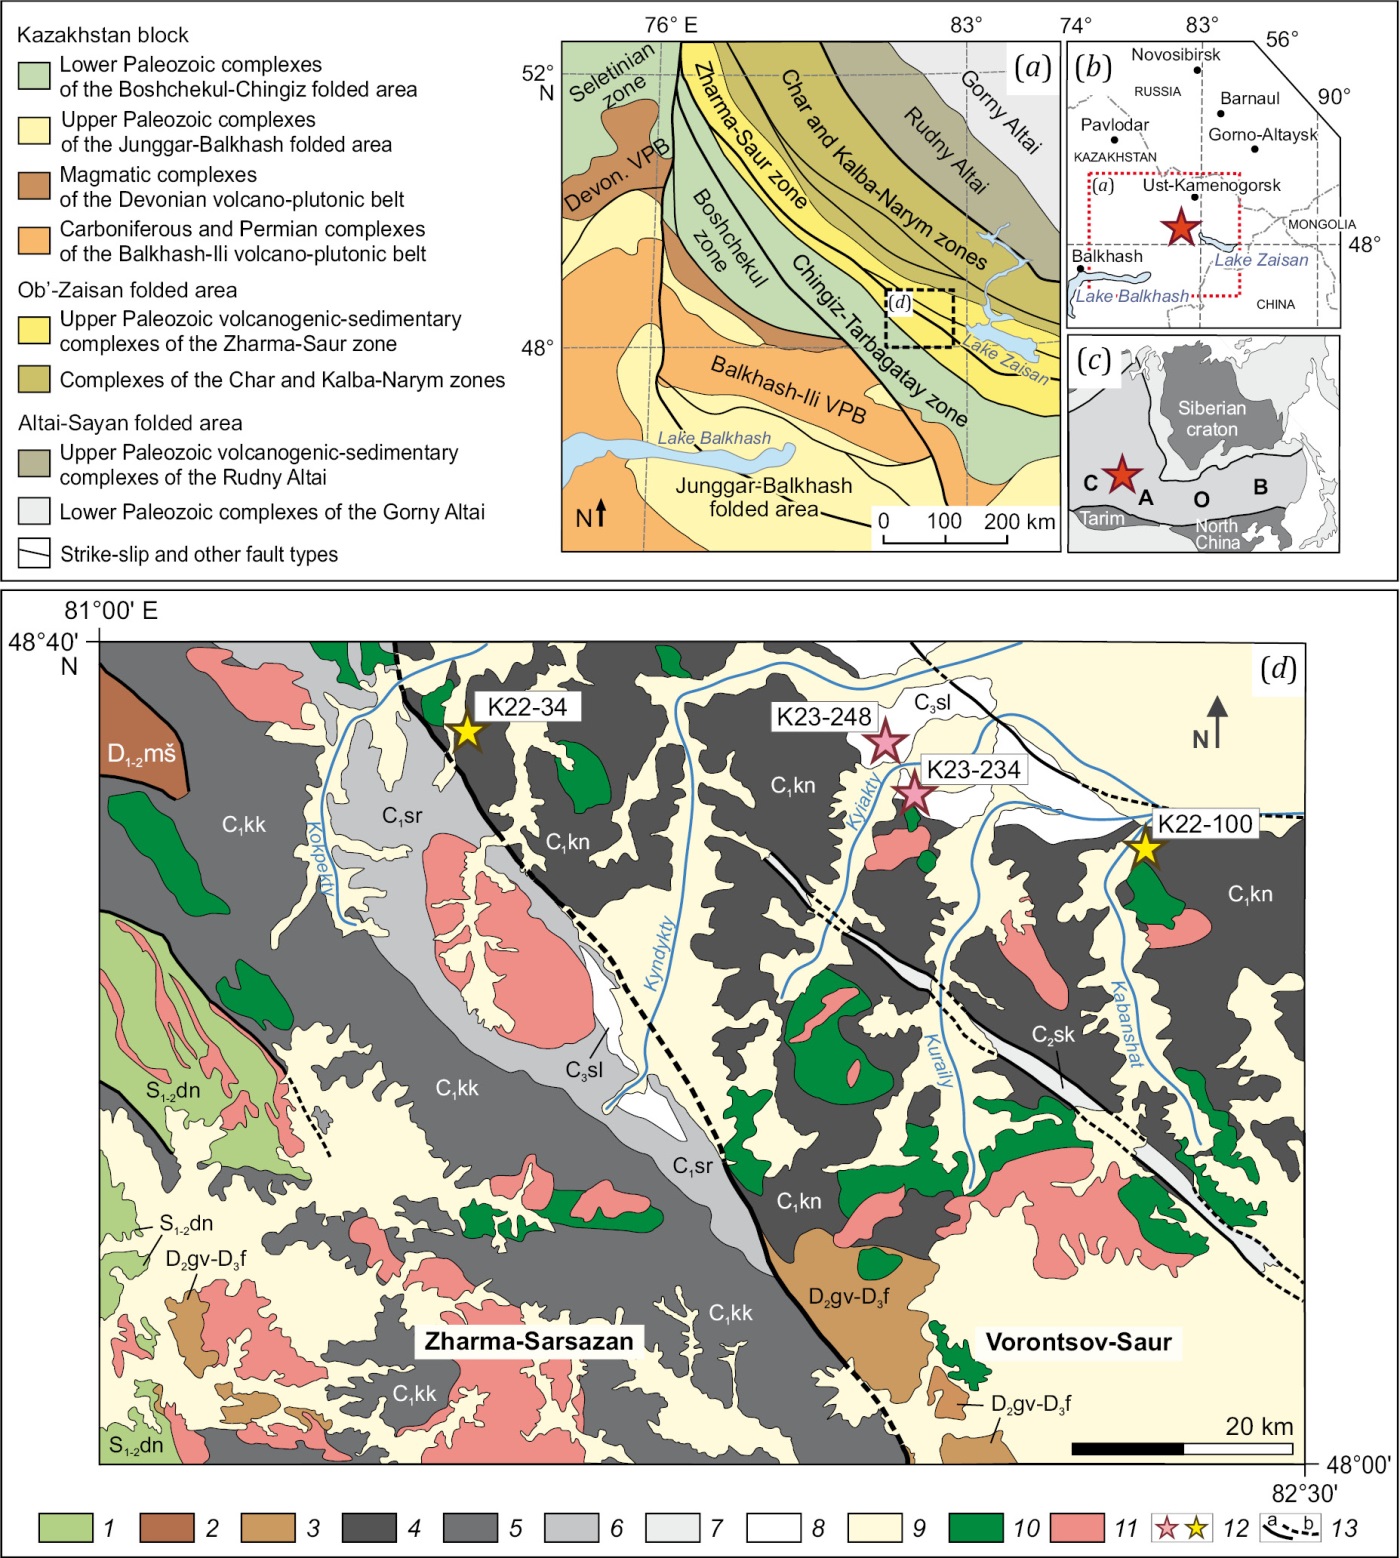
Fig. 1. Geotectonic position of the Zharma-Saur zone.
(a) – tectonic zoning scheme of the main Paleozoic structures at the junction of the Kazakhstan Composite Block and the Ob’-Zaisan folded area (modified after [Vladimirov et al., 2003; Degtyarev, 2012]); (b) – Inset map showing the geographical location of the study area; (c) – Inset map illustrating the tectonic setting of the study area; (d) – geological map of the Zharma-Saur zone modified (after [Geological Map…, 2014]). 1–8 – formations and units: 1 – Donenzhal fm., S1-2dn, 2 – Mashan fm., D1-2mš, 3 – Givetian-Frasnian unit, D2gv-D3f, 4 – Koyanda fm., C1kn, 5 – Kokon’ fm., C1kk, 6 – Sirektas fm., C1sr, 7 – Sarkul fm., C2sk, 8 – Saldyrmin fm., C3sl; 9 – Cenozoic deposits; 10–11 – intrusive rocks: 10 – gabbroids, 11 – granitoids; 12 – samples for geochronological study: yellow – tuffaceous sandstones, pink – rhyodacites; 13 – faults: a – reliable, b – inferred.
The total length of the Zharma-Saur zone is about 500 km, of which about 80 km are in China, while the rest dominant part is located within Eastern Kazakhstan (East Kazakhstan and Abay regions of the Republic of Kazakhstan). This geographic division has resulted in the situation where most knowledge and analytical information on geology of the Zharma-Saur zone was obtained from its relatively small fragment located in China [Shen et al., 2012; Chen et al., 2016, 2017; Borbugulov et al., 2018; Song et al., 2020; Xu et al., 2022], and the largest part of the zone until recently was a kind of "blank spot" in terms of modern scientific methods and approaches. To date, modern research in the Kazakhstan fragment of the Zharma-Saur zone has focused primarily on the study of intrusive and dike magmatism [Khromykh, 2022; Kotler et al., 2024; Volosov et al., 2025], as well as on studying sedimentary formations and determining provenances [Safonova, Perfilova, 2023; Penkina et al., 2024]. In contrast, the volcanic sequences, which form the basis of the island-arc zone, have been considered only indirectly based on the data for geological mapping performed in the Soviet and post-Soviet periods. However, the geological maps with different scales for the Zharma-Saur zone lack a single consistent stratigraphic scheme and show different formations of different ages, with adjacent map sheets often not matched to each other [Geological Map…, 1998, 2014; Decisions…, 1991; Zholtayev et al., 2021].
The aim of this study was to determine the age, petro-geochemical composition, and tectonic settings of the volcanic rocks in the Kazakhstan segment of the Zharma-Saur zone. This research is based on the results of modern petrographic, petro-geochemical, and U-Pb geochronological studies of the volcanic strata of the Zharma-Saur zone.
The Zharmа-Saur zone is a NW-trending structure composed of volcanogenic-sedimentary and sedimentary strata. It is widely interpreted as a paleo-island arc system that developed within the Ob’-Zaisan branch of the Paleo-Asian Ocean during the Late Paleozoic [Ermolov et al., 1977; Berzin et al., 1994; Didenko, Morozov, 1999; Degtyarev, 2012; Filippova et al., 2001; Xu et al., 2022; Safonova, Perfilova, 2023; Penkina et al., 2024]. Based on its geological structure and rock composition, the Zharma-Saur zone is subdivided into two subzones (Fig. 1, d): the tuffogenous-terrigenous Zharma-Sarsazan subzone in the west and the predominantly volcanic Vorontsov-Saur subzone in the east.
The tuffogenous-terrigenous rocks of the Zharma-Sarsazan subzone are deposited in the Early Carboniferous flyschoid trough, which is underlain by the Lower-Middle Paleozoic basement that forms the northeastern part of the Kazakhstan block [Degtyarev, 2012]. The stratigraphic section of the Zharma-Sarsazan subzone overlies the Early Paleozoic basement, which comprises volcanogenic-sedimentary strata of the Lower Ordovician Namass fm. and the Lower Silurian Donenzhal fm. It is unconformably overlain by felsic pyroclastic material and high-potassium volcanic rocks of the Lower-Middle Devonian Mashan fm., as well as red-colored terrigenous deposits of the Middle and Upper Devonian (Givetian-Frasnian stage). The Lower Carboniferous sections of Tournaisian age are represented predominantly by terrigenous deposits, slightly admixed with tuffogenous material and lying with a complete structural unconformity on the Ordovician, Silurian, and Devonian rocks. The Zharma-Sarsazan subzone is mainly composed of a thick Tournaisian terrigenous sequence – the Kokon’ fm. Volcanic rocks and tuffs, and, to a lesser extent, terrigenous rocks of the Upper Visean–Lower Serpukhovian Sirektas fm. [Geological Map…, 2014; Zholtayev et al., 2021], deposited in the brachysyncline, rest with angular unconformity on the Tournaisian deposits.
The lower part of the Vorontsov-Saur subzone section is composed of the Givetian-Frasnian terrigenous rocks, which are fragmentarily exposed in the southern and southeastern parts along the border with the Zharma-Sarsazan subzone. The rocks grouped into the Tournaisian-Visean Koyanda fm. lie with a complete structural unconformity higher in the succession. The Koyanda fm. section, with a thickness of approximately 1.700 meters, is represented by basalts, basaltic andesites, andesites, tuffs, tufflavas, tuffaceous sandstones, as well as horizons of cherts, clay-chert, and siliceous siltstones. The Koyanda fm. is assigned to the Late Tournaisian-Early Visean based on a few faunal determinations [Geological Map…, 2014; Decisions…, 1991; Zholtayev et al., 2021].
According to the geological survey data, within the eastern part of the Vorontsov-Saur subzone lies the Tersayryk volcanogenic-sedimentary formation, overlying the Koyanda fm. conditionally dating back to the Lower Carboniferous [Geological Map…, 2014]. The Tersayryk fm. dates back to the Late Tournaisian–Early Visean based on brachiopods found in the tuffaceous sandstone interbeds, which corresponds fully to the age of the Koyanda fm. Results of detrital zircon provenance studies in the eastern and western parts of the Zharma-Saur zone also revealed no differences [Penkina et al., 2024], thus raising the question whether it is worthwhile to distinguish the Tersayryk fm. The research conducted within the framework of this study has shown that volcanic rocks found where the overlying contact was described are younger, differ in composition from the underlying rocks of the Koyanda fm., and should be considered part of a separate formation.
The concentrations of major rock-forming elements were determined by X-ray fluorescence (XRF) analysis at the Analytical Center for Multi-Elemental and Isotope Research SB RAS (IGM SB RAS, Novosibirsk, Russia) using the methodology proposed in [Karmanova, Karmanov, 2011]. Measurements were performed using ARL-9900XP X-ray fluorescence spectrometer (Thermo Fisher Scientific, Bremen, Germany). Drawing classification and discriminant diagrams involved recalculation of rock-forming oxide concentrations on a dry-matter basis (volatiles and loss of ignition were excluded).
Concentrations of rare earth (La, Ce, Pr, Nd, Sm, Eu, Gd, Tb, Dy, Ho, Er, Tm, Yb, Lu) and trace (Rb, Sr, Cs, Ba, Nb, Zr, Y, Hf, Ta, Th, U) elements were determined by inductively coupled plasma mass spectrometry (ICP-MS) using a high-resolution Finnigan Element II mass spectrometer (Thermo Fisher Scientific, Bremen, Germany) at the Analytical Center for Multi-Elemental and Isotope Research SB RAS (analyst I.V. Nikolaeva). Sample preparation and concentration measurements were performed according to the procedure described in [Nikolaeva et al., 2012].
U-Pb geochronological analysis of zircons was made using a laser ablation system based on a 193 nm excimer laser (Analyte Excite, Teledyne Cetac Technologies, Omaha, USA) coupled to iCAP Qс inductively coupled plasma quadrupole mass spectrometer (Thermo Fisher Scientific, Bremen, Germany) at the Geochronology Center of the Kazan Federal University (Kazan, Russia). All measurements were performed for masses ²⁰²Hg, ²⁰⁴(Pb+Hg), ²⁰⁶Pb, ²⁰⁷Pb, ²⁰⁸Pb, ²³²Th, ²³⁵U, ²³⁸U.
The laser beam diameter was 35 μm, with a pulse repetition rate of 5 Hz and a laser fluence of 3.0 J/cm². The analytical session involved the measurement of two standards (primary and secondary). Use has been made of international zircon reference materials: 91500 – reference standard (1065 Ma, [Wiedenbeck et al., 1995]); Plešovice – external standard (337 Ma, [Sláma et al., 2008]). The external standard was used to correct for laser-induced elemental fractionation, mass discrimination, and instrumental drift in the mass-spectrometer. Reference standard was analyzed to monitor the accuracy of the measurements. Besides, NIST SRM 612 glass was measured at the beginning, in the middle, and at the end of the session to account for mass spectrometer sensitivity. The mass-spectrometry data reduction, allowance for corrections, selection of optimal signal intervals, and calculation of isotopic ratios (²⁰⁷Pb/²⁰⁶Pb, ²⁰⁶Pb/²³⁸U, ²⁰⁷Pb/²³⁵U, ²⁰⁸Pb/²³²Th) and corresponding ages were performed using the Iolite 3.65 software package within Igor Pro 7 [Paton et al., 2010]. The errors of single analyses (ratios, ages) and calculated concordant ages are reported at the 2σ level. Weighted mean age calculation from isotopic ratios and probability density histogram plotting were performed using Microsoft Excel with the Isoplot 4.15 add-in [Ludwig, 2003]. The probability density histogram was plotted using zircon ²⁰⁶Pb/²³⁸U ages with a discordance value D (%) between –10 and +10 %. Analyses with discordance <–10 or >+10 % were excluded from the dataset. Discordance was calculated using the formula:
D=100(age(²⁰⁷Pb/²³⁵U)/age(²⁰⁶Pb/²³⁸U)–1).
To determine the formation time of volcanogenic-sedimentary strata in the Zharma-Saur zone and the formation stages of volcanism therein, the geochronological analysis has been made on tuffaceous sandstones from the Koyanda fm. and on felsic volcanic rocks, previously interpreted by other researchers as part of the overlying Early Carboniferous Tersayryk fm.
Earlier we presented the U-Pb geochronological data on detrital zircons from two samples of tuffaceous sandstones [Penkina et al., 2024] forming a single Early Carboniferous zircon age population. The analyzed samples, K22-34 (48°34'57.68" N, 81°28'59.01" E) and K22-100 (48°28'46.17" N, 82°17'23.65" E), yield a total age range from 392±7 to 330±13 Ma, and the relative probability curves display unimodal age distributions – 372–330 and 364–339 Ma, with peak ages at 348 and 355 Ma, respectively. Furthermore, the peak ages and the mean age of the youngest zircon grains are concordant within error, yielding values of 348 and 345±2 Ma (n=57) for sample K22-34, and 355 and 353±2 Ma (n=37) for sample K22-100, which allows a maximum depositional age to be dated back to the mid- to late Tournaisian (Fig. 2).
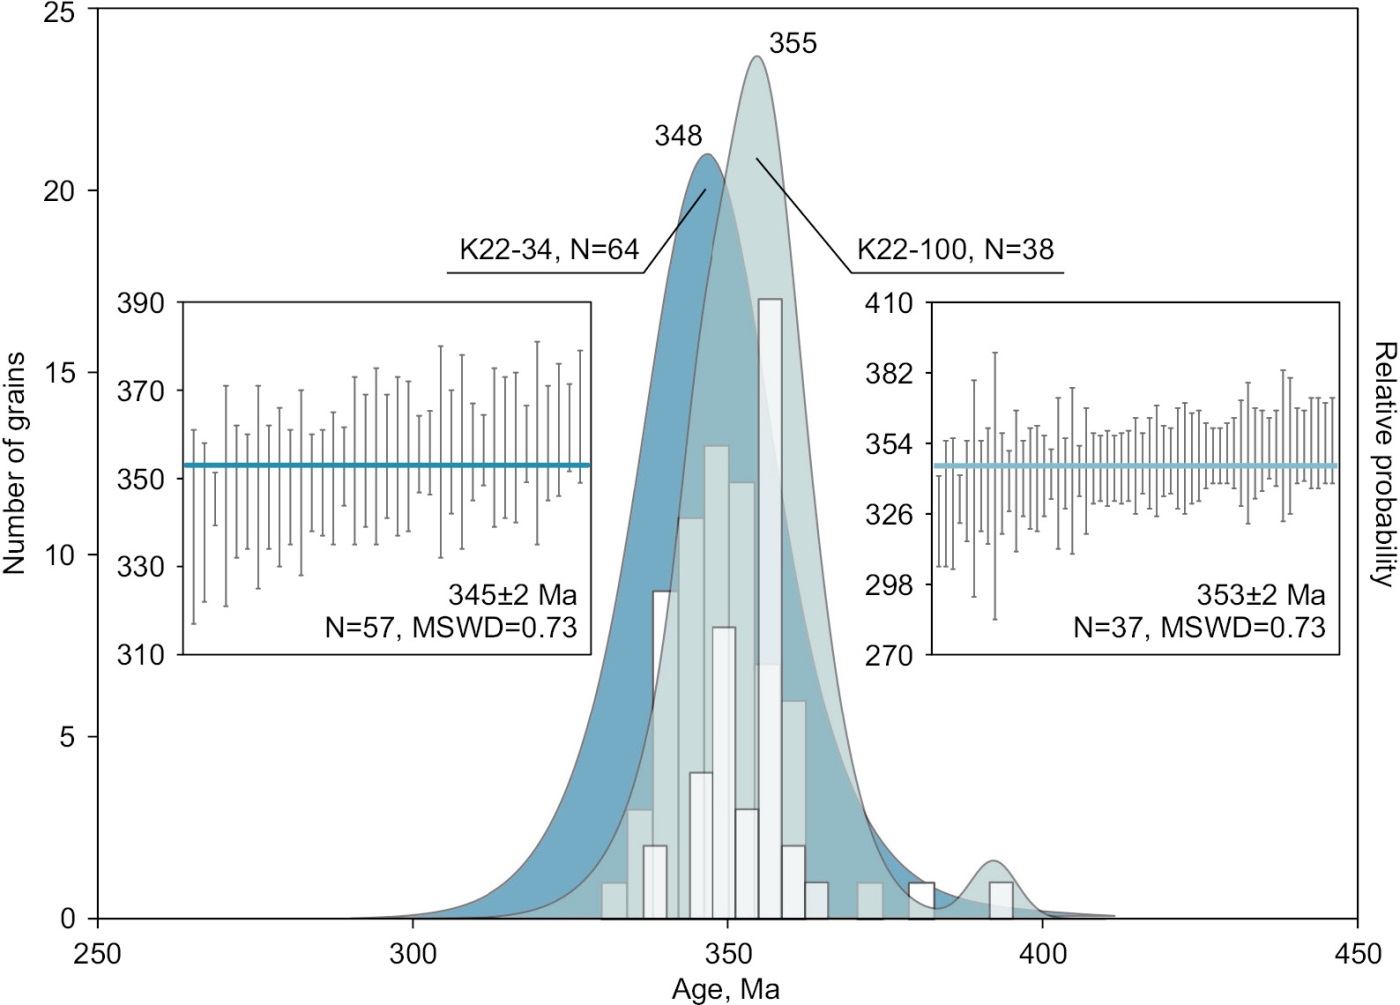
Fig. 2. Summary diagram with histograms and relative probability curves for ²⁰⁶Pb/²³⁸U ages of detrital zircons and weighted average ages of the youngest zircon populations from geochronological studies of two tuffaceous sandstone samples (K22-34 and K22-100) from the Koyanda fm. of the Zharma-Saur zone (after [Penkina et al., 2024]).
The geochronological investigation of volcanic rocks from the Zharma-Saur zone involved the selection of rhyodacites with porphyritic (sample K23-234; 48°34'09.43" N, 81°58'10.64" E) and aphyric (sample K23-248; 48°32'29.12" N, 82°00'23.17" E) textures. The studied rocks form extensive 50-100 m thick lava flows, which overlie the basalts of the Koyanda fm. and are assigned to the Early Carboniferous Tersayryk fm. [Geological Map…, 2014]. The samples were collected in the vicinity of the Zhylandy and Karakiya mountains, on both banks of the Kiyakty River where it changes its direction from sub-latitudinal to sub-meridional (see Fig. 1, d). Zircon grains from the separated monofractions are represented by colorless to pale yellowish, prismatic crystals. They are predominantly small (50–170 µm), angular fragments of larger (more than 300 µm) crystals, which are likely to result from the sample crushing process. Cathodoluminescence (CL) images reveal poorly defined oscillatory zoning in the outer domains of the crystals and less common sector zoning; zircons without visible zoning are also present (Fig. 3).
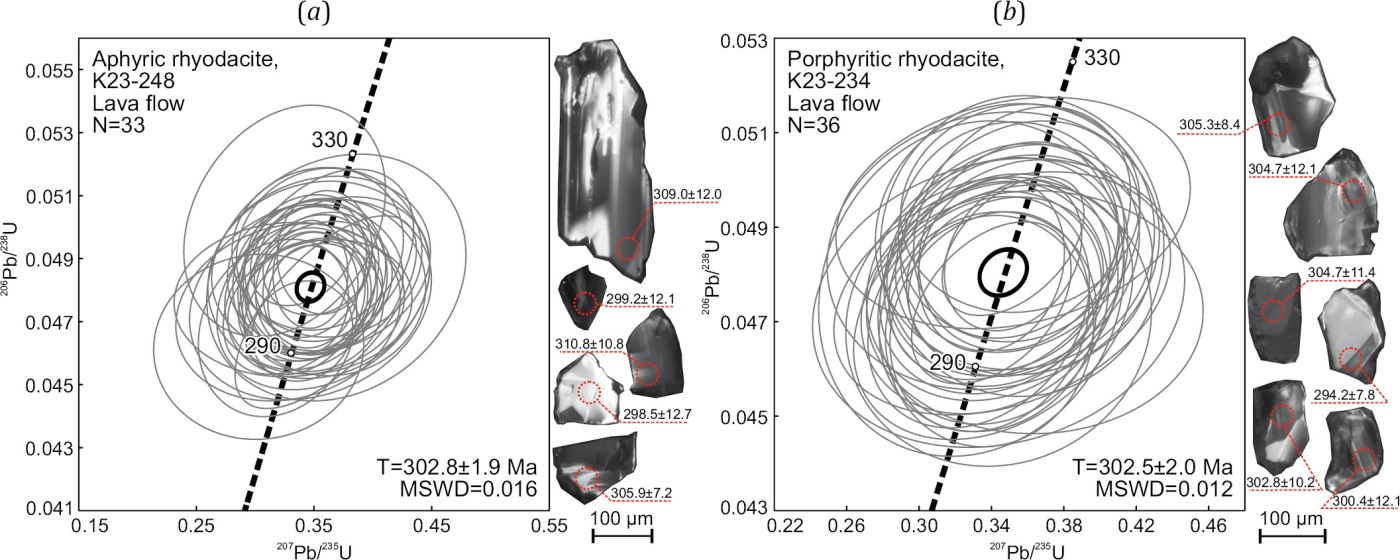
Fig. 3. Results of geochronological study of zircons from rhyodacite samples on concordia diagrams and CL images of selected zircon grains with individual age estimate points.
(a) – sample K23-248 – aphyric rhyodacite with an age estimate of 302.8±1.9 Ma (N=33); (b) – sample K23-234 – porphyritic rhyodacite with an age estimate of 302.5±2.0 Ma (N=36).
The studied zircon crystals exhibit Th/U ratios ranging from 0.7 to 1.6 (App. 1, Table 1.1), which is typical for magmatic zircon. The U-Pb dating method involved only zoned crystals wherever possible. Four out of 40 analyses for sample K23-234 and five out of 38 analyses for sample K23-248 yielded discordant U-Pb ages, and as such, they were excluded from further calculations. The U-Pb dating results for the rhyodacite samples are presented on concordia diagrams (Fig. 3). The aphyric rhyodacite (K23-248) yielded an age of 302.8±1.9 Ma. The zircons from the porphyritic rhyodacite sample (K23-234) yielded a concordant age of 302.5±2.0 Ma. The ages derived from both samples correspond to the Gzhelian age of the Late Pennsylvanian Epoch.
Thus, U-Pb geochronology revealed two distinct age groups within the sections of the Zharma-Saur zone. The mid- to late Tournaisian age of the tuffaceous sandstones corresponds to the age of the Koyanda fm., which constitutes the Vorontsov-Saur subzone, and the age of synchronous volcanism in this region is constrained to the Famennian-Visean interval, with its main pulse occurring during the Tournaisian. The second age group, with Late Pennsylvanian (Gzhelian) age determinations from the rhyodacite samples, most likely corresponds to the felsic effusive Saldyrmin fm. described in the western part of the Zharma-Saur zone (Zharma-Sarsazan subzone) and never found or mapped within the Vorontsov-Saur part of the zone before. Our further consideration would be given to felsic volcanic rocks as part of the Gzhelian Saldyrmin fm. and intermediate effusives found in the same section, while basalts and basaltic andesites associated with the tuffaceous sandstones are assigned to the Tournaisian Koyanda fm. For the western part of the Zharma-Saur zone (Zharma-Sarsazan subzone) there is a description of intrusive analogues of the Saldyrmin fm. effusives – moderately alkaline leucogranites of the Akzhaylyau massif, with a U-Pb age for the massif’s first phase ranging from 307.8±6.4 to 301.2±1.0 Ma [Kotler et al., 2024].
Basalts and basaltic andesites of the Koyanda fm. (Fig. 4) exhibit massive and amygdaloidal structures, with porphyritic, seriate-porphyritic, and less commonly aphyric rock textures. Plagioclase is invariably present as phenocrysts, often displaying zoning and intense albitization and saussuritization. Among the mafic minerals are occasional brown opacitized amphiboles and clinopyroxenes. Euhedral clinopyroxene crystals of diopside-augite composition are often twinned and zoned. The characteristics of the groundmass in these volcanic rocks indicate a microlitic and/or pilotaxitic texture, and low-abundant plagioclase laths in some samples suggest a former hyalopilitic texture with high original glass content. Among the volcanic rocks of the Koyanda fm. are also amphibole-pyroxene trachybasaltic andesites (Fig. 4) are also distinguished among the volcanic rocks of the Koyanda fm. These are vesicular and amygdaloidal rocks with a porphyritic texture. Among trachyandesibasalts are large euhedral zoned amphibole phenocrysts, saussuritized plagioclases, and colorless, sometimes twinned, augite crystals. The groundmass of these rocks is predominantly microlitic.
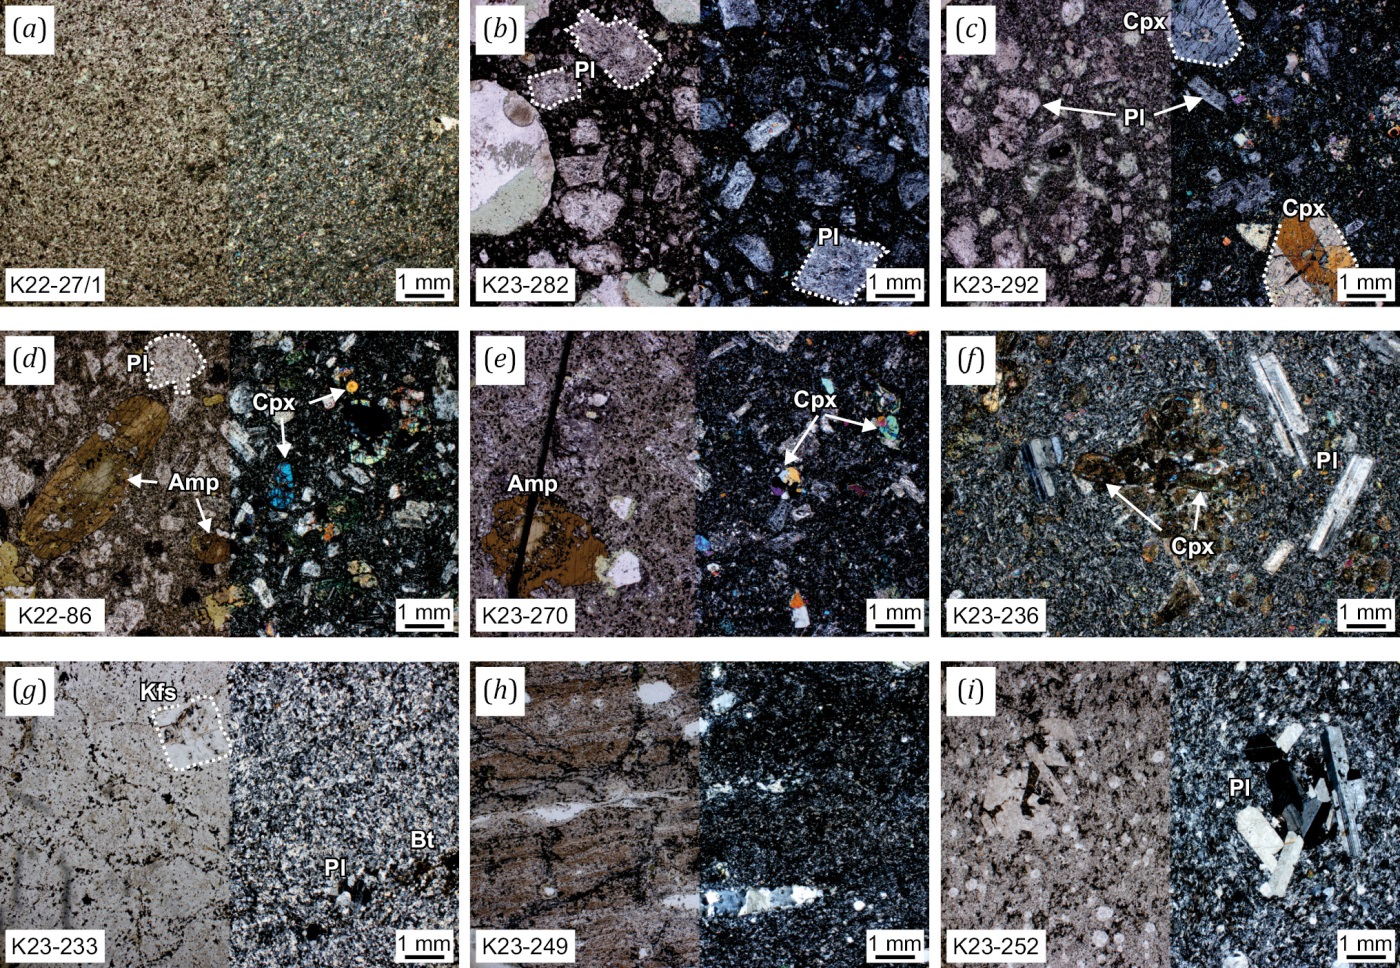
Fig. 4. Micrographs of petrographic thin sections of the Early Carboniferous volcanic rocks from the Zharma-Saur zone in parallel (left) and crossed (right) nicols.
(a–e) – Koyanda fm. (C₁kn): (a) – aphyric basalt, (b) – amygdaloidal plagiophyric basaltic andesite, (c) – amygdaloidal pyroxene-plagiophyric basalt, (d, e) – amphibole-pyroxene trachybasalts; (f–i) – Saldyrmin fm. (C₃sl): (f) – pyroxene trachybasalt, (g) – porphyritic rhyodacite, (h) – fluidal amygdaloidal rhyodacite, (i) – plagiorhyodacite. Pl – plagioclase; Kfs – K-feldspar; Cpx – clinopyroxene; Amp – amphibole; Bt – biotite.
Some intermediate volcanic rocks of the Saldyrmin fm. – pyroxene trachybasaltic andesites – occur in subordinate amounts (Fig. 4). These rocks are predominantly massive, less commonly amygdaloidal, and exhibit a porphyritic, most often glomeroporphyritic texture. The phenocryst assemblage consists of plagioclase, which displays sieve-textured zoning at its rims, and clinopyroxene (augite), which frequently forms glomeroporphyritic aggregates. The groundmass has a pilotaxitic texture. Accessory mineralization is represented by fine prismatic apatite crystals.
The Saldyrmin fm. is mainly composed of felsic effusives – rhyodacites (Fig. 4). These rocks exhibit spotted, banded, and amygdaloidal structures, with the amygdules elongated in the same direction. The rhyodacites display both porphyritic and aphyric textures. Phenocrysts include pelitized potassium feldspar and plagioclase, which occasionally forms aggregates with an ore mineral and a completely replaced mafic mineral. The groundmass of the rhyodacites is characterized by a felsitic texture and, less frequently, by a microlitic texture. More commonly, however, the groundmass exhibits a micropoikilitic texture, where irregularly isometric quartz grains contain microlites of albite.
The contents of petrochemical oxides (wt. %) and trace elements (ppm) in the volcanic rocks of the Zharma-Saur zone are presented in App. 2, Table 2.1, 2.2 (all petrochemical oxide contents are recalculated on a dry-matter basis). The petrochemical investigation is based on 30 analyses, and the trace element composition was determined for 18 samples. The diagrams also incorporate compositional data for volcanic rocks from the southern extension of the Zharma-Saur zone (West Junggar), sourced from [Xu et al., 2022; Zhang et al., 2026], which were used for comparative interpretation.
Based on their SiO₂ content, which ranges from 46.58 to 74.54 wt. %, and their total Na2O+K2O content, ranging from 2.50 to 8.67 wt. %, the volcanic rocks are classified as basalts, basaltic andesites, trachybasalts, trachybasaltic andesites, rhyodacites, rhyolites, and trachyrhyolites (Fig. 5, a). The Nb/Y – Zr/TiO2 diagram, based on relatively immobile elements, classifies the rocks as basalts, andesites, and rhyodacites (Fig. 5, b). The K2O content of the rocks varies over a wide range from 0.07 to 3.65 wt. % (Fig. 5, c).
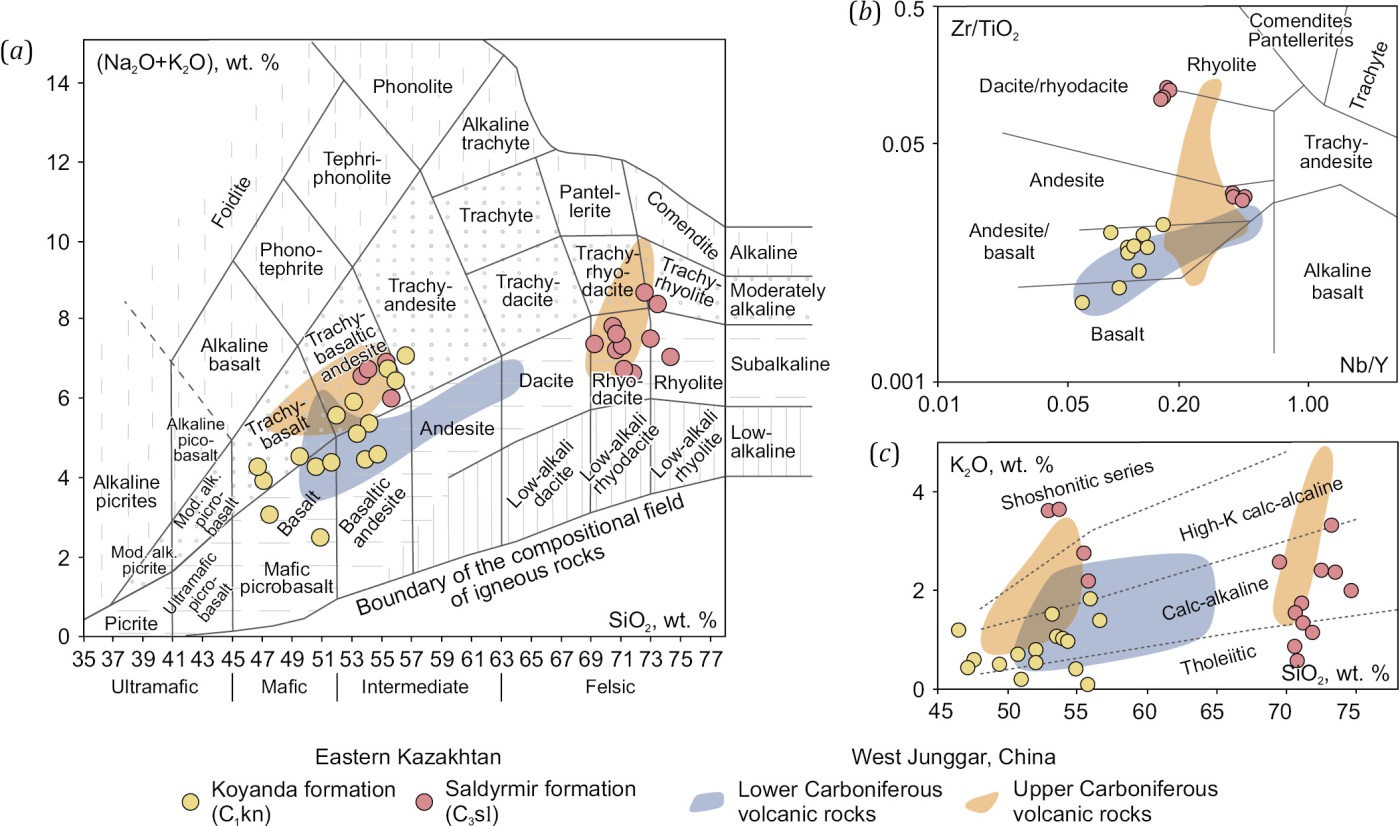
Fig. 5. Classification diagrams for composition of volcanic rocks from the Zharma-Saur zone.
(a) – SiO2 – total alkalis (Na2O+K2O) (after [Sharpenok et al., 2009]); (b) – Zr/TiO2 – Nb/Y (after [Winchester, Floyd, 1977]); (c) – SiO2 – K2O (after [Peccerillo, Taylor, 1976]). Composition of Carboniferous volcanic rocks from West Junggar (after [Xu et al., 2022; Zhang et al., 2026]).
Volcanic rocks of the Koyanda fm. have SiO2 concentrations ranging from 46.58 to 56.77 wt. % and are characterized by high Al2O3 contents (up to 20.55 wt. %) and moderate MgO levels (3.27 to 7.06 wt. %), with differentiated Mg# values (=Mg/[Mg+Fe²⁺]∙100) ranging from 36.55 to 58.20 and Fe2O3 contents between 7.18 and 13.09 wt. %. The total alkali content of some samples reaches 6.97 wt. %, thus locating them within the moderately alkaline field as trachybasalts, trachybasaltic andesites, and trachyandesites (Fig. 5, a), and their K2O content (0.07 to 1.78 wt. %) locates them within the low-K series (Fig. 5, c). These rocks also feature high CaO (4.06 to 11.21 wt. %), low to moderate P2O5 (0.11 to 0.27 wt. %), and TiO2 (0.63 to 1.30 wt. %) contents (App. 2, Table 2.1). The effusives of the Koyanda fm. exhibit petrochemical characteristics similar to those of the Lower Carboniferous volcanic rocks of West Junggar.
The pyroxene trachybasaltic andesites of the Saldyrmin fm. contain SiO2 ranging from 53.37 to 55.66 wt. %, exhibit moderately low Al2O3 contents of 14.97 to 15.87 wt. %, and elevated K2O from 2.20 to 3.65 wt. %, which classifies them as belonging to the high-K calc-alkaline or shoshonitic series (Fig. 5, c), and total alkali (Na2O+K2O) contents of 5.97 to 7.03 wt. % assign these rocks to moderately alkaline (Fig. 5, a). The rocks are also characterized by intermediate TiO2 (0.92–1.15 wt. %) and elevated P2O5 (0.33–0.67 wt. %) concentrations. Fe2O3 contents vary from 6.66 to 8.00 wt. %, MgO contents – from 6.05 to 6.23 wt. %, and with Mg# displays high values ranging from 60.39 to 65.48 (App. 2, Table 2.2). The rhyodacites of the Saldyrmin fm. have SiO2 contents of 69.33 to 74.54 wt. % and widely varying K2O (0.50–3.35 wt. %) and Na2O (4.14–6.96 wt. %) concentrations, thus falling within the rhyodacite, rhyolite, and trachyrhyolite fields on the TAS diagram (Fig. 5, a). These rocks display intermediate Al2O3 (11.53–14.45 wt. %) and low CaO (0.70–1.74 wt. %) and MgO (0.29–1.18 wt. %) contents (App. 2, Table 2.2). Geochemically, they are ferroan, with Fe*(=FeOt/[FeOt+MgO]) [Frost et al., 2001] ranging from 0.79 to 0.92 (Fig. 6), alkalic-calcic to calc-alkalic, with the Modified Alkali-Lime Index (MALI=Na2O+K2O–CaO) [Frost et al., 2001] ranging from 5.34 to 7.85 (Fig. 6), and metaluminous to weakly peraluminous, with the Aluminum Saturation Index (ASI=Al/(Ca–1.67P+Na+K), molar proportions) [Frost et al., 2001] ranging from 0.93 to 1.07 (Fig. 6).
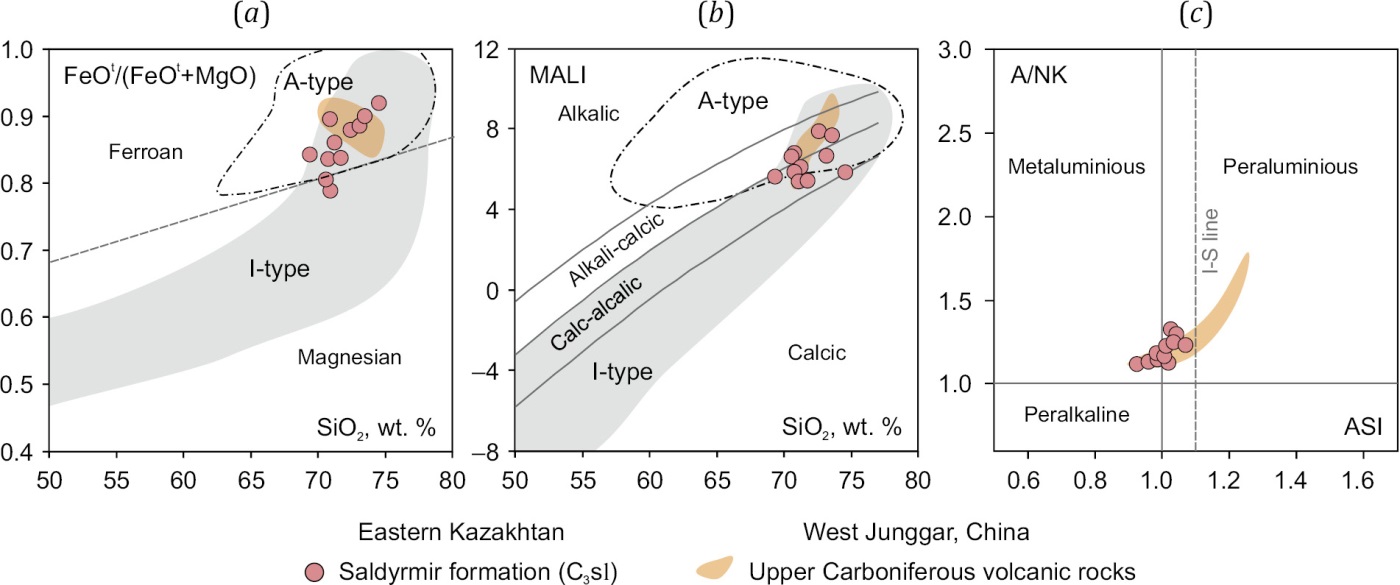
Fig. 6. Classification diagrams for felsic volcanic rocks from the Saldyrmin fm. (C3sl) after [Frost et al., 2001].
(a) – SiO2 – FeOt/(FeOt+MgO) – Fe-number (Fe*); (b) – SiO₂ – MALI (Modified Alkali-Lime Index); (c) – ASI (Aluminum Saturation Index) – A/NK. Fields for A- and I-type granitoids after [Frost et al., 2001]. Compositions of Carboniferous volcanic rocks from West Junggar (after [Xu et al., 2022; Zhang et al., 2026]).
The patterns of rare earth element (REE) distribution in the Koyanda fm. volcanic rocks exhibit a homogeneous, moderately fractionated character, with (La/Yb)n ratios ranging from 1.44 to 4.08 (Fig. 7). The heavy REE (HREE) segment shows no significant fractionation, as indicated by (Gd/Yb)ₙ ratios of 1.16 to 1.66, thus suggesting the absence of garnet in the restitic source. The volcanic rocks also display a weak negative Eu anomaly (Eu/Eu*=0.76–1.16), which implies that plagioclase plays an insignificant part in both partial melting and subsequent fractional crystallization processes. The total REE concentrations (ΣREE) are relatively low, varying from 37 to 87 ppm. The primitive mantle-normalized multi-element diagrams (Fig. 7) reveal consistent patterns across the sample suite, characterized by enrichment in large-ion lithophile elements (LILEs: Rb, Ba, K, Sr and Th), coupled with depletions in high-field-strength elements (HFSEs: Nb, Ta, Ti). All patterns exhibit a pronounced Ta-Nb trough, characteristic of magmas generated in suprasubduction zone settings. The Koyanda fm. effusives show a strong geochemical affinity, both in concentrations and REE pattern shapes, to the Early Carboniferous volcanic rocks of West Junggar (Fig. 7).
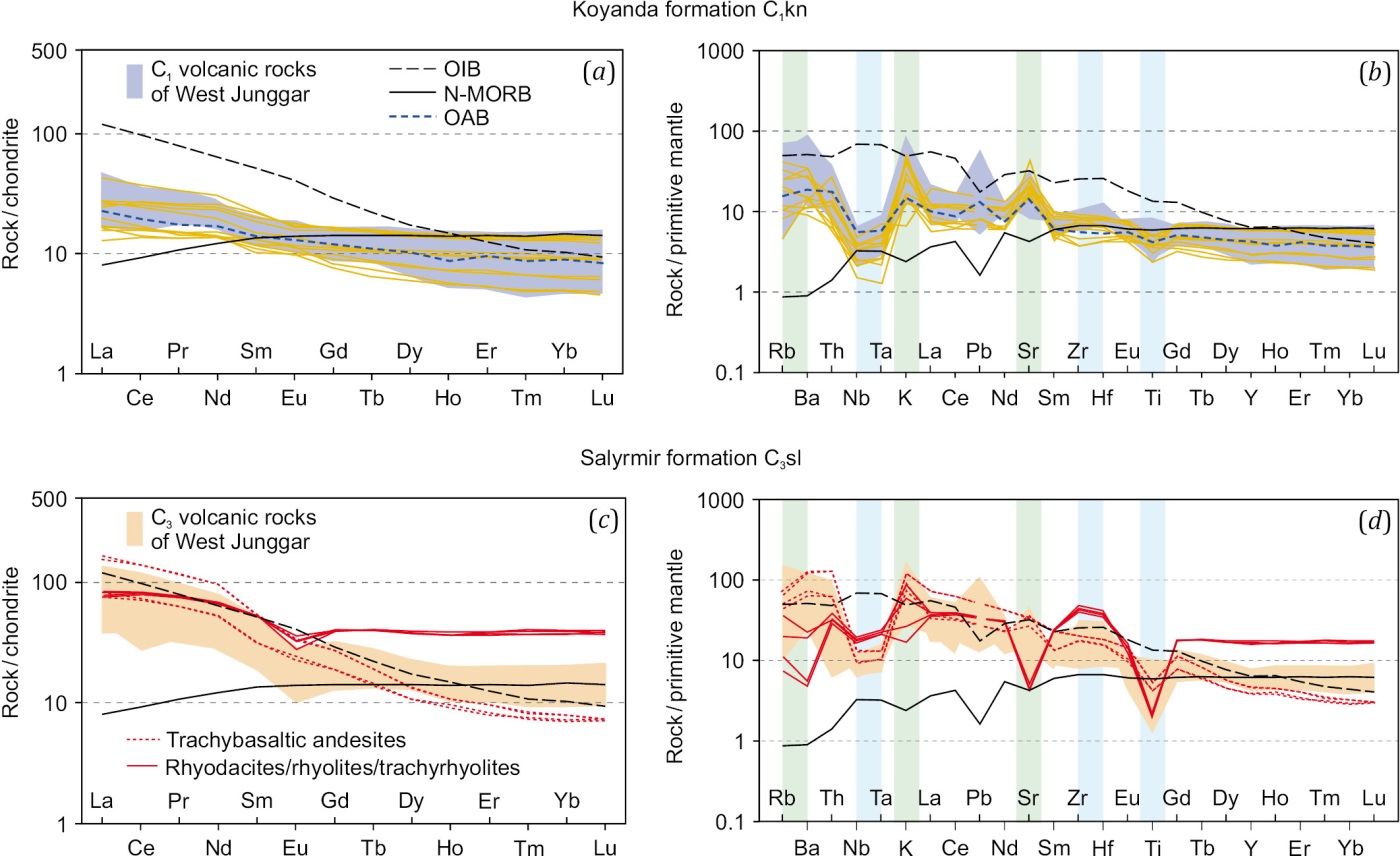
Fig. 7. Chondrite-normalized REE curves (a, c) and primitive mantle-normalized multi-element diagrams (b, d) for volcanic rocks of the Zharma-Saur zone.
Normalization values for chondrite (after [Boynton, 1984]) and for primitive mantle (after [Sun, McDonough, 1989]). OIB – ocean island basalts, N-MORB – normal mid-ocean ridge basalts (after [Sun, McDonough, 1989]); OAB – oceanic arc basalts (after [Kelemen et al., 2007]). Compositions of Carboniferous volcanic rocks from West Junggar (after [Xu et al., 2022; Zhang et al., 2026]).
The pyroxene trachybasaltic andesites of the Saldyrmin fm. exhibit fractionated REE patterns that are significantly enriched in light rare earth elements (LREEs), as reflected in high (La/Yb)n ratios ranging from 11.01 to 21.38. These rocks also display substantial HREE fractionation, with (Gd/Yb)n ratios of 2.66 to 3.47, indicating the presence of garnet in the restitic source. These rocks do not have a pronounced negative Eu anomaly (Eu/Eu* is 0.88 to 1.01). The pyroxene trachybasaltic andesites possess high ΣREE, varying from 138 to 261 ppm. Their primitive mantle-normalized multi-element patterns (Fig. 7) are generally similar to the previously described rocks, sharing a common set of negative (Nb, Ta, Ti) and positive (Ba, Rb, Th, K) anomalies. However, these rocks are notably characterized by elevated trace element abundances, comparable to enriched Ocean Island Basalts (OIB), which is particularly evident for high-field strength elements – Zr (194–225 ppm) and Hf (4.76–5.61 ppm), as well as Th (5.19–10.85 ppm). The rhyodacites are distinguished by high ΣREE (197–205 ppm), enrichment in Zr (441–534 ppm) and Y (72–79 ppm), but depletion in Th (2.41–3.26 ppm), U (0.82–1.20 ppm), Ce (65–68 ppm), Nb (11.69–13.75 ppm), and Sr (95–107 ppm). The patterns of REE distribution in these rocks (Fig. 7) are uniform and exhibit mild LREE enrichment relative to HREEs, with (La/Yb)n ratios of 2.02 to 2.25. No pronounced negative Eu anomaly is observed (Eu/Eu*=0.60–0.79). On the multi-element diagram (Fig. 7), the felsic volcanic rocks show general element enrichment except for Ba, Nb, Ta, Sr, and Ti.
The paleotectonic settings of the Zharma-Saur volcanic rocks (basalts, basaltic andesites, trachybasaltic andesites) were reconstructed using ternary discriminant diagrams (Fig. 8). The compositional data plotted for the majority of the rocks fall within the fields characteristic of island-arc tholeiites and calc-alkaline basalts, consistent with a suprasubduction zone environment. However, the Nb/Yb –Th/Yb diagram (Fig. 8, c) shows the compositional points of the pyroxene trachybasaltic andesites of the Saldyrmin fm. as falling within the field of oceanic island alkali basalts. This shift is primarily attributed to their elevated P2O5 (0.66–0.67 wt. %) concentrations at intermediate TiO2 (1.14–1.15 wt. %) levels. Nevertheless, other compositional features, such as high Th contents (~11 ppm), preclude their classification as genuine oceanic basalts. This geochemical signature points to the involvement of an enriched asthenospheric component in an extensional (likely post-collisional) tectonic regime rather than to an oceanic setting, with the continental crust in this region composed of volcanogenic-sedimentary sequences of island-arc affinity. Furthermore, the close spatial association of these mafic rocks with felsic effusives suggests significant crustal contamination of the magmatic melts. On binary variation diagrams, the volcanic rocks predominantly cluster within volcanic arc fields, characterized by elevated Th/Nb ratios (Fig. 9). On the Th/Yb vs. Nb/Yb diagram (Fig. 9, c), the pyroxene trachybasaltic andesites of the Saldyrmin fm. also deviate from the main data trend towards an enriched mantle source, exhibiting higher Nb concentrations.
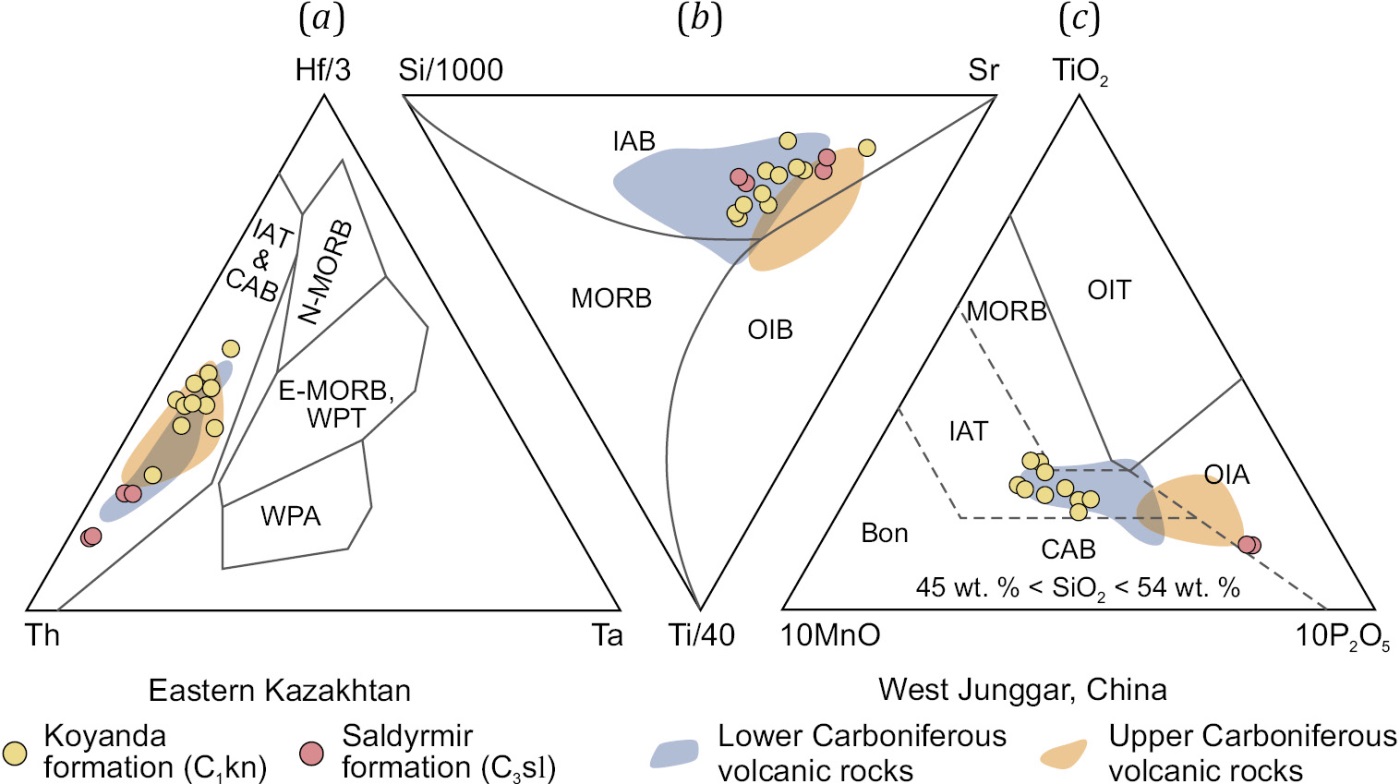
Fig. 8. Ternary discriminant diagrams for mafic-intermediate volcanic rocks of the Zharma-Saur zone.
(a) – Th – Hf/3 – Ta [Wood, 1980]; (b) – Si/1000 – Ti/40 – Sr [Vermeesch, 2006]; (c) – P2O5·10 – TiO2 – MnO·10 [Mullen, 1983]. Compositions of Carboniferous volcanic rocks from West Junggar after [Xu et al., 2022; Zhang et al., 2026]. Bon – boninites; OIA – oceanic island alkaline basalts; OIT – oceanic island tholeiites; IAT – island arc tholeiites; CAB – calc-alkaline basalts; MORB – mid-ocean ridge basalts; WPA – within-plate alkaline basalts; WPT – within-plate tholeiitic basalts; OIB – oceanic island basalts; IAB – island arc basalts.

Fig. 9. Binary discriminant diagrams for mafic-intermediate volcanic rocks of the Zharma-Saur zone.
(a) – TiO₂ – FeOt/MgO [Miyashiro, 1975]; (b) – Th/Yb – Nb/Yb [Pearce, 2008]; (c) – ThN – NbN [Saccani, 2015]. Compositions of Carboniferous volcanic rocks from West Junggar after [Xu et al., 2022; Zhang et al., 2026]. Bon – boninites; OIB – oceanic island basalts; OPB – oceanic plateau basalts; IAT – island arc tholeiites; CAB – calc-alkaline basalts; MORB – mid-ocean ridge basalts.
The felsic magmatic rocks of the Saldyrmin fm. are predominantly represented by rhyodacites, with less abundant rhyolites and trachyrhyolites (see Fig. 5). These felsic effusives are similar to I-type granitoids in key petrochemical indices for granitoids (Fe*, MALI, A/NK, and ASI), characteristic mineral assemblages, and trace element composition (see Fig. 6), [Clarke, 1992; Chappell, White, 2001; Frost et al., 2001]. Their formation is most likely associated with the partial melting of volcanic rocks of suprasubduction origin.
To further constrain the paleotectonic settings, crustal thickness estimates were obtained for the distinct volcanic stages within the Zharma-Saur zone (Fig. 10). For comparative analysis, estimates were also derived for Late Paleozoic effusives from the adjacent Char zone [Khromykh et al., 2020] and West Junggar [Xu et al., 2022; Zhang et al., 2026]. The depth to the Moho discontinuity was calculated using two independent empirical methods ("mohometers"). For mafic rocks, the calculation was made on the basis of the Ce/Y ratio from the empirical relationship obtained in [Mantle, Collins, 2008]. This method was applied to compositions with SiO2<55 wt. %, MgO>4 wt. %, and a loss on ignition (LOI) less than 4 %. For silicic rocks (SiO2>55 wt. %), the crustal thickness was estimated using the correlation between (La/Yb)n ratios and crustal thickness in modern suprasubduction zones obtained in [Hu et al., 2017]. The resulting estimates (Fig. 10) indicate that the volcanic rocks of the Koyanda fm. formed during an episode of magmatism at the base of a relatively thin, 13 to 24 km thick crust, with a mean value of 20 km. In contrast, the younger Saldyrmin fm. volcanic rocks were generated during melting of a 29 to 51 km thick crust (mean ~38 km). The thickness estimates derived from the felsic rocks are systematically lower than those obtained from the coeval mafic rocks, which may suggest that the felsic magmas were generated at shallower crustal levels. However, this specific pattern is not observed in the volcanic rocks of the adjacent Char zone.

Fig. 10. Comparison of crustal thickness estimates for different stages of the evolution of the Ob’-Zaisan folded area.
Crustal thickness was estimated using empirical relationships for mafic [Mantle, Collins, 2008] and intermediate-felsic rocks [Hu et al., 2017]. Green field is an interval of volcanic activity according to dating results for tuffaceous sandstones and volcanic rocks of the West Junggar [Xu et al., 2022; Zhang et al., 2026]; gray field is an interval of molasse formation [Zholtayev et al., 2021]. Data on orogenic volcanic rocks of the Char zone are from [Khromykh et al., 2020], data on volcanic rocks of the West Junggar are from [Xu et al., 2022; Zhang et al., 2026].
The crustal thickness estimates for the Zharma-Saur zone at the time of formation of the Saldyrmin fm. are consistent with those obtained for the Char zone and West Junggar. Fig. 10 presents a comparison of the crustal thickness estimates from volcanic rocks and volcanic eruption ages with the timing of Mississippian (Lower Carboniferous) molasse deposition (Taubinka and Bukon formations) in the Ob’-Zaisan folded area, and with the emplacement age of the Saur complex granitoids – the only intrusive rocks within the Zharma-Saur zone [Khromykh et al., 2019]. This correlation indicates that crustal thickening both in Zharma-Saur zone and Ob’-Zaisan folded area as a whole occurred between 330 and 320 Ma after cessation of subduction-related magmatism and was synchronous with molasse deposition, which can be explained by the crustal clustering as a result of collisional process. This interpretation is further supported by studies from the Chinese segment of the Zharma-Saur zone [Xu et al., 2022, 2023], which also reconstruct a significant increase in crustal thickness 330–320 Ma ago (Late Mississippian (late Early Carboniferous)). It is critical to note that subduction-related magmatism within the Zharma-Saur zone had ceased by the time of the Saur complex granitoid emplacement. Therefore, the intrusion of these plutons is associated with the early collisional stage in the region’s evolution (such as slab break-off) rather than with an active subduction phase.
In light of the foregoing evidence, the volcanic succession of the Koyanda fm. can be interpreted as a fragment of the Zharma-Saur arc structure. These are predominantly porphyritic and amygdaloidal rocks (see Fig. 4) varying in composition from basalts (the predominant type) to less abundant trachybasaltic andesites and trachyandesites (see Fig. 5). Geochemically, all rocks belong to the low-K series (see Fig. 5), exhibiting variable SiO2 (46.58–56.77 wt. %), elevated Al2O3 (up to 20.55 wt. %), and low to intermediate TiO2 (0.63–1.40 wt. %) contents. Their moderate LREE enrichment, unfractionated HREE patterns and pronounced enrichment in LILEs and Sr relative to HFSEs argue for a suprasubduction origin of the melts, generated under conditions of a relatively thin crust (<24 km).
The intermediate Saldyrmin fm. rocks (pyroxene trachybasaltic andesites) imply a continental post-collisional extensional setting. These rocks are characterized by elevated SiO2 (53.37–55.55 wt. %) and K2O (2.20–3.65 wt. %) contents (see Fig. 5), which likely reflect crustal contamination. The elevated P2O5 (0.33–0.67 wt. %) at intermediate TiO2 (0.92–1.15 wt. %) levels may also be indicative of the involvement of an enriched mantle component. The geochemical signature includes a short Ta-Nb trough, significant LREE enrichment and pronounced HREE fractionation, which may suggest the presence of garnet in the restite and imply deep melting depths (>29 km). Besides, these rocks are enriched in both LILE and HFSE elements (see Fig. 7). These trachybasaltic andesites therefore exhibit a hybrid geochemical affinity, combining features of an enriched asthenospheric source (elevated P2O5 and K2O, HREE fractionation indicative of a garnet-bearing residue, and significant LREE enrichment) with a clear subduction imprint (elevated SiO2, enrichment in Th and LILEs, and characteristic Ta-Nb and Ti anomalies). Consequently, the formation of these rocks is best explained by the generation of hybrid melts resulting from the interaction between an enriched mantle-derived component and a crustal substrate composed of suprasubduction lithologies.
Felsic volcanic rocks of varying composition – rhyodacites, rhyolites and trachyrhyolites – are sufficiently abundant within the Saldyrmin fm. section (see Fig. 4). These rocks form extensive lava flows and also constitute the matrix for tuff breccias. Petrographically, they exhibit a vitrophyric texture and fluidal structure, evidenced by the presence of large elongated chalcedony filled amygdules (see Fig. 4). The primary glass is devitrified, having recrystallized into a micropoikilitic texture that is characteristic of these rocks. The felsic volcanic rock of the Saldyrmin fm. correlate is their petrogeochemical parameters with I-type granitoids, which allows them to be interpreted as products of crustal melting that was likely triggered by the thermal input into the crustal substrate (mafic to intermediate suprasubduction rocks) during post-collisional extension.
The age of volcanism in the Zharma-Saur zone has been constrained using U-Pb geochronology of detrital zircons from tuffaceous sandstones and magmatic zircons from felsic volcanic rocks (see Fig. 2, 3). The results delineate two principal episodes of volcanic activity: Mississippian (Early Carboniferous) stage, associated with the subduction zone function, and Pennsylvanian (Late Carboniferous) post-collisional stage, identified for the first time within the Vorontsov-Saur segment of the Zharma-Saur zone.
An integrated petrological, geochemical, and geochronological study of volcanic rocks within the Vorontsov-Saur segment of the Zharma-Saur zone yields the following principal conclusions:
The authors are deeply grateful to E.I. Mikheev, A.S. Volosov and M.D. Tsareva for their invaluable assistance during the field expedition; N.G. Karmanova, I.V. Nikolaeva, and M.V. Khlestov for conducting the analytical studies of rock and mineral compositions. The authors are also indebted to reviewers A.S. Mekhonoshin and A.A. Tretyakov, whose insightful comments and suggestions significantly improved the manuscript.
All authors made an equivalent contribution to this article, read and approved the final manuscript.
The authors declare that they have no conflicts of interest relevant to this manuscript.
Table 1.1. Results of U-Pb LA-ICP-MS dating of zircons from volcanic rocks of the Saldyrmin fm., Zharma-Saur zone
|
Measurement number |
Isotopic ratios |
D*, % |
Isotopic age, Ma |
||||||||||
|
²⁰⁷Pb/²³⁵U |
2σ |
²⁰⁶Pb/²³⁸U |
2σ |
Rho |
²⁰⁷Pb/²⁰⁶Pb |
2σ |
Th/U |
²⁰⁷Pb/²³⁵U |
2σ |
²⁰⁶Pb/²³⁸U |
2σ |
||
|
Sample К23-234 – rhyodacite from a lava flow; 48°32'29.12" N, 82°00'23.17" E |
|||||||||||||
|
1.234 |
0.353 |
0.063 |
0.0488 |
0.0023 |
–0.0408 |
0.0590 |
0.0110 |
0.95 |
0 |
307.0 |
46.3 |
307.2 |
13.9 |
|
2.234 |
0.339 |
0.045 |
0.0470 |
0.0019 |
0.1857 |
0.0548 |
0.0072 |
1.38 |
0 |
296.4 |
33.4 |
296.1 |
11.5 |
|
3.234 |
0.351 |
0.051 |
0.0489 |
0.0019 |
0.0327 |
0.0543 |
0.0081 |
0.85 |
–1 |
305.5 |
37.6 |
307.8 |
11.4 |
|
4.234 |
0.346 |
0.076 |
0.0476 |
0.0021 |
0.3030 |
0.0570 |
0.0120 |
0.86 |
1 |
301.7 |
56.2 |
299.8 |
12.7 |
|
5.234 |
0.356 |
0.054 |
0.0494 |
0.0018 |
0.0684 |
0.0534 |
0.0082 |
1.13 |
–1 |
309.2 |
39.6 |
310.8 |
10.8 |
|
6.234 |
0.341 |
0.075 |
0.0485 |
0.0024 |
0.1113 |
0.0500 |
0.0110 |
1.05 |
–2 |
297.9 |
55.7 |
305.3 |
14.5 |
|
7.234 |
0.352 |
0.080 |
0.0493 |
0.0020 |
0.2124 |
0.0540 |
0.0120 |
1.34 |
–1 |
306.2 |
58.9 |
310.2 |
12.0 |
|
8.234 |
0.356 |
0.054 |
0.0488 |
0.0020 |
0.1959 |
0.0543 |
0.0081 |
1.04 |
1 |
309.2 |
39.6 |
307.2 |
12.0 |
|
9.234 |
0.457 |
0.079 |
0.0503 |
0.0025 |
0.0705 |
0.0680 |
0.0120 |
0.07 |
21 |
382.2 |
54.0 |
316.4 |
15.0 |
|
10.234 |
0.357 |
0.049 |
0.0491 |
0.0020 |
0.2372 |
0.0524 |
0.0070 |
1.16 |
0 |
310.0 |
35.9 |
309.0 |
12.0 |
|
11.234 |
0.357 |
0.064 |
0.0486 |
0.0026 |
0.0125 |
0.0590 |
0.0110 |
0.99 |
1 |
310.0 |
46.9 |
305.9 |
15.7 |
|
12.234 |
0.352 |
0.057 |
0.0483 |
0.0020 |
–0.2119 |
0.0570 |
0.0100 |
1.45 |
1 |
306.2 |
42.0 |
304.1 |
12.1 |
|
13.234 |
0.352 |
0.032 |
0.0486 |
0.0012 |
0.4710 |
0.0523 |
0.0043 |
1.00 |
0 |
306.2 |
23.6 |
305.9 |
7.2 |
|
14.234 |
0.424 |
0.031 |
0.0496 |
0.0016 |
0.1739 |
0.0630 |
0.0047 |
0.34 |
15 |
358.9 |
21.7 |
312.1 |
9.6 |
|
15.234 |
0.339 |
0.058 |
0.0475 |
0.0020 |
0.2116 |
0.0508 |
0.0085 |
1.31 |
–1 |
296.4 |
43.1 |
299.2 |
12.1 |
|
16.234 |
0.339 |
0.047 |
0.0468 |
0.0020 |
0.0601 |
0.0561 |
0.0080 |
1.00 |
1 |
296.4 |
34.9 |
294.8 |
12.1 |
|
17.234 |
0.338 |
0.049 |
0.0470 |
0.0019 |
0.1122 |
0.0534 |
0.0078 |
1.06 |
0 |
295.7 |
36.4 |
296.1 |
11.5 |
|
18.234 |
0.329 |
0.069 |
0.0477 |
0.0029 |
0.1318 |
0.0570 |
0.0120 |
1.06 |
–4 |
288.8 |
51.7 |
300.4 |
17.5 |
|
19.234 |
0.341 |
0.052 |
0.0474 |
0.0021 |
0.1337 |
0.0549 |
0.0084 |
1.27 |
0 |
297.9 |
38.6 |
298.5 |
12.7 |
|
20.234 |
0.251 |
0.078 |
0.0453 |
0.0024 |
–0.3564 |
0.0450 |
0.0150 |
1.02 |
–20 |
227.4 |
62.0 |
285.6 |
14.5 |
|
21.234 |
0.344 |
0.069 |
0.0470 |
0.0025 |
0.0734 |
0.0540 |
0.0110 |
0.86 |
1 |
300.2 |
51.1 |
296.1 |
15.1 |
|
22.234 |
0.358 |
0.058 |
0.0482 |
0.0019 |
0.0754 |
0.0586 |
0.0096 |
1.14 |
2 |
310.7 |
42.5 |
303.5 |
11.5 |
|
23.234 |
0.364 |
0.076 |
0.0472 |
0.0021 |
0.0084 |
0.0610 |
0.0130 |
1.22 |
6 |
315.2 |
55.4 |
297.3 |
12.7 |
|
24.234 |
0.355 |
0.045 |
0.0486 |
0.0018 |
0.1745 |
0.0533 |
0.0067 |
0.82 |
1 |
308.5 |
33.0 |
305.9 |
10.8 |
|
25.234 |
0.333 |
0.050 |
0.0472 |
0.0020 |
0.2597 |
0.0524 |
0.0076 |
1.37 |
–2 |
291.9 |
37.3 |
297.3 |
12.1 |
|
26.234 |
0.348 |
0.044 |
0.0478 |
0.0015 |
0.1471 |
0.0525 |
0.0066 |
1.07 |
1 |
303.2 |
32.5 |
301.0 |
9.0 |
|
27.234 |
0.347 |
0.044 |
0.0478 |
0.0016 |
0.0422 |
0.0524 |
0.0068 |
1.45 |
0 |
302.5 |
32.5 |
301.0 |
9.6 |
|
28.234 |
0.341 |
0.063 |
0.0472 |
0.0022 |
0.2973 |
0.0487 |
0.0086 |
1.32 |
0 |
297.9 |
46.7 |
297.3 |
13.3 |
|
29.234 |
0.342 |
0.058 |
0.0479 |
0.0021 |
0.1816 |
0.0544 |
0.0091 |
1.29 |
–1 |
298.7 |
43.0 |
301.6 |
12.7 |
|
30.234 |
0.340 |
0.036 |
0.0474 |
0.0014 |
0.4190 |
0.0514 |
0.0050 |
0.92 |
0 |
297.2 |
26.7 |
298.5 |
8.4 |
|
31.234 |
0.347 |
0.052 |
0.0481 |
0.0019 |
–0.3089 |
0.0535 |
0.0089 |
1.10 |
0 |
302.5 |
38.4 |
302.8 |
11.5 |
|
32.234 |
0.342 |
0.052 |
0.0478 |
0.0019 |
0.1934 |
0.0535 |
0.0080 |
1.00 |
–1 |
298.7 |
38.6 |
301.0 |
11.5 |
|
33.234 |
0.344 |
0.084 |
0.0474 |
0.0025 |
0.1609 |
0.0580 |
0.0140 |
0.82 |
1 |
300.2 |
62.2 |
298.5 |
15.1 |
|
34.234 |
0.352 |
0.031 |
0.0484 |
0.0013 |
0.2524 |
0.0539 |
0.0046 |
0.88 |
1 |
306.2 |
22.8 |
304.7 |
7.8 |
|
35.234 |
0.348 |
0.055 |
0.0482 |
0.0021 |
0.1936 |
0.0527 |
0.0082 |
0.78 |
0 |
303.2 |
40.6 |
303.5 |
12.7 |
|
36.234 |
0.421 |
0.034 |
0.0468 |
0.0013 |
0.2099 |
0.0665 |
0.0053 |
0.92 |
21 |
356.8 |
23.8 |
294.8 |
7.8 |
|
37.234 |
0.340 |
0.033 |
0.0482 |
0.0015 |
0.1456 |
0.0523 |
0.0051 |
0.96 |
–2 |
297.2 |
24.5 |
303.5 |
9.0 |
|
38.234 |
0.408 |
0.052 |
0.0479 |
0.0020 |
0.1293 |
0.0644 |
0.0083 |
1.00 |
15 |
347.4 |
36.7 |
301.6 |
12.1 |
|
Sample K23–248 – rhyodacite from a lava flow; 48°34'09.43" N, 81°58'10.64" E |
|||||||||||||
|
1.248 |
0.342 |
0.042 |
0.0474 |
0.0017 |
0.3138 |
0.0523 |
0.0061 |
0.69 |
0 |
298.7 |
31.1 |
298.5 |
10.3 |
|
2.248 |
0.416 |
0.040 |
0.0488 |
0.0013 |
–0.1051 |
0.0615 |
0.0063 |
1.06 |
15 |
353.2 |
28.1 |
307.2 |
7.8 |
|
3.248 |
0.358 |
0.074 |
0.0479 |
0.0025 |
0.2899 |
0.0495 |
0.0098 |
1.36 |
3 |
310.7 |
54.2 |
301.6 |
15.1 |
|
4.248 |
0.340 |
0.035 |
0.0467 |
0.0013 |
0.1102 |
0.0550 |
0.0057 |
0.90 |
1 |
297.2 |
26.0 |
294.2 |
7.8 |
|
5.248 |
0.347 |
0.050 |
0.0477 |
0.0016 |
0.2514 |
0.0509 |
0.0071 |
1.14 |
1 |
302.5 |
36.9 |
300.4 |
9.6 |
|
6.248 |
0.437 |
0.075 |
0.0456 |
0.0021 |
0.0452 |
0.0740 |
0.0130 |
1.05 |
28 |
368.1 |
51.9 |
287.5 |
12.7 |
|
7.248 |
0.328 |
0.078 |
0.0473 |
0.0023 |
–0.1550 |
0.0480 |
0.0120 |
1.02 |
–3 |
288.0 |
58.4 |
297.9 |
13.9 |
|
8.248 |
0.355 |
0.064 |
0.0474 |
0.0018 |
0.1501 |
0.0532 |
0.0095 |
1.38 |
3 |
308.5 |
47.0 |
298.5 |
10.9 |
|
9.248 |
0.346 |
0.043 |
0.0479 |
0.0017 |
–0.0374 |
0.0544 |
0.0071 |
1.28 |
0 |
301.7 |
31.8 |
301.6 |
10.2 |
|
10.248 |
0.351 |
0.061 |
0.0484 |
0.0019 |
–0.0106 |
0.0560 |
0.0100 |
1.30 |
0 |
305.5 |
44.9 |
304.7 |
11.4 |
|
11.248 |
0.348 |
0.039 |
0.0479 |
0.0016 |
–0.0153 |
0.0545 |
0.0064 |
1.56 |
1 |
303.2 |
28.8 |
301.6 |
9.6 |
|
12.248 |
0.345 |
0.028 |
0.0477 |
0.0014 |
0.0431 |
0.0517 |
0.0044 |
0.99 |
0 |
301.0 |
20.7 |
300.4 |
8.4 |
|
13.248 |
0.351 |
0.049 |
0.0487 |
0.0019 |
0.0268 |
0.0528 |
0.0076 |
1.14 |
0 |
305.5 |
36.1 |
306.5 |
11.4 |
|
14.248 |
0.349 |
0.049 |
0.0475 |
0.0017 |
0.0654 |
0.0568 |
0.0081 |
0.92 |
2 |
304.0 |
36.1 |
299.2 |
10.3 |
|
15.248 |
0.360 |
0.061 |
0.0489 |
0.0024 |
0.3586 |
0.0517 |
0.0082 |
0.73 |
1 |
312.2 |
44.6 |
307.8 |
14.5 |
|
16.248 |
0.347 |
0.084 |
0.0477 |
0.0026 |
0.1995 |
0.0590 |
0.0140 |
1.10 |
1 |
302.5 |
62.1 |
300.4 |
15.7 |
|
17.248 |
0.347 |
0.033 |
0.0480 |
0.0015 |
–0.0710 |
0.0548 |
0.0056 |
0.82 |
0 |
302.5 |
24.4 |
302.2 |
9.0 |
|
18.248 |
0.347 |
0.039 |
0.0487 |
0.0018 |
0.1705 |
0.0526 |
0.0059 |
0.95 |
–1 |
302.5 |
28.8 |
306.5 |
10.8 |
|
19.248 |
0.473 |
0.054 |
0.0493 |
0.0018 |
0.4751 |
0.0696 |
0.0071 |
1.55 |
27 |
393.3 |
36.5 |
310.2 |
10.8 |
|
20.248 |
0.319 |
0.055 |
0.0468 |
0.0023 |
0.1785 |
0.0504 |
0.0086 |
1.09 |
–5 |
281.1 |
41.5 |
294.8 |
13.9 |
|
21.248 |
0.354 |
0.051 |
0.0481 |
0.0017 |
0.2099 |
0.0525 |
0.0074 |
1.29 |
2 |
307.7 |
37.5 |
302.8 |
10.2 |
|
22.248 |
0.360 |
0.063 |
0.0473 |
0.0025 |
–0.6487 |
0.0610 |
0.0130 |
0.84 |
5 |
312.2 |
46.1 |
297.9 |
15.1 |
|
23.248 |
0.354 |
0.077 |
0.0484 |
0.0025 |
0.1058 |
0.0550 |
0.0120 |
0.89 |
1 |
307.7 |
56.6 |
304.7 |
15.1 |
|
24.248 |
0.351 |
0.050 |
0.0484 |
0.0020 |
0.0421 |
0.0566 |
0.0083 |
0.87 |
0 |
305.5 |
36.8 |
304.7 |
12.1 |
|
25.248 |
0.345 |
0.047 |
0.0482 |
0.0020 |
–0.1261 |
0.0543 |
0.0080 |
1.08 |
–1 |
301.0 |
34.8 |
303.5 |
12.1 |
|
26.248 |
0.329 |
0.080 |
0.0477 |
0.0020 |
0.0446 |
0.0490 |
0.0120 |
0.74 |
–4 |
288.8 |
59.9 |
300.4 |
12.1 |
|
27.248 |
0.554 |
0.052 |
0.0514 |
0.0017 |
0.1105 |
0.0802 |
0.0077 |
1.05 |
39 |
447.6 |
33.3 |
323.1 |
10.2 |
|
28.248 |
0.303 |
0.073 |
0.0462 |
0.0024 |
0.0307 |
0.0490 |
0.0120 |
0.92 |
–8 |
268.7 |
55.7 |
291.1 |
14.5 |
|
29.248 |
0.325 |
0.070 |
0.0502 |
0.0030 |
0.2675 |
0.0530 |
0.0110 |
0.75 |
–10 |
285.7 |
52.6 |
315.7 |
18.0 |
|
30.248 |
0.369 |
0.090 |
0.0484 |
0.0032 |
–0.1834 |
0.0530 |
0.0140 |
1.15 |
5 |
318.9 |
65.4 |
304.7 |
19.3 |
|
31.248 |
0.361 |
0.066 |
0.0492 |
0.0022 |
0.0080 |
0.0511 |
0.0096 |
1.18 |
1 |
313.0 |
48.3 |
309.6 |
13.2 |
|
32.248 |
0.355 |
0.058 |
0.0493 |
0.0021 |
0.1195 |
0.0531 |
0.0087 |
1.30 |
–1 |
308.5 |
42.6 |
310.2 |
12.6 |
|
33.248 |
0.347 |
0.026 |
0.0485 |
0.0014 |
0.0277 |
0.0528 |
0.0042 |
0.72 |
–1 |
302.5 |
19.2 |
305.3 |
8.4 |
|
34.248 |
0.339 |
0.053 |
0.0478 |
0.0019 |
–0.1157 |
0.0525 |
0.0087 |
1.07 |
–2 |
296.4 |
39.4 |
301.0 |
11.5 |
|
35.248 |
0.340 |
0.036 |
0.0491 |
0.0013 |
0.2890 |
0.0483 |
0.0049 |
0.88 |
–4 |
297.2 |
26.7 |
309.0 |
7.8 |
|
36.248 |
0.339 |
0.054 |
0.0479 |
0.0021 |
0.3985 |
0.0502 |
0.0074 |
0.75 |
–2 |
296.4 |
40.1 |
301.6 |
12.7 |
|
37.248 |
0.352 |
0.037 |
0.0488 |
0.0013 |
0.1285 |
0.0533 |
0.0056 |
0.96 |
0 |
306.2 |
27.2 |
307.2 |
7.8 |
|
38.248 |
0.359 |
0.033 |
0.0492 |
0.0016 |
0.0531 |
0.0532 |
0.0051 |
0.87 |
1 |
311.5 |
24.2 |
309.6 |
9.6 |
|
39.248 |
0.363 |
0.067 |
0.0481 |
0.0023 |
0.0041 |
0.0630 |
0.0120 |
0.83 |
4 |
314.5 |
48.9 |
302.8 |
13.9 |
|
40.248 |
0.356 |
0.076 |
0.0488 |
0.0023 |
0.1515 |
0.0520 |
0.0110 |
1.07 |
1 |
309.2 |
55.8 |
307.2 |
13.9 |
Table 2.1. Major element oxides (wt. %) and trace elements (ppm) in volcanic rocks of the Koyanda fm., Zharma-Saur zone
|
Sample |
Zh19-69 |
K22-27/1 |
K22-30 |
K22-38 |
K22-82 |
K22-86 |
K22-87 |
K23-247 |
K23-270 |
K23-281 |
K23-284 |
K23-285 |
K23-287 |
K23-288 |
K23-289 |
K23-292 |
|
SiO2 |
44.87 |
46.34 |
51.97 |
49.08 |
54.09 |
55.20 |
53.79 |
52.51 |
51.29 |
49.64 |
45.91 |
52.13 |
53.65 |
50.87 |
50.91 |
47.89 |
|
TiO2 |
1.25 |
1.07 |
0.60 |
0.86 |
1.37 |
0.68 |
0.71 |
0.74 |
0.81 |
1.01 |
1.09 |
1.01 |
0.78 |
1.05 |
1.02 |
1.04 |
|
Al2O3 |
19.00 |
17.49 |
18.20 |
15.96 |
14.47 |
18.32 |
18.15 |
18.41 |
18.46 |
19.29 |
20.03 |
17.19 |
19.10 |
19.31 |
19.17 |
17.55 |
|
Fe2O3* |
11.51 |
12.77 |
8.37 |
10.31 |
12.84 |
6.98 |
7.34 |
8.11 |
8.43 |
10.60 |
11.46 |
9.60 |
8.71 |
9.08 |
8.89 |
11.20 |
|
MnO |
0.18 |
0.21 |
0.17 |
0.18 |
0.21 |
0.12 |
0.12 |
0.13 |
0.14 |
0.20 |
0.16 |
0.16 |
0.15 |
0.20 |
0.19 |
0.21 |
|
MgO |
5.54 |
5.55 |
4.02 |
6.80 |
3.74 |
4.35 |
5.16 |
4.36 |
4.91 |
4.47 |
5.34 |
4.64 |
3.28 |
3.60 |
3.21 |
5.23 |
|
CaO |
9.57 |
10.93 |
8.17 |
10.41 |
3.96 |
4.60 |
4.55 |
7.34 |
6.86 |
8.24 |
9.46 |
7.34 |
7.27 |
8.04 |
10.04 |
9.16 |
|
Na2O |
2.95 |
2.41 |
3.37 |
2.21 |
6.54 |
5.45 |
4.51 |
4.32 |
4.24 |
3.44 |
3.38 |
4.01 |
4.20 |
4.72 |
3.82 |
4.00 |
|
K2O |
1.17 |
0.55 |
0.92 |
0.19 |
0.07 |
1.33 |
1.71 |
0.88 |
1.48 |
0.67 |
0.44 |
1.01 |
0.37 |
0.74 |
0.49 |
0.45 |
|
P2O5 |
0.13 |
0.13 |
0.15 |
0.19 |
0.15 |
0.12 |
0.11 |
0.13 |
0.12 |
0.15 |
0.10 |
0.12 |
0.26 |
0.20 |
0.20 |
0.12 |
|
ппп |
3.80 |
2.31 |
3.24 |
3.23 |
1.81 |
2.83 |
3.11 |
2.67 |
2.95 |
2.27 |
2.60 |
2.77 |
1.78 |
1.68 |
1.40 |
2.62 |
|
Сумма |
100.12 |
99.85 |
99.31 |
99.56 |
99.34 |
100.06 |
99.35 |
99.67 |
99.79 |
100.08 |
100.07 |
100.07 |
99.59 |
99.56 |
99.42 |
99.62 |
|
Mg# |
48.82 |
46.24 |
48.76 |
56.64 |
36.55 |
55.24 |
58.20 |
51.57 |
53.58 |
45.50 |
47.98 |
48.93 |
42.72 |
44.00 |
41.66 |
48.04 |
|
Rb |
26.00 |
9.34 |
– |
2.91 |
– |
15.96 |
– |
11.48 |
15.87 |
– |
6.65 |
– |
5.14 |
12.96 |
7.46 |
6.62 |
|
Sr |
900 |
315 |
– |
571 |
– |
514.81 |
– |
348 |
361 |
– |
401 |
– |
440 |
359 |
413 |
321 |
|
Y |
13.00 |
21.15 |
– |
26.73 |
– |
11.18 |
– |
11.22 |
13.54 |
– |
17.62 |
– |
27.88 |
27.03 |
26.01 |
18.46 |
|
Zr |
42 |
69 |
– |
103 |
– |
93 |
– |
70 |
77 |
– |
41 |
– |
94 |
93 |
87 |
51 |
|
Nb |
2.40 |
2.52 |
– |
3.37 |
– |
1.82 |
– |
1.51 |
1.52 |
– |
1.06 |
– |
2.37 |
2.87 |
2.74 |
1.73 |
|
Cs |
– |
0.44 |
– |
0.72 |
– |
0.15 |
– |
0.12 |
0.18 |
– |
1.60 |
– |
0.56 |
0.64 |
0.68 |
0.35 |
|
Ba |
240 |
81 |
– |
98 |
– |
241 |
– |
108 |
195 |
– |
99 |
– |
80 |
102 |
78 |
63 |
|
La |
5.00 |
9.09 |
– |
13.14 |
– |
5.95 |
– |
5.01 |
5.15 |
– |
3.88 |
– |
7.38 |
8.34 |
7.87 |
4.75 |
|
Ce |
11.00 |
22.41 |
– |
29.99 |
– |
13.29 |
– |
12.69 |
12.82 |
– |
10.76 |
– |
21.67 |
21.32 |
20.12 |
12.38 |
|
Pr |
1.60 |
3.19 |
– |
4.03 |
– |
1.70 |
– |
1.81 |
1.77 |
– |
1.60 |
– |
3.10 |
2.99 |
2.83 |
1.77 |
|
Nd |
8.00 |
14.33 |
– |
17.96 |
– |
8.21 |
– |
8.27 |
8.29 |
– |
8.07 |
– |
15.33 |
14.24 |
13.73 |
8.83 |
|
Sm |
2.10 |
3.56 |
– |
4.34 |
– |
1.94 |
– |
2.26 |
2.22 |
– |
2.52 |
– |
4.17 |
3.80 |
3.53 |
2.46 |
|
Eu |
0.70 |
0.86 |
– |
1.19 |
– |
0.71 |
– |
0.82 |
0.74 |
– |
0.80 |
– |
1.22 |
1.28 |
1.13 |
0.84 |
|
Gd |
2.50 |
3.39 |
– |
4.22 |
– |
1.92 |
– |
2.07 |
2.28 |
– |
2.71 |
– |
4.15 |
4.07 |
3.93 |
2.81 |
|
Tb |
0.40 |
0.58 |
– |
0.70 |
– |
0.30 |
– |
0.34 |
0.39 |
– |
0.47 |
– |
0.74 |
0.73 |
0.70 |
0.48 |
|
Dy |
2.50 |
3.62 |
– |
4.38 |
– |
1.87 |
– |
2.03 |
2.41 |
– |
3.15 |
– |
4.69 |
4.55 |
4.44 |
3.16 |
|
Ho |
0.50 |
0.76 |
– |
0.95 |
– |
0.38 |
– |
0.40 |
0.51 |
– |
0.66 |
– |
1.02 |
1.02 |
0.94 |
0.68 |
|
Er |
1.40 |
2.07 |
– |
2.73 |
– |
1.08 |
– |
1.08 |
1.48 |
– |
1.89 |
– |
2.97 |
2.84 |
2.65 |
1.93 |
|
Tm |
0.21 |
0.31 |
– |
0.41 |
– |
0.15 |
– |
0.16 |
0.21 |
– |
0.29 |
– |
0.44 |
0.43 |
0.42 |
0.29 |
|
Yb |
1.30 |
1.90 |
– |
2.60 |
– |
0.98 |
– |
1.00 |
1.26 |
– |
1.82 |
– |
2.88 |
2.77 |
2.70 |
1.86 |
|
Lu |
0.20 |
0.28 |
– |
0.39 |
– |
0.14 |
– |
0.15 |
0.19 |
– |
0.28 |
– |
0.43 |
0.43 |
0.41 |
0.28 |
|
Hf |
1.30 |
1.98 |
– |
2.69 |
– |
1.99 |
– |
1.82 |
1.94 |
– |
1.32 |
– |
2.57 |
2.51 |
2.40 |
1.47 |
|
Ta |
0.17 |
0.15 |
– |
0.29 |
– |
0.09 |
– |
0.11 |
0.11 |
– |
0.05 |
– |
0.15 |
0.16 |
0.21 |
0.11 |
|
Pb |
1.50 |
– |
– |
– |
– |
1.47 |
– |
– |
– |
– |
– |
– |
– |
– |
– |
– |
|
Th |
0.62 |
1.03 |
– |
2.29 |
– |
0.76 |
– |
0.48 |
0.66 |
– |
0.59 |
– |
1.15 |
1.09 |
1.00 |
0.54 |
|
U |
0.18 |
0.30 |
– |
0.69 |
– |
0.47 |
– |
0.19 |
0.25 |
– |
0.19 |
– |
0.42 |
0.38 |
0.37 |
0.25 |
|
Ti |
5000 |
– |
– |
– |
– |
3050 |
– |
– |
– |
– |
– |
– |
– |
– |
– |
– |
|
(La/Yb)n |
2.59 |
3.22 |
– |
3.41 |
– |
4.08 |
– |
3.36 |
2.76 |
– |
1.44 |
– |
1.73 |
2.03 |
1.97 |
1.72 |
|
(Gd/Yb)n |
1.55 |
1.44 |
– |
1.31 |
– |
1.58 |
– |
1.66 |
1.46 |
– |
1.20 |
– |
1.16 |
1.19 |
1.17 |
1.22 |
|
Eu/Eu* |
0.93 |
0.76 |
– |
0.85 |
– |
1.13 |
– |
1.16 |
1.01 |
– |
0.94 |
– |
0.90 |
1.00 |
0.93 |
0.97 |
|
ΣREE |
37.41 |
66.35 |
– |
87.01 |
– |
38.63 |
– |
38.08 |
39.72 |
– |
38.90 |
– |
70.20 |
68.80 |
65.40 |
42.52 |
Note. Dash – no data. Mg#=Mg/[Mg+Fe²⁺]100; (La/Yb)n and (Gd/Yb)n – chondrite-normalized ratios [Boynton, 1984]; Eu/Eu*=EuN/[(SmN)(GdN)]1/2.
Table 2.2. Major element oxides (wt. %) and trace elements (ppm) in volcanic rocks of the Saldyrmin fm., Zharma-Saur zone
|
Sample |
K23-236 |
K23-237 |
К23-256 |
К23-257 |
K22-106 |
K22-106/1 |
K23-233 |
K23-234 |
K23-238 |
K23-240 |
K23-248 |
K23-252 |
K23-255 |
K23-258 |
K23-275 |
|
SiO2 |
54.34 |
54.73 |
51.49 |
51.27 |
71.54 |
72.81 |
70.12 |
69.70 |
69.83 |
69.98 |
68.21 |
73.85 |
72.53 |
70.77 |
69.90 |
|
TiO2 |
0.90 |
0.90 |
1.10 |
1.11 |
0.21 |
0.21 |
0.50 |
0.42 |
0.43 |
0.44 |
0.46 |
0.38 |
0.41 |
0.62 |
0.42 |
|
Al2O3 |
15.55 |
15.52 |
14.51 |
14.38 |
14.25 |
13.68 |
13.22 |
13.82 |
13.22 |
13.59 |
13.82 |
11.42 |
12.59 |
12.62 |
13.34 |
|
Fe2O3* |
6.53 |
7.04 |
7.54 |
7.69 |
2.79 |
2.88 |
5.57 |
4.72 |
5.59 |
5.58 |
5.74 |
4.75 |
4.49 |
5.52 |
4.81 |
|
MnO |
0.14 |
0.12 |
0.13 |
0.14 |
0.06 |
0.05 |
0.09 |
0.07 |
0.11 |
0.07 |
0.18 |
0.10 |
0.12 |
0.10 |
0.10 |
|
MgO |
6.25 |
6.19 |
5.80 |
5.96 |
0.35 |
0.29 |
0.79 |
1.04 |
0.98 |
0.57 |
0.94 |
0.35 |
0.51 |
0.94 |
1.16 |
|
CaO |
7.07 |
7.45 |
7.71 |
7.91 |
0.80 |
0.69 |
1.41 |
1.27 |
1.03 |
1.36 |
1.71 |
1.19 |
0.85 |
1.23 |
1.31 |
|
Na2O |
4.03 |
3.71 |
3.27 |
3.14 |
6.14 |
5.89 |
5.35 |
6.88 |
6.00 |
6.61 |
4.67 |
4.91 |
4.10 |
5.39 |
5.47 |
|
K2O |
2.69 |
2.16 |
3.48 |
3.51 |
2.41 |
2.35 |
1.32 |
0.79 |
1.53 |
0.49 |
2.55 |
1.99 |
3.32 |
1.15 |
1.72 |
|
P2O5 |
0.33 |
0.34 |
0.63 |
0.64 |
0.03 |
0.03 |
0.09 |
0.06 |
0.07 |
0.07 |
0.07 |
0.07 |
0.07 |
0.12 |
0.06 |
|
ппп |
1.77 |
1.19 |
3.30 |
3.16 |
0.71 |
0.48 |
0.62 |
0.32 |
0.66 |
1.20 |
1.28 |
0.87 |
0.93 |
1.16 |
1.37 |
|
Сумма |
99.78 |
99.52 |
99.24 |
99.22 |
99.35 |
99.44 |
99.17 |
99.10 |
99.50 |
100.03 |
99.66 |
99.94 |
99.97 |
99.66 |
99.73 |
|
Mg# |
65.48 |
63.52 |
60.39 |
60.57 |
19.86 |
16.68 |
21.86 |
30.37 |
25.77 |
16.91 |
24.42 |
12.88 |
18.40 |
25.21 |
32.29 |
|
Rb |
28 |
30 |
42 |
41 |
– |
– |
– |
7 |
– |
5 |
23 |
– |
– |
– |
12 |
|
Sr |
571 |
755 |
729 |
698 |
– |
– |
– |
90 |
– |
90 |
91 |
– |
– |
– |
107 |
|
Y |
17.55 |
17.35 |
20.84 |
21.40 |
– |
– |
– |
71.61 |
– |
73.96 |
75.71 |
– |
– |
– |
79.27 |
|
Zr |
201 |
194 |
225 |
224 |
– |
– |
– |
493 |
– |
441 |
468 |
– |
– |
– |
534 |
|
Nb |
6.80 |
6.54 |
9.19 |
9.41 |
– |
– |
– |
13.06 |
– |
11.69 |
12.33 |
– |
– |
– |
13.75 |
|
Cs |
0.23 |
0.82 |
0.12 |
– |
– |
– |
– |
0.12 |
– |
0.17 |
0.12 |
– |
– |
– |
– |
|
Ba |
448 |
515 |
894 |
857 |
– |
– |
– |
38 |
– |
33 |
155 |
– |
– |
– |
131 |
|
La |
22.82 |
25.11 |
49.81 |
49.32 |
– |
– |
– |
24.84 |
– |
24.02 |
26.58 |
– |
– |
– |
26.41 |
|
Ce |
56.45 |
58.02 |
110.18 |
111.18 |
– |
– |
– |
67.08 |
– |
65.34 |
68.47 |
– |
– |
– |
67.56 |
|
Pr |
7.52 |
7.52 |
13.97 |
14.17 |
– |
– |
– |
9.52 |
– |
9.29 |
9.55 |
– |
– |
– |
9.38 |
|
Nd |
30.80 |
31.23 |
56.56 |
56.94 |
– |
– |
– |
41.87 |
– |
40.38 |
41.44 |
– |
– |
– |
40.98 |
|
Sm |
5.87 |
5.96 |
10.04 |
10.22 |
– |
– |
– |
10.48 |
– |
10.24 |
10.23 |
– |
– |
– |
10.46 |
|
Eu |
1.74 |
1.60 |
2.37 |
2.45 |
– |
– |
– |
2.38 |
– |
2.43 |
2.68 |
– |
– |
– |
2.06 |
|
Gd |
4.68 |
4.68 |
6.75 |
6.75 |
– |
– |
– |
10.35 |
– |
10.62 |
10.53 |
– |
– |
– |
10.38 |
|
Tb |
0.66 |
0.63 |
0.87 |
0.87 |
– |
– |
– |
1.94 |
– |
1.93 |
1.93 |
– |
– |
– |
1.94 |
|
Dy |
3.31 |
3.32 |
4.12 |
4.17 |
– |
– |
– |
12.28 |
– |
12.27 |
12.36 |
– |
– |
– |
12.80 |
|
Ho |
0.66 |
0.62 |
0.73 |
0.73 |
– |
– |
– |
2.66 |
– |
2.65 |
2.64 |
– |
– |
– |
2.83 |
|
Er |
1.64 |
1.59 |
1.93 |
1.93 |
– |
– |
– |
8.18 |
– |
7.80 |
7.96 |
– |
– |
– |
8.23 |
|
Tm |
0.23 |
0.23 |
0.26 |
0.25 |
– |
– |
– |
1.28 |
– |
1.22 |
1.22 |
– |
– |
– |
1.32 |
|
Yb |
1.40 |
1.42 |
1.57 |
1.57 |
– |
– |
– |
8.30 |
– |
7.83 |
7.95 |
– |
– |
– |
8.49 |
|
Lu |
0.22 |
0.22 |
0.22 |
0.22 |
– |
– |
– |
1.25 |
– |
1.27 |
1.20 |
– |
– |
– |
1.30 |
|
Hf |
4.87 |
4.76 |
5.60 |
5.61 |
– |
– |
– |
11.71 |
– |
10.54 |
11.19 |
– |
– |
– |
12.72 |
|
Ta |
0.42 |
0.43 |
0.54 |
0.54 |
– |
– |
– |
0.92 |
– |
0.86 |
0.86 |
– |
– |
– |
0.97 |
|
Th |
5.25 |
5.19 |
10.85 |
10.80 |
– |
– |
– |
2.72 |
– |
2.41 |
2.70 |
– |
– |
– |
3.26 |
|
U |
1.71 |
1.77 |
2.40 |
2.46 |
– |
– |
– |
0.95 |
– |
0.82 |
0.82 |
– |
– |
– |
1.20 |
|
(La/Yb)n |
11.01 |
11.92 |
21.38 |
21.15 |
– |
– |
– |
2.02 |
– |
2.07 |
2.25 |
– |
– |
– |
2.10 |
|
(Gd/Yb)n |
2.70 |
2.66 |
3.47 |
3.47 |
– |
– |
– |
1.01 |
– |
1.09 |
1.07 |
– |
– |
– |
0.99 |
|
Eu/Eu* |
1.01 |
0.92 |
0.88 |
0.90 |
– |
– |
– |
0.70 |
– |
0.71 |
0.79 |
– |
– |
– |
0.60 |
|
ΣREE |
137.97 |
142.15 |
259.40 |
260.79 |
– |
– |
– |
202.41 |
– |
197.29 |
204.74 |
– |
– |
– |
204.13 |
Note. Dash – no data. Mg#=Mg/[Mg+Fe²⁺]100; (La/Yb)n and (Gd/Yb)n – chondrite-normalized ratios [Boynton, 1984]; Eu/Eu*=EuN/[(SmN)(GdN)]1/2.
1. Berzin N.A., Kolman R.G., Dobretsov N.L., Zonenshain L.P., Syao Syuchan, Chang E.Z., 1994. Geodynamic Evolution of the Western Part of the Paleo-Asian Ocean. Russian Geology and Geophysics 35 (7–8), 8–28 (in Russian)
2. Borbugulov E., Chen Y., Xiao W., Windley B.F., Schulmann K., Zhang J., Zhang Zh., Song Sh., Sang M., 2018. Late Carboniferous Southward Migration of Tarbagatay Subduction-Accretion Complex by Slab Retreat and Break-off in West Junggar (NW China). Geological Journal 55 (1), 11–30. https://doi.org/10.1002/gj.3408.
3. Boynton W.V., 1984. Cosmochemistry of the Rare Earth Elements: Meteorite Studies. Rare Earth Element Geochemistry. Developments in Geochemistry 2, 63–114. https://doi.org/10.1016/B978-0-444-42148-7.50008-3.
4. Chappell B.W., White A.J.R., 2001. Two Contrasting Granite Types: 25 Years Later. Australian Journal of Earth Sciences 48 (4), 489–499. https://doi.org/10.1046/j.1440-0952.2001.00882.x.
5. Chen Y., Xiao W., Windley B.F., Zhang J.E., Sang M., Li R., Song S., Zhou K., 2017. Late Devonian-Early Permian Subduction-Accretion of the Zharma-Saur Oceanic Arc, West Junggar (NW China): Insights from Field Geology, Geochemistry and Geochronology. Journal of Asian Earth Sciences 145 (В), 424–445. https://doi.org/10.1016/j.jseaes.2017.06.010.
6. Chen Y., Xiao W., Windley B.F., Zhang J.E., Zhou K., Sang M., 2016. Structures and Detrital Zircon Ages of the Devonian-Permian Tarbagatay Accretionary Complex in West Junggar, China: Imbricated Ocean Plate Stratigraphy and Implications for Amalgamation of the CAOB. International Geology Review 59 (9), 1097–1115. https://doi.org/10.1080/00206814.2016.1185652.
7. Clarke D.B., 1992. Granitoid Rocks. Chapman & Hall, New York, 283 p.
8. Decisions of the III Kazakhstan Stratigraphic Conference on the Precambrian and Phanerozoic, 1991. Part 1. Precambrian and Paleozoic. Publishing House of the Academy of Sciences of KazSSR, Alma-Ata, 148 p. (in Russian)
9. Degtyarev K.E., 2012. Tectonic Evolution of the Early Paleozoic Island-Arc Systems and the Formation of the Continental Crust of the Caledonides of Kazakhstan. GEOS, Moscow, 288 p. (in Russian)
10. Didenko A.N., Morozov O.L., 1999. Geology and Paleomagnetism of Middle-Upper Paleozoic Rocks of the Saur Ridge. Geotectonics 33 (4), 326–352.
11. Ermolov P.V., Izokh E.P., Ponomaryova A.P., Tyan V.D., 1977. Gabbro-Granitic Series of the Western Part of Zaisan Folding System. Nauka, Novosibirsk, 249 p. (in Russian)
12. Filippova I.B., Bush V.A., Didenko A.N., 2001. Middle Paleozoic Subduction Belts: The Leading Factor in the Formation of the Central Asian Fold-and-Thrust Belt. Russian Journal of Earth Sciences 3 (6), 405–426. https://doi.org/10.2205/2001ES000073.
13. Frost B.R., Barnes C.G., Collins W.J., Arculus R.J., Ellis D.J., Frost C.D., 2001. A Geochemical Classification for Granitic Rocks. Journal of Petrology 42 (11), 2033–2048. https://doi.org/10.1093/petrology/42.11.2033.
14. Geological Map of Eastern Kazakhstan, 2014. Zaisan Series. Scale of 1:200000. Sheet M-44-XXXIV. Explanatory Note. Topaz Geological Exploration Company LLC, Ust-Kamenogorsk, 262 p. (in Russian)
15. Geological Map of Kazakhstan, 1998. Scale of 1:1000000. 10 sheets (in Russian)
16. Hu F., Ducea M.N., Liu S., Chapman J.B., 2017. Quantifying Crustal Thickness in Continental Collisional Belts: Global Perspective and a Geologic Application. Scientific Reports 7, 7058. https://doi.org/10.1038/s41598-017-07849-7.
17. Karmanova N.G., Karmanov N.S., 2011. Universal Method for X-Ray Fluorescence Silicate Analysis of Rocks on the ARL-9900XP Spectrometer. In: Abstracts of the VII All-Russian Conference on X-Ray Spectral Analysis (September 19–23, 2011). Nauka, Novosibirsk, 126 p. (in Russian)
18. Kelemen P.B., Hanghøj K., Greene A.R., 2007. One View of the Geochemistry of Subduction-Related Magmatic Arcs, with an Emphasis on Primitive Andesite and Lower Crust. Treatise on Geochemistry 3, 1–70. https://doi.org/10.1016/B0-08-043751-6/03035-8.
19. Khromykh S.V., 2022. Basic and Associated Granitoid Magmatism and Geodynamic Evolution of the Altai Accretion-Collision System (Eastern Kazakhstan). Russian Geology and Geophysics 63 (3), 279–299. https://doi.org/10.2113/RGG20204268.
20. Khromykh S.V., Kotler P.D., Semenova D.V., 2019. Geochemistry, Age and Geodynamic Settings for Saur Gabbro-Granite Intrusive Series (Eastern Kazakhstan). Geosphere Research 2, 6–26 (in Russian) https://doi.org/10.17223/25421379/11/1.
21. Khromykh S.V., Semenova D.V., Kotler P.D., Gurova A.V., Mikheev E.I., Perfilova A.A., 2020. Orogenic Volcanism in Eastern Kazakhstan: Composition, Age, and Geodynamic Position. Geotectonics 54 (4), 510–528. https://doi.org/10.1134/S0016852120040044.
22. Kotler P.D., Khromykh S.V., Zakharova A.V., Semenova D.V., Kulikova A.V., Badretdinov A.G., Mikheev E.I., Volosov A.S., 2024. Model of the Formation of Monzogabbrodiorite-Syenite-Granitoid Intrusions by the Example of the Akzhailau Massif (Eastern Kazakhstan). Petrology 32 (2), 179–200. https://doi.org/10.1134/S086959112402005X.
23. Ludwig K.R., 2003. ISOPLOT/Ex: A Geochronological Toolkit for Microsoft Excel. Version 3.00. Berkeley Geochronology Center Special Publication 4, 74 p.
24. Mantle G.W., Collins W.J., 2008. Quantifying Crustal Thickness Variations in Evolving Orogens: Correlation Between Arc Basalt Composition and Moho Depth. Geology 36 (1), 87–90. https://doi.org/10.1130/G24095A.1.
25. Miyashiro A., 1975. Volcanic Rock Series in Island Arcs and Active Continental Margins. American Journal of Science 274 (4), 321–355. https://doi.org/10.2475/ajs.274.4.321.
26. Mullen E.D., 1983. MnO/TiO2/P2O5: A Minor Element Discrimination for Basaltic Rocks of Oceanic Environments and Its Implications for Petrogenesis. Earth and Planetary Science Letters 62 (1), 53–62. http://doi.org/10.1016/0012-821X(83)90070-5.
27. Nikolaeva I.V., Palessky S.V., Chirko O.S., Chernonozhkin S.M., 2012. Determination of Major and Trace Elements by Inductively Coupled Mass-Spectrometry in Silicate Rocks After Fusion with LIBO2. Analytics and Control 16 (2), 134–142 (in Russian)
28. Paton C., Woodhead J.D., Hellstrom J.C., Hergt J.M., Greig A., Maas R., 2010. Improved Laser Ablation U-Pb Zircon Geochronology Through Robust Downhole Fractionation Correction. Geochemistry, Geophysics, Geosystems 11 (3), Q0AA06. https://doi.org/10.1029/2009GC002618.
29. Pearce J.А., 2008. Geochemical Fingerprinting of Oceanic Basalts with Applications to Ophiolite Classification and the Search for Archean Oceanic Crust. Lithos 100 (1–4), 14–48. https://doi.org/10.1016/j.lithos.2007.06.016.
30. Peccerillo A., Taylor S.R., 1976. Geochemistry of Eocene Calc-Alkaline Volcanic Rocks from the Kastamonu Area, Northern Turkey. Contributions to Mineralogy and Petrology 58 (1), 63–81. https://doi.org/10.1007/BF00384745.
31. Penkina V.A., Kotler P.D., Safonova I.Y., Khromykh S.V., Perfilova A.A., Kulikova A.V., Galimullin I.A., 2024. Evolution of the Northeastern Margin of the Kazakhstan Paleocontinent: Results of a Petro-Geochemical Study of Sedimentary and Volcanogenic-Sedimentary Rocks of the Zharma-Saur Island Arc Zone. Geotectonics 58 (3), 321–343. https://doi.org/10.1134/S0016852124700274.
32. Saccani E., 2015. A New Method of Discriminating Different Types of Post-Archean Ophiolitic Basalts and Their Tectonic Significance Using Th-Nb and Ce-Dy-Yb Systematics. Geoscience Frontiers 6 (4), 481–501. https://doi.org/10.1016/j.gsf.2014.03.006.
33. Safonova I., Perfilova A., 2023. Survived and Disappeared Intraoceanic Arcs of the Paleo-Asian Ocean: Evidence from Kazakhstan. National Science Review 10 (2), nwac215. https://doi.org/10.1093/nsr/nwac215.
34. Sharpenok L.N., Kukharenko E.A., Kostin A.E., 2009. New Provisions for Volcanogenic Rocks in the Petrographic Code. Journal of Volcanology and Seismology 3 (4), 279–293. https://doi.org/10.1134/S0742046309040058.
35. Shen P., Shen Y., Li X.-H., Pan H., Zhu H., Meng L., Dai H., 2012. Northwestern Junggar Basin, Xiemisitai Mountains, China: A Geochemical and Geochronological Approach. Lithos 140–141, 103–118. https://doi.org/10.1016/j.lithos.2012. 02.004.
36. Sláma J., Košler J., Condon D.J., Crowley J.L., Gerdes A., Hanchar J.M., Horstwood M.S.A., Morris G.A. et al., 2008. Plešovice Zircon – A New Natural Reference Material for U-Pb and Hf Isotopic Microanalysis. Chemical Geology 249 (1–2), 1–35. https://doi.org/10.1016/j.chemgeo.2007.11.005.
37. Song S., Xiao W., Windley B.F., Collins A.S., Chen Y., Zhang J., Schulmann K., Han C. et al., 2020. Late Paleozoic Chingiz and Saur Arc Amalgamation in West Junggar (NW China): Implications for Accretionary Tectonics in the Southern Altaids. Tectonics 39 (7), e2019TC005781. https://doi.org/10.1029/2019TC005781.
38. Sun S.-S., McDonough W.F., 1989. Chemical and Isotopic Systematics of Oceanic Basalts: Implications for Mantle Composition and Processes. Geological Society of London Special Publications 42 (1), 313–345. https://doi.org/10. 1144/GSL.SP.1989.042.01.19.
39. Vermeesch P., 2006. Tectonic Discrimination Diagrams Revisited. Geochemistry, Geophysics, Geosystems 7 (6), Q06017. https://doi.org/10.1029/2005GC001092.
40. Vladimirov A.G., Kruk N.N., Rudnev S.N., Khromykh S.V., 2003. Geodynamics and Granitoid Magmatism of Collisional Orogens. Russian Geology and Geophysics 44 (12), 1321–1338 (in Russian)
41. Volosov A.S., Khromykh S.V., Izokh A.E., Kotler P.D., Semenova D.V., Kulikova A.V., Naryzhnova A.V., 2025. Genesis of Dykes and Mantle-Crust Interaction in the Keregetas Swarm, Eastern Kazakhstan. Journal of Asian Earth Sciences 284, 106563. https://doi.org/10.1016/j.jseaes.2025.106563.
42. Wiedenbeck M., Allé P., Corfu F., Griffin W.L., Meier M., Oberli F., von Quadt A., Roddick J.C., Spiegel W., 1995. Three Natural Zircon Standards for U-Th-Pb, Lu-Hf, Trace Element and REE Analyses. Geostandards and Geoanalytical Research 19 (1), 1–23. https://doi.org/10.1111/j.1751-908X.1995.tb00147.x.
43. Winchester J.A., Floyd P.A., 1977. Geochemical Discrimination of Different Magma Series and Their Differentiation Products Using Immobile Elements. Chemical Geology 20, 325–343. https://doi.org/10.1016/0009-2541(77)90057-2.
44. Wood D.A., 1980. The Application of a Th–Hf–Ta Diagram to Problems of Tectonomagmatic Classification and to Establishing the Nature of Crustal Contamination of Basaltic Lavas of the British Tertiary Volcanic Province. Earth and Planetary Science Letters 50 (1), 11–30. https://doi.org/10.1016/0012-821X(80)90116-8.
45. Xu Y., Han B.-F., Li A., Liao W., 2023. Co-Variation of Crustal Thermal Condition and Thickness of the Northeastern Margin of Kazakhstan Continent During the Late Paleozoic Siberia-Kazakhstan Convergence and Post-Collisional Extension. Journal of Asian Earth Sciences 242, 105508. https://doi.org/10.1016/j.jseaes.2022.105508.
46. Xu Y., Han B.-F., Liao W., Li A., 2022. The Serpukhovian-Bashkirian Amalgamation of Laurussia and the Siberian Continent and Implications for Assembly of Pangea. Tectonics 41 (3), e2022TC007218. https://doi.org/10.1029/2022TC007218.
47. Zhang Yi, Chen J., Xin M., Liu Yu., Li Ch., 2026. Evidence for Late Paleozoic Subduction Erosion, Slab Rollback and Closure of the Irtysh-Zaysan Ocean from the Evolving Sediment Provenance in the Southwestern Central Asian Orogenic Belt. Gondwana Research 149, 291–313. https://doi.org/10.1016/j.gr.2025.08.014.
48. Zholtayev G.Zh., Nikitina O.I., Zhaymina V.Ya., Seitmuratova E.Yu., Pirogova T.E., Ivanova N.I., Fazylov Ye.M., Musina E.S. et al., 2021. Stratigraphic Schemes of the Phanerozoic of Kazakhstan. Explanatory Note. 378 LLP, Almaty, 236 p. (in Russian)
3 Academician Koptyug Ave, Novosibirsk 630090
The authors declare that they have no conflicts of interest relevant to this manuscript.
3 Academician Koptyug Ave, Novosibirsk 630090
18 Kremlyovskaya St, Kazan 420008
The authors declare that they have no conflicts of interest relevant to this manuscript.
3 Academician Koptyug Ave, Novosibirsk 630090
The authors declare that they have no conflicts of interest relevant to this manuscript.
1 East Third Rd, Chengdu 610059
5 Yiheyuan St, Beijing 100871
The authors declare that they have no conflicts of interest relevant to this manuscript.
3 Academician Koptyug Ave, Novosibirsk 630090
18 Kremlyovskaya St, Kazan 420008
The authors declare that they have no conflicts of interest relevant to this manuscript.
Penkina V.A., Kotler P.D., Khromykh S.V., Xu Y., Kulikova A.V. VOLCANISM OF THE ZHARMA-SAUR ZONE, EASTERN KAZAKHSTAN: GEOCHRONOLOGY, GEOCHEMISTRY AND TECTONIC IMPLICATIONS. Geodynamics & Tectonophysics. 2025;16(6):858. https://doi.org/10.5800/GT-2025-16-6-0858. EDN: KNGEMO


Editor-in-Chief
Sklyarov E.V.664033, Irkutsk, Lermontova St., 128,
IEC SB RAS Institute of the Earth's crust
E-mail.: gt@crust.irk.ru
tel.: 8 3952 425422
Processing of personal data


