


Contents
Scroll to:
https://doi.org/10.5800/GT-2025-16-4-0839
EDN: HITSKS
Scroll to:
On August 18, 2020, an MW 6.8 earthquake occurred ~130 km southwest of Bengkulu. In this study, we used the static GNSS data from continuously monitoring stations, surrounding the epicentre, to obtain the data from 10 days before to 10 days after the earthquake. We estimate the coseismic slip distribution with two models of nodal planes from the USGS. The coseismic slip was calculated using an elastic half-space model with inversion best-fit displacement. The GNSS displacement data with values less than ~5 mm indicate an insignificant displacement and the best model arameters of strike of 313° and dip of 8°, with a misfit value of ~0.4 mm. This study suggests that the 2020 Bengkulu earthquake occurred due to the subduction of the Indo-Australian plate underneath the Eurasian plate with a cumulative seismic moment of 1.73·1019 N·m, equivalent to magnitude 6.76.
Anggara O., Meilano I., Alif S., Susilo S. COSEISMIC SLIP DISTRIBUTION OF THE 2020 Mw 6.8 BENGKULU EARTHQUAKE DERIVED FROM THE GNSS OBSERVATIONS. Geodynamics & Tectonophysics. 2025;16(4):0839. https://doi.org/10.5800/GT-2025-16-4-0839. EDN: HITSKS
The previous studies of the Sumatra region have shown that the Bengkulu region is a highly active seismic zone due to the collision of the Indo-Australian and Eurasian tectonic plates (e.g., [Chlieh et al., 2008; Prawirodirdjo et al., 2010]). The Australian plate is converging with the southeastern segment of the Eurasian Plate (Sundaland block) at a plate motion rate of ~59 mm/yr [Bock et al., 2003]. The 2020 Bengkulu earthquake occurred within the subduction zone between these two plates, where the Indo-Australian Plate is subducting beneath the Eurasian Plate.
The Bengkulu region, located in the western coast of Sumatra, Indonesia, has experienced several significant earthquakes in the past (e.g., [Natawidjaja et al., 2006]). Historically, many large earthquakes have occurred in central Sumatra; the Mentawai segment produced MW 8.7–8.9 and 8.9–9.1 events in 1797 and 1833, respectively [Newcomb, McCann, 1987; Natawidjaja et al., 2006]. One of the most notable events was the 2007 Bengkulu earthquake, which had a magnitude of MW 8.4 and caused significant damage to infrastructure and loss of life [Gusman et al., 2010; Konca et al., 2008; Lubis et al., 2013; Zheng et al., 2018]. Then, the MW 7.8 Mentawai earthquake of October 25, 2010 caused a tsunami [Hill et al., 2012; Li, Huang, 2013; Tsang et al., 2016]. In addition to coseismic deformation, this region is also affected by ongoing postseismic deformation resulting from the 2004 Sumatra–Andaman earthquake [Alif et al., 2024]. Another earthquake with a magnitude of MW 6.8 occurred on August 18, 2020 at 22:23:59 UTC in the Bengkulu region. The United States Geological Survey (USGS) reported that the 2020 Bengkulu earthquake epicenter was located approximately ~130 km southwest of the city of Bengkulu (4.322° S; 101.135° E) at a depth of 22 km depth. The focal mechanisms of the earthquake suggest two possible directions of fault source (strike 313° and 127°) (https://earthquake.usgs.gov/earthquakes/search/). However, the faults of the 2020 Bengkulu earthquake are poorly understood.
GNSS is a very reliable tool for measuring the dynamics of the earth’s crust [Heliani et al., 2024; Ansari et al., 2024], including volcanic deformation [Anggara et al., 2023], earthquake deformation estimation [Tanaka et al., 2019; Xiang et al., 2024], and fault slip rate calculations [Tin et al., 2022]. GNSS-based geodynamic approaches have been widely applied for different geodynamic settings, such as shear faults (San Andreas faults) [Xu et al., 2021], subduction zones in Japan [Okada, Nishimura, 2025], rift regions (Red Sea, East Africa) [Stamps et al., 2014] and coseismic effects of the Hovsgol earthquake, Mongolia [Lukhnev et al., 2022]. In this study, we aim to provide a comprehensive characterization of the coseismic slip distribution of the MW 6.8 Bengkulu earthquake by inverting continuous GNSS observations from the Indonesian Continuously Operating Reference Stations (Ina-CORS) and Sumatran GPS Array (SuGAR) networks. We specifically focus on testing two plausible fault geometries to better constrain the fault rupture parameters. Furthermore, we assess the Coulomb stress transfer resulting from the mainshock and compare it with the spatial distribution of aftershocks reported by the USGS to explore the potential triggering mechanisms. Through these objectives, the study contributes to a deeper understanding of seismic source processes and stress interactions in the Bengkulu region.
This study used the GNSS data from various sites in Bengkulu, Indonesia that were obtained from 14 stations of the Geospatial Information Agency of Indonesia (BIG) and 10 stations of the Sumatran GPS Array (SuGAR) (Table 1). The GNSS sites were located around the Mentawai island and the coast of Bengkulu (Fig. 1). The GNSS data have proven useful in estimating coseismic slip source modelling (e.g., [Alif et al., 2021; Gunawan et al., 2022]). The GNSS data were recorded every 30 seconds from 10 days before the August 18, 2020 MW 6.8 Bengkulu earthquake and 10 days after the earthquake.
The daily solution was estimated using BERNESE version 5.2 from the Astronomical Institute of the University of Bern (AIUB) [Dach et al., 2015]. To minimize errors in GNSS, use has been made of the precise satellite orbits (PRE) data, ocean loading and atmospheric loading corrections, sub-daily pole, nutation model, precise orbit file (SP3), earth rotation pole (IEP), and satellite and receiver clock corrections. The daily GNSS data were processed using the International GNSS Service (IGS) data from 10 stations (DARW, DGAR, KARR, HYDE, IISC, NTUS, PERT, PIMO, YARR, YAR2) (e.g., [Alif et al., 2025]) in the International Terrestrial Reference Frame (ITRF) 2014 [Altamimi et al., 2016]. Three components were used to calculate the coseismic deformation obtained by averaging the data for 10 days before and 10 days after the earthquake, and a coseismic slip model for the MW 6.8 Bengkulu earthquake.
The coseismic slip model was constructed using seismic offsets observed approximately 130 km from the epicenter of the earthquake. Model 1 and Model 2 were calculated based on the mechanism of the earthquake, possibly caused by faulting, using Nodal Plane 1 (NP1) and Nodal Plane 2 (NP2). Model 1 uses a strike angle (θ) of 313°, a rake angle (δ) of 70–130°, and a dip angle (λ) of 8°, a length (L) of 60 km, a width (W) of 50 km, and a patch size of 5 km. Meanwhile, Model 2 uses a strike angle (θ) of 127°, a dip angle (λ) of 82°, a length (L) of 65 km, a width (W) of 40 km, and a patch size of 5 km. We investigated two fault scenarios from the USGS thrust fault plane mechanism. We calculated the coseismic slip distribution of the earthquake using the steepest descent inversion method [Wang et al., 2009; Wang et al., 2013]:
F(s)=||Gs–y||2+α2||Hτ||2
where G – Green’s function calculated using an elastic half-space dislocation model [Okada, 1992]; s – coseismic slip on each patch, y is the apparent displacement; α2 – smoothing factor; H – Laplacian operator, and τ is the shear stress drop.
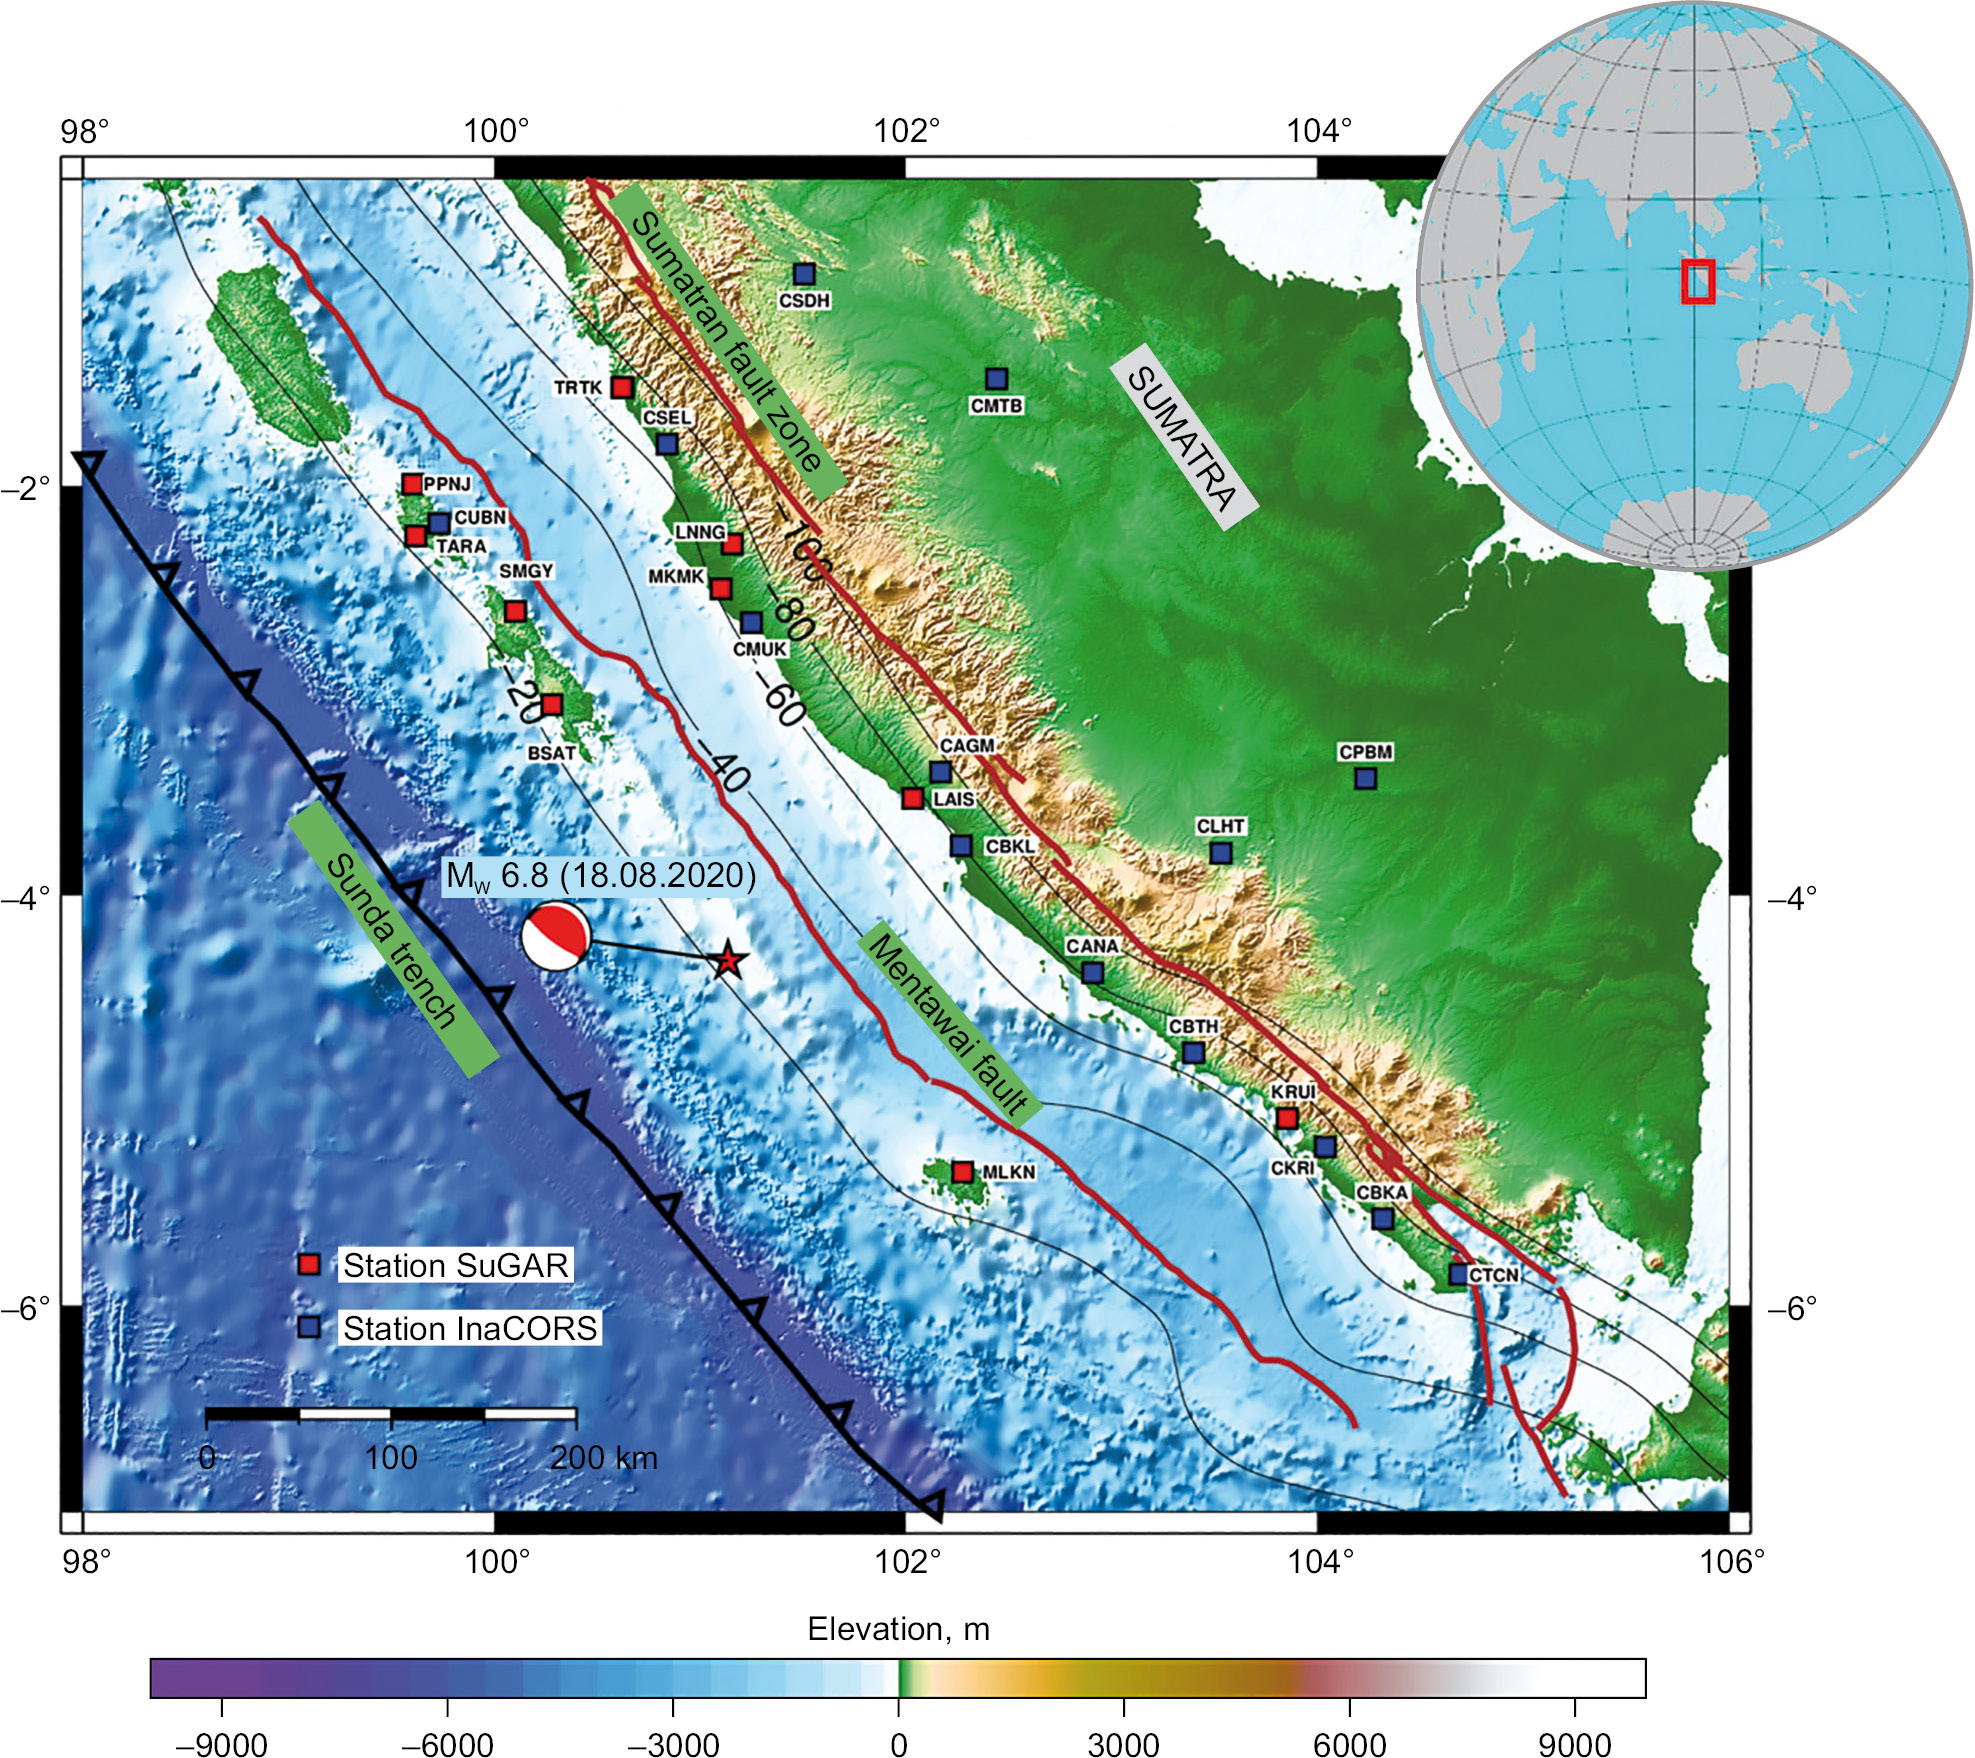
Fig. 1. Tectonic setting of the study area.
Sumatran fault zone and Mentawai fault are shown [Irsyam et al, 2017]. The beach ball is a focal mechanism [Dziewonski et al., 1981]. Black thin lines represent slab 1.0 with interval of 20 km [Hayes et al., 2012]. Topography and bathymetry are presented using SRTM 1.5+ [Tozer et al., 2019]. Inset: red square indicates the study area (Bengkulu, Indonesia).
Рис. 1. Тектоническая обстановка района исследования.
Показана Суматринская разломная зона и разлом Ментавай [Irsyam et al, 2017]. Значком в виде пляжного мяча обозначен механизм очага землетрясения [Dziewonski et al., 1981]. Черными тонкими линиями показана модель 1.0 с интервалом между горизонталями 20 км [Hayes et al., 2012]. Топография и батиметрия представлены с использованием SRTM 1.5+ [Tozer et al., 2019]. На врезке: красный квадрат – район исследования (Бенкулу, Индонезия).
Table 1. GNSS data used in this study
Таблица 1. ГНСС-данные, используемые в статье
|
No. |
Station |
Longitude (°) |
Latitude (°) |
Location |
Reference |
|
1 |
KRUI |
103.8547 |
–5.0902 |
Krui City, Pesisir Barat Regency |
SuGAR |
|
2 |
LAIS |
102.0339 |
–3.5292 |
Lais City, Bengkulu |
SuGAR |
|
3 |
LNNG |
101.1564 |
–2.2853 |
Tapan |
SuGAR |
|
4 |
MLKN |
102.2765 |
–5.3526 |
Enggano Island |
SuGAR |
|
5 |
PPNJ |
99.60368 |
–1.9940 |
Mukomuko |
SuGAR |
|
6 |
TRTK |
100.6241 |
–1.5208 |
Taratak |
SuGAR |
|
7 |
SMGY |
100.1026 |
–2.6145 |
Pagai Selatan Island |
SuGAR |
|
8 |
TARA |
99.61771 |
–2.2469 |
Sipura Utara Island |
SuGAR |
|
9 |
BSAT |
100.2800 |
–3.0700 |
Pagai Selatan Island |
SuGAR |
|
11 |
MKMK |
101.1012 |
–2.5042 |
Mukomuko |
SuGAR |
|
12 |
CTCN |
104.6900 |
–5.8500 |
Cisolok |
BIG |
|
13 |
CBKA |
104.3200 |
–5.5800 |
Bengkunat |
BIG |
|
14 |
CKRI |
104.0400 |
–5.2300 |
Kampung Jawa, Central Coast |
BIG |
|
16 |
CANA |
102.9100 |
–4.3800 |
Padang Kapuk, Manna |
BIG |
|
17 |
CBKL |
102.2700 |
–3.7600 |
Gading Cempaka |
BIG |
|
18 |
CAGM |
102.1700 |
–3.4000 |
Gunung Alam |
BIG |
|
20 |
CBTH |
103.4127 |
–4.8420 |
Naje |
BIG |
|
21 |
CMUK |
101.2500 |
–2.6700 |
Ujung Pandang, Mukomuko City |
BIG |
|
22 |
CLHT |
103.5300 |
–3.7900 |
Pasar Baru, Lahat |
BIG |
|
23 |
CPBM |
104.2300 |
–3.4300 |
North Prabumulih |
BIG |
|
24 |
CMTB |
102.4415 |
–1.479 |
Tabing Tinggi, Jambi |
BIG |
|
25 |
CSDH |
101.5062 |
–0.9661 |
Sungai Dareh, Sumatera Barat |
BIG |
|
26 |
CUBN |
99.73134 |
–2.1863 |
South Sipora |
BIG |
|
27 |
CSEL |
100.8391 |
–1.7981 |
Ranah Pesisir |
BIG |
The coseismic displacement of the August 18, 2020 MW 6.8 earthquake showed that points near the station experienced greater displacement than those farther from the epicenter. The horizontal displacement values at the station near the epicenter, MLKN, were –3.66 mm for dE and –0.96 mm for dN, while at station BSAT they were 2.95 mm for dE and –1.27 mm for dN (Fig. 2, a). However, at father stations, such as CLHT, CPBM, CMTB, and CSDH, the displacement values were relatively small, of ~0.5 mm. Since CSDH, CMTB, CPBM, and CLHT stations are far from the epicenter, our coseismic model involves only closer points, directly affected by the earthquake displacement. Judging from the displacement values, the influence of displacement decreased with distance from the epicenter. The vertical displacement at station MLKN was 5.40 mm, and at station BSAT – –6.34 mm; the displacement values at vertical stations varied greatly (Fig. 2, b).
Model 1 and Model 2 are relative to the direction of subduction the thrust fault (Fig. 3). The inversion results of Model 1 yielded a seismic moment of 1.73·1019 N·m equivalent to MW 6.76 with a misfit of ~0.4 mm. However the inversion results of Model 2 yielded a seismic moment of 1.13·1019 N·m equivalent to MW 6.64 with a misfit of ~0.6 mm. The misfit between the coseismic displacement data and the model is calculated using the mean absolute error (MAE) [Gunawan et al., 2022]. The slip distribution of Model 1 is concentrated in the southern part of the earthquake epicenter; the Model 2 slip distribution pattern, also located there, has a significant dip of 82°. Both models indicate that there is the Indo-Australian plate’s interaction with the Eurasian plate in the subdiuction zone. These results are based on an assumed rigidity of 40 GPA [Gusman et al., 2010]. According to the USGS release, the seismic moment value is 1.80·1019 N·m or equivalent to MW 6.77. Among the two earthquake models tested, Model 1 demonstrates the best agreement with the USGS solution, yielding a mean absolute error (MAE) of approximately 0.4 mm in the strike direction. This model aligns with the orientation of the subduction-related NP1.
The Coulomb failure stress (∆CFS) method can be used to investigate the relationships between earthquakes that may trigger subsequent earthquakes such as mainshock-aftershock sequences, and those between tectonic and volcanic earthquakes [Zhang et al., 2012]. In this study, the MW 6.8 Bengkulu earthquake was followed by a MW 6.9 aftershock, according to USGS reports, which was then followed by aftershocks with a magnitude less than 5. Static stress triggering was calculated based on the change in Coulomb failure stress (∆CFS) [Toda et al., 2011], using a friction coefficient of 0.4 [Ishibe et al., 2017; King et al., 1994]. Based on the coseismic slip model, Model 1 shows the best agreement with the USGS release with a minimum misfit, and this was used to investigate the stress distribution. The Coulomb stress results showed that there is a relationship between the mainshock and the aftershocks, as the distribution of the aftershocks occurred in areas of increased stress, including the MW 6.9 earthquake (Fig. 4).
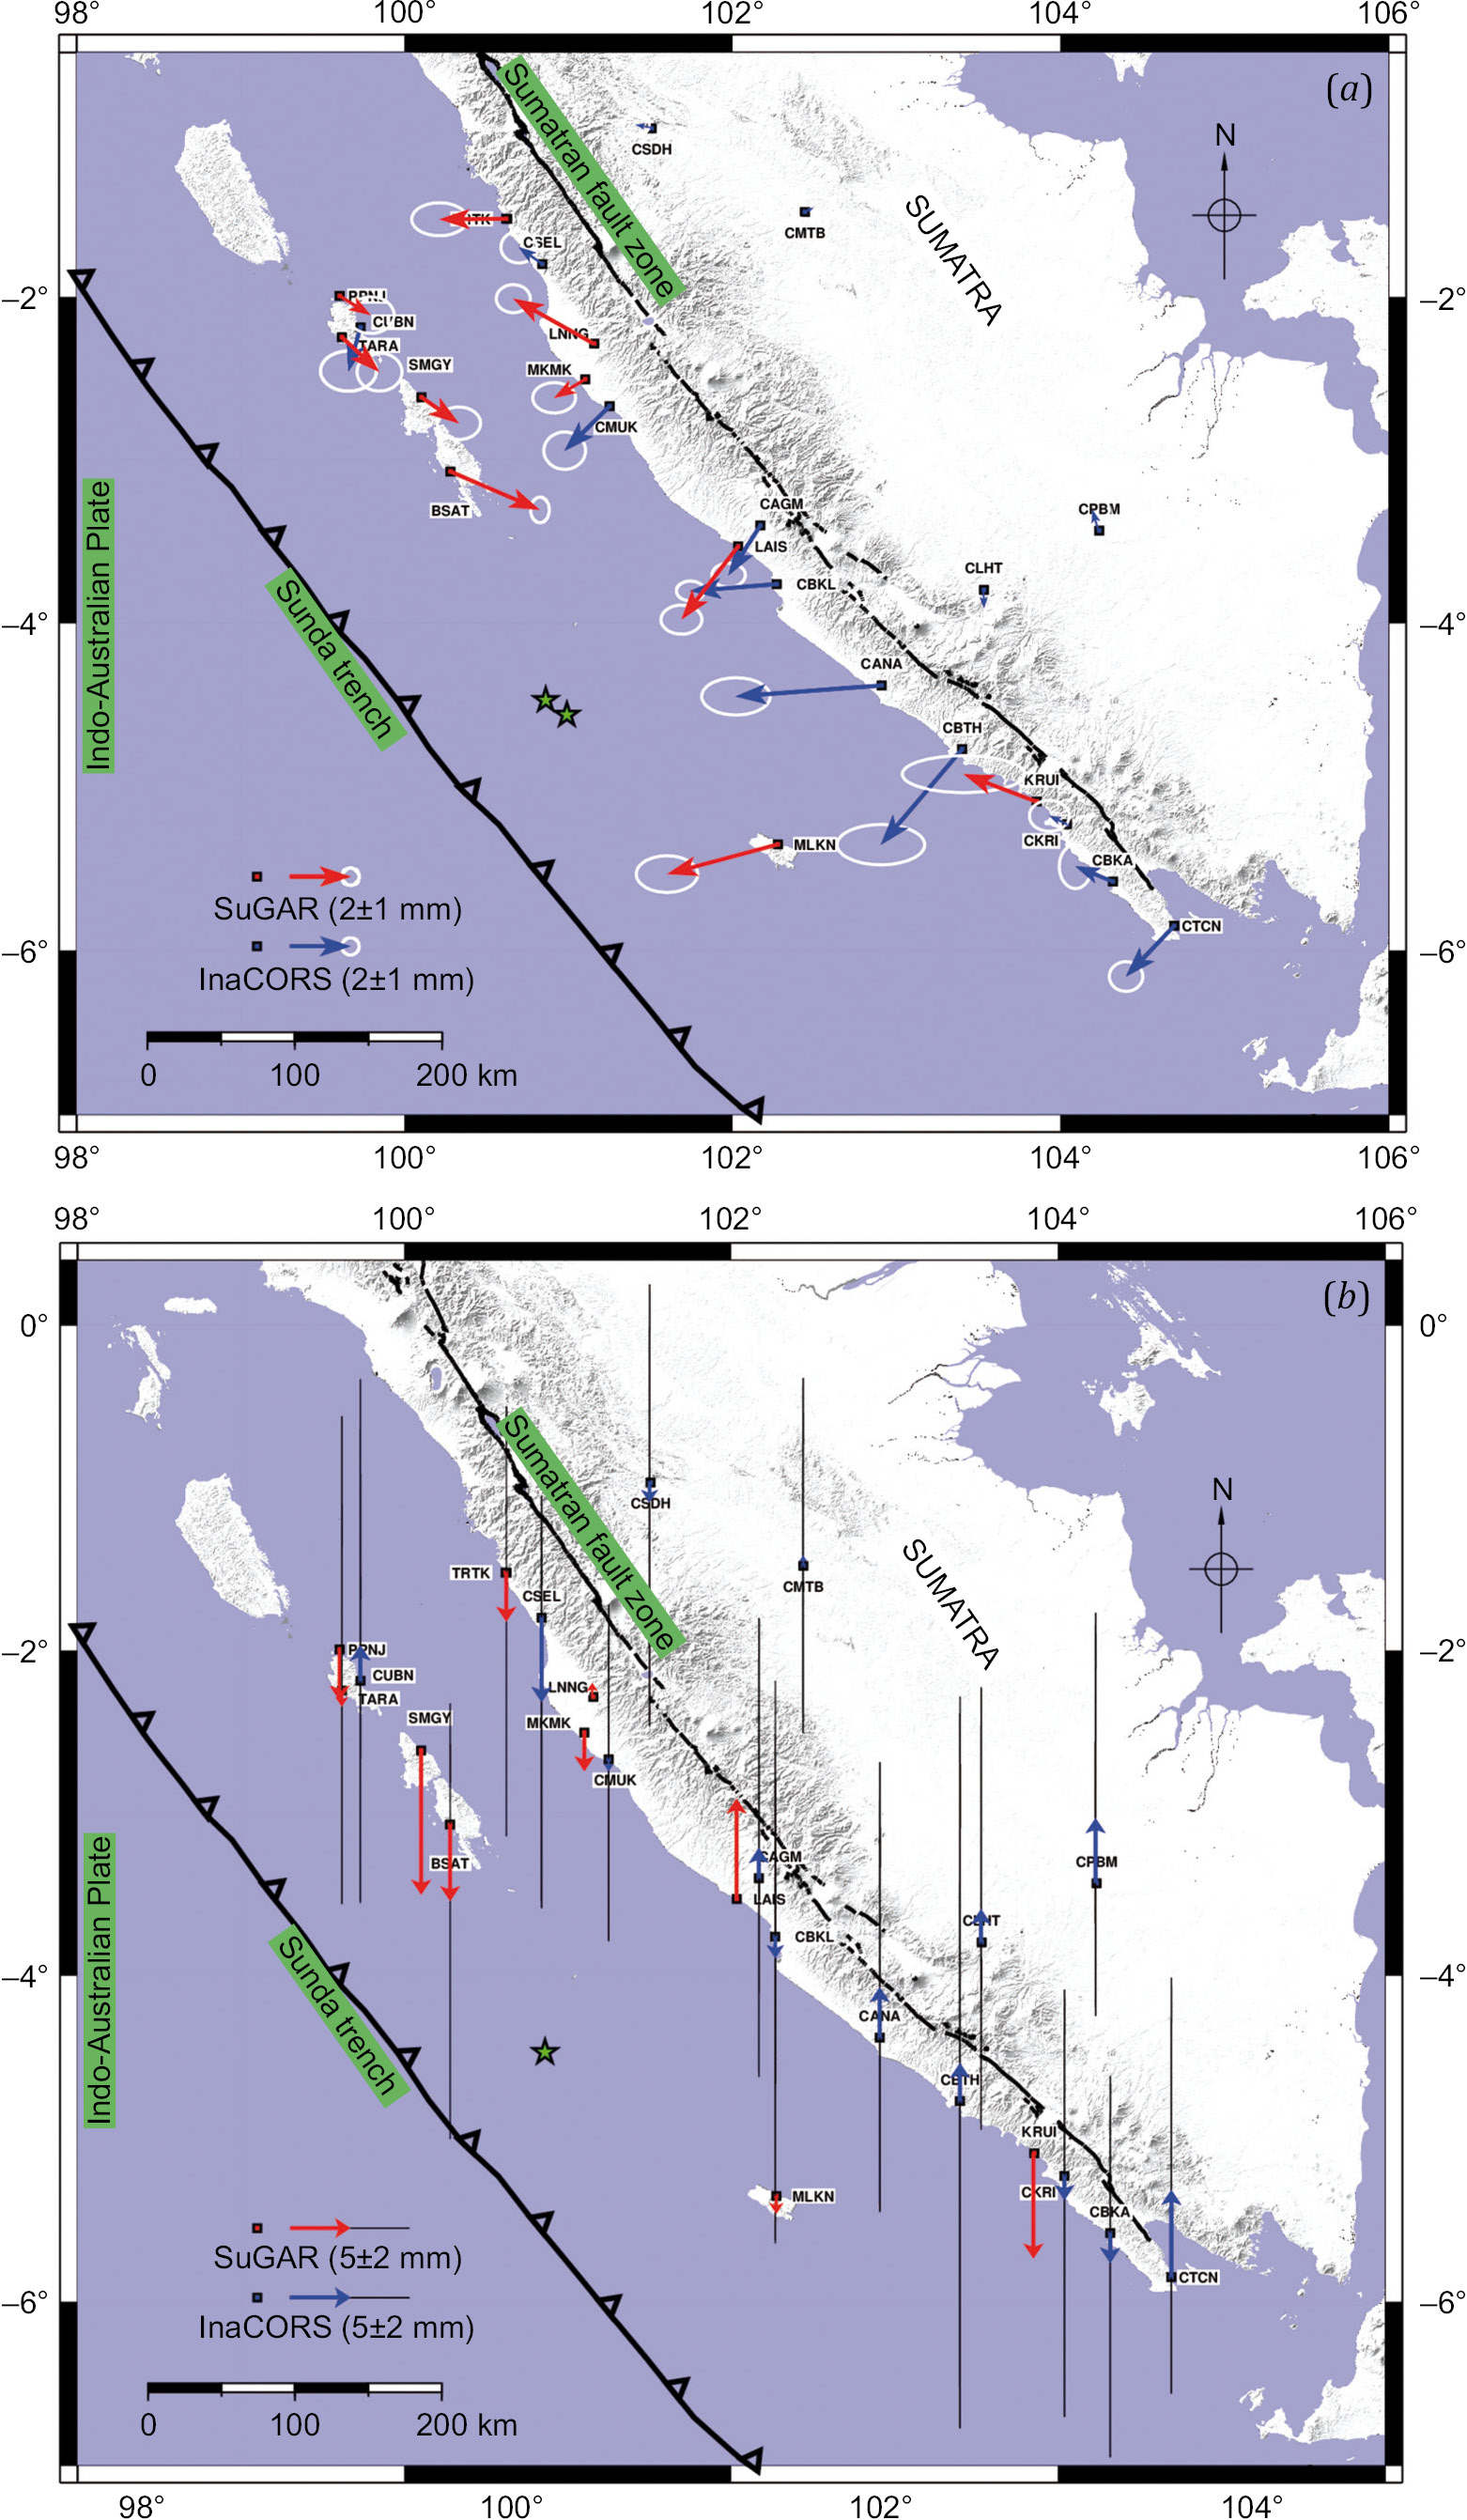
Fig. 2. Horizontal (a) and vertical (b) components of coseismic displacements at GNSS sites. The green star indicates the epicenter of the 2020 Bengkulu earthquake.
Рис. 2. Горизонтальная (а) и вертикальная (b) составляющие косейсмических смещений в пунктах ГНСС. Зеленой звездочкой обозначен эпицентр землетрясения 2020 г. в Бенкулу.
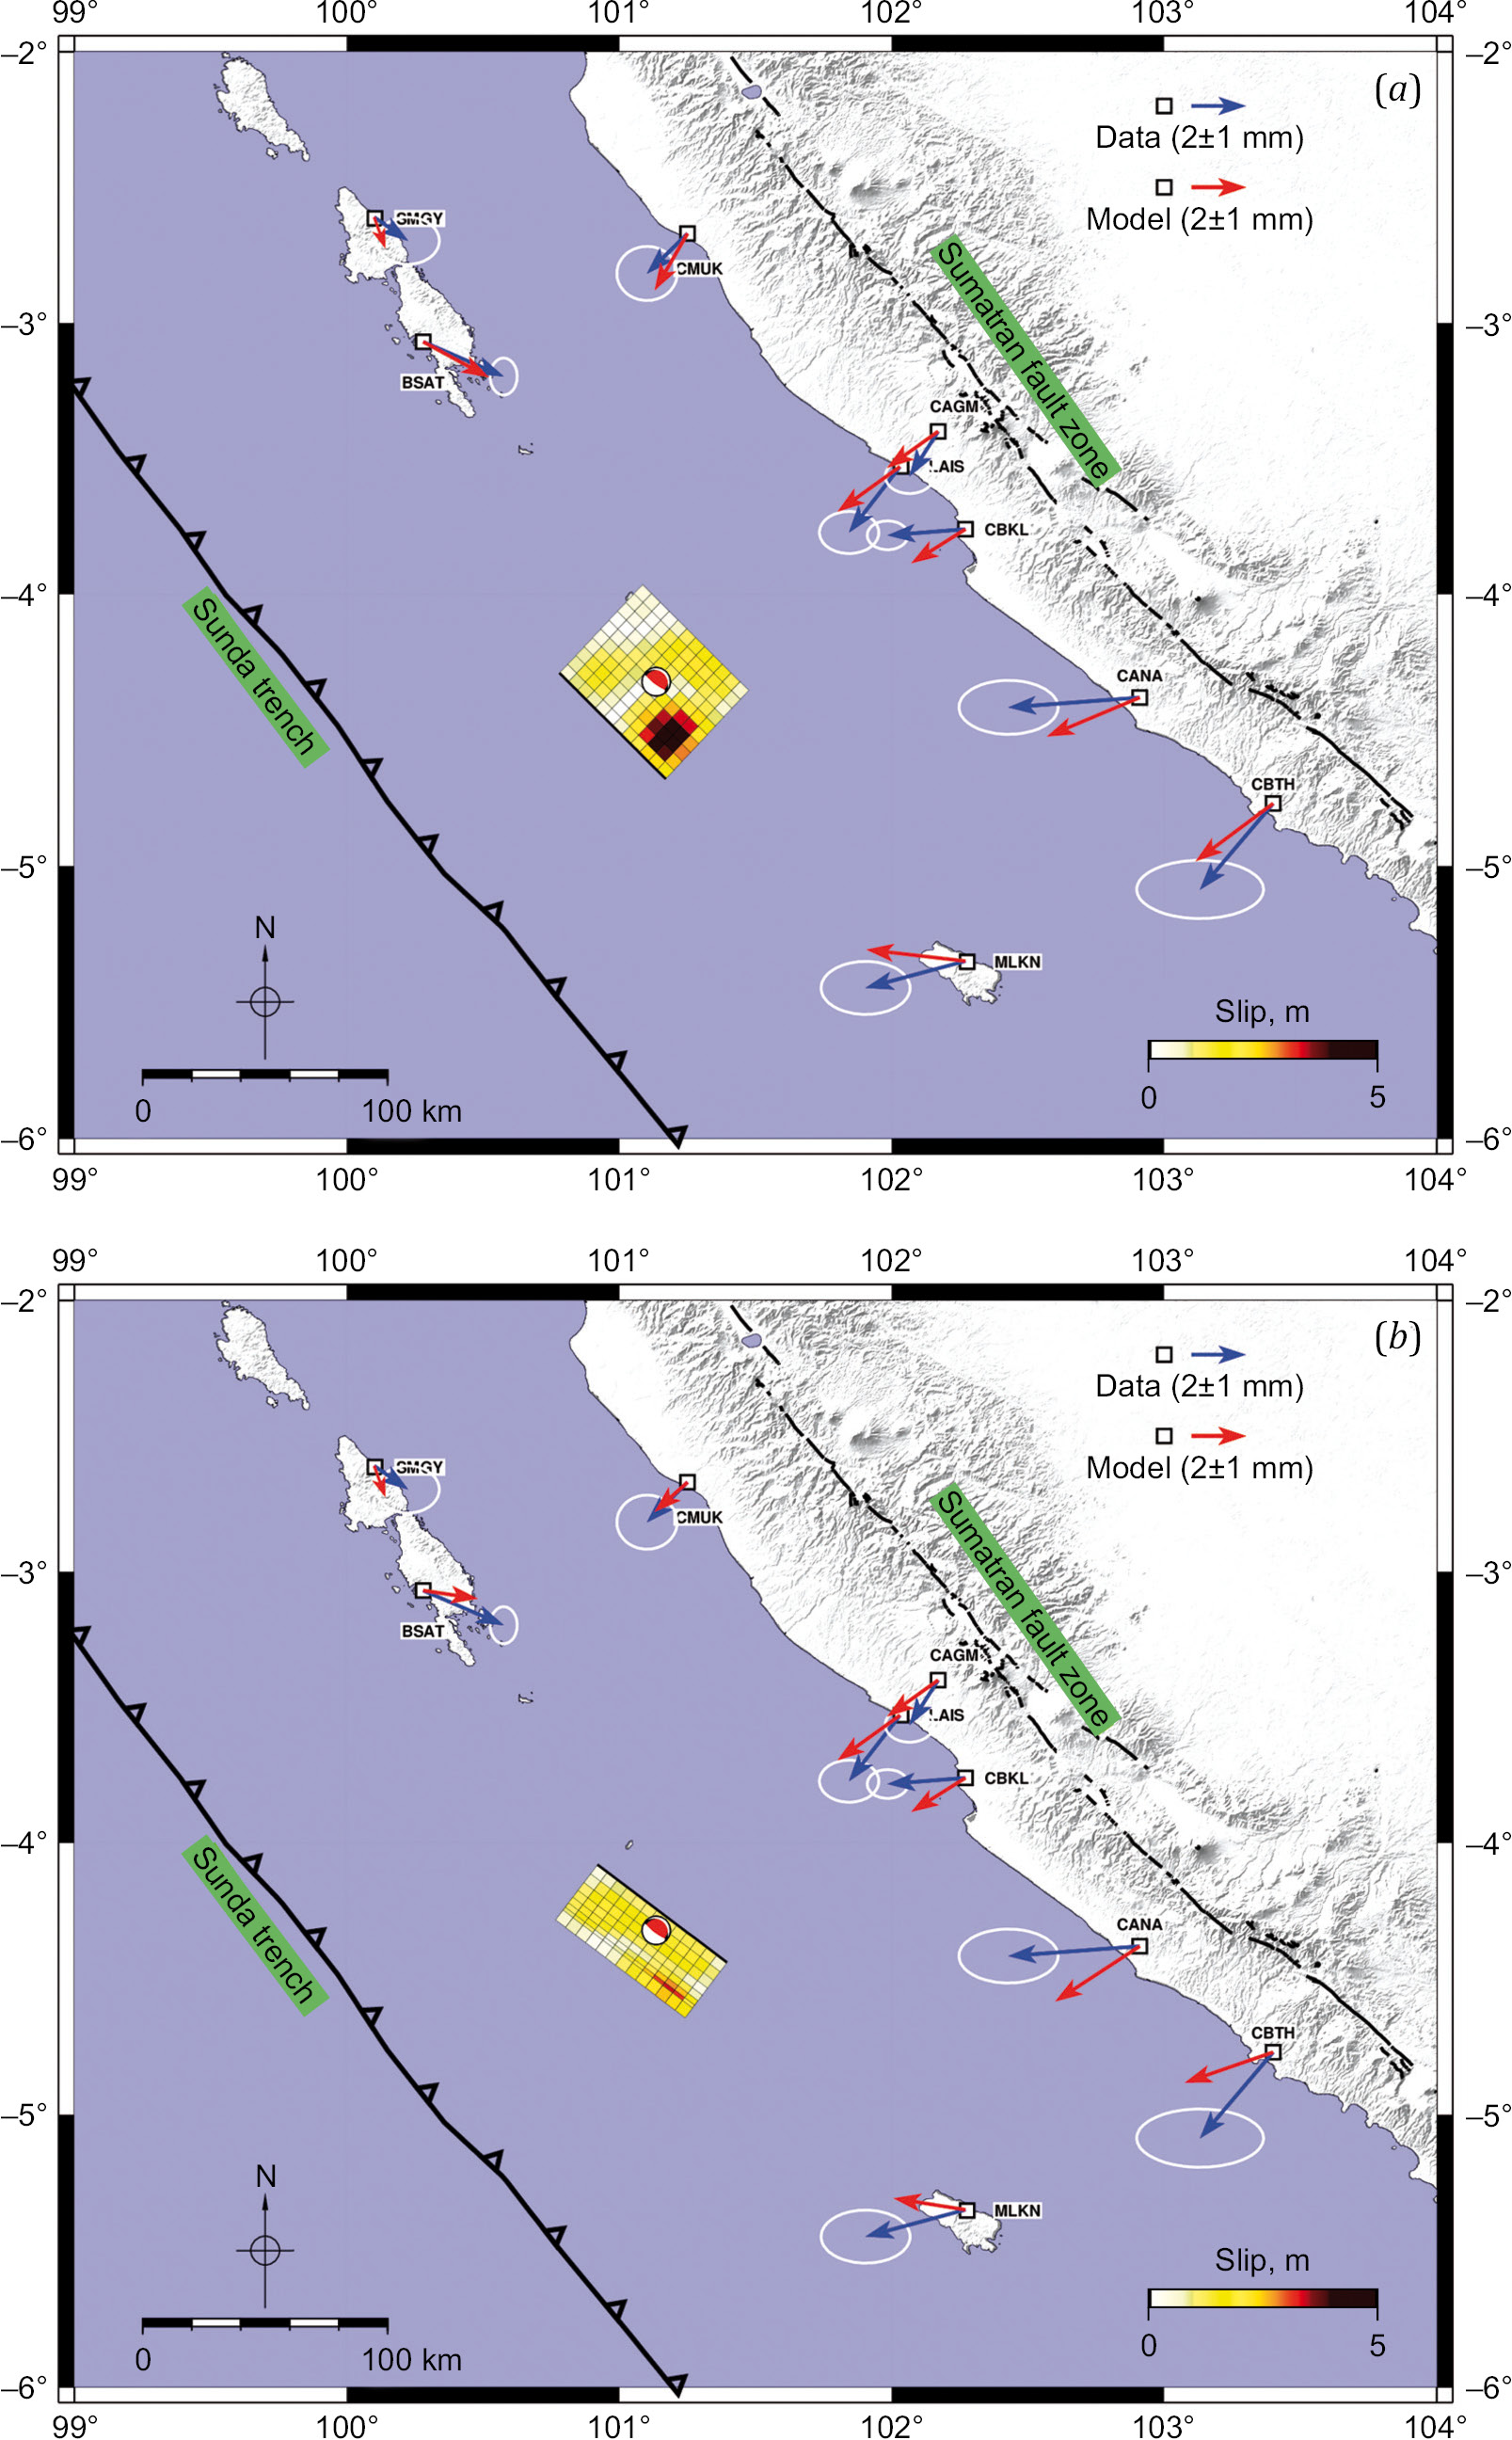
Fig. 3. Coseismic displacements: (a) – Model 1; (b) – Model 2.
Blue vectors correspond to GPS data, red ones – to displacement models. The solid black line delineates the top of the fault. The beach ball icon marks the location of the 2020 Bengkulu earthquake epicenter.
Рис. 3. Косейсмические смещения: (а) – модель 1; (b) – модель 2.
Синие векторы соответствуют GPS-данным, красные – модели смещения. Черная жирная линия очерчивает верхнюю часть разлома. Значком в виде пляжного мяча обозначено местоположение эпицентра землетрясения 2020 г. в Бенкулу.
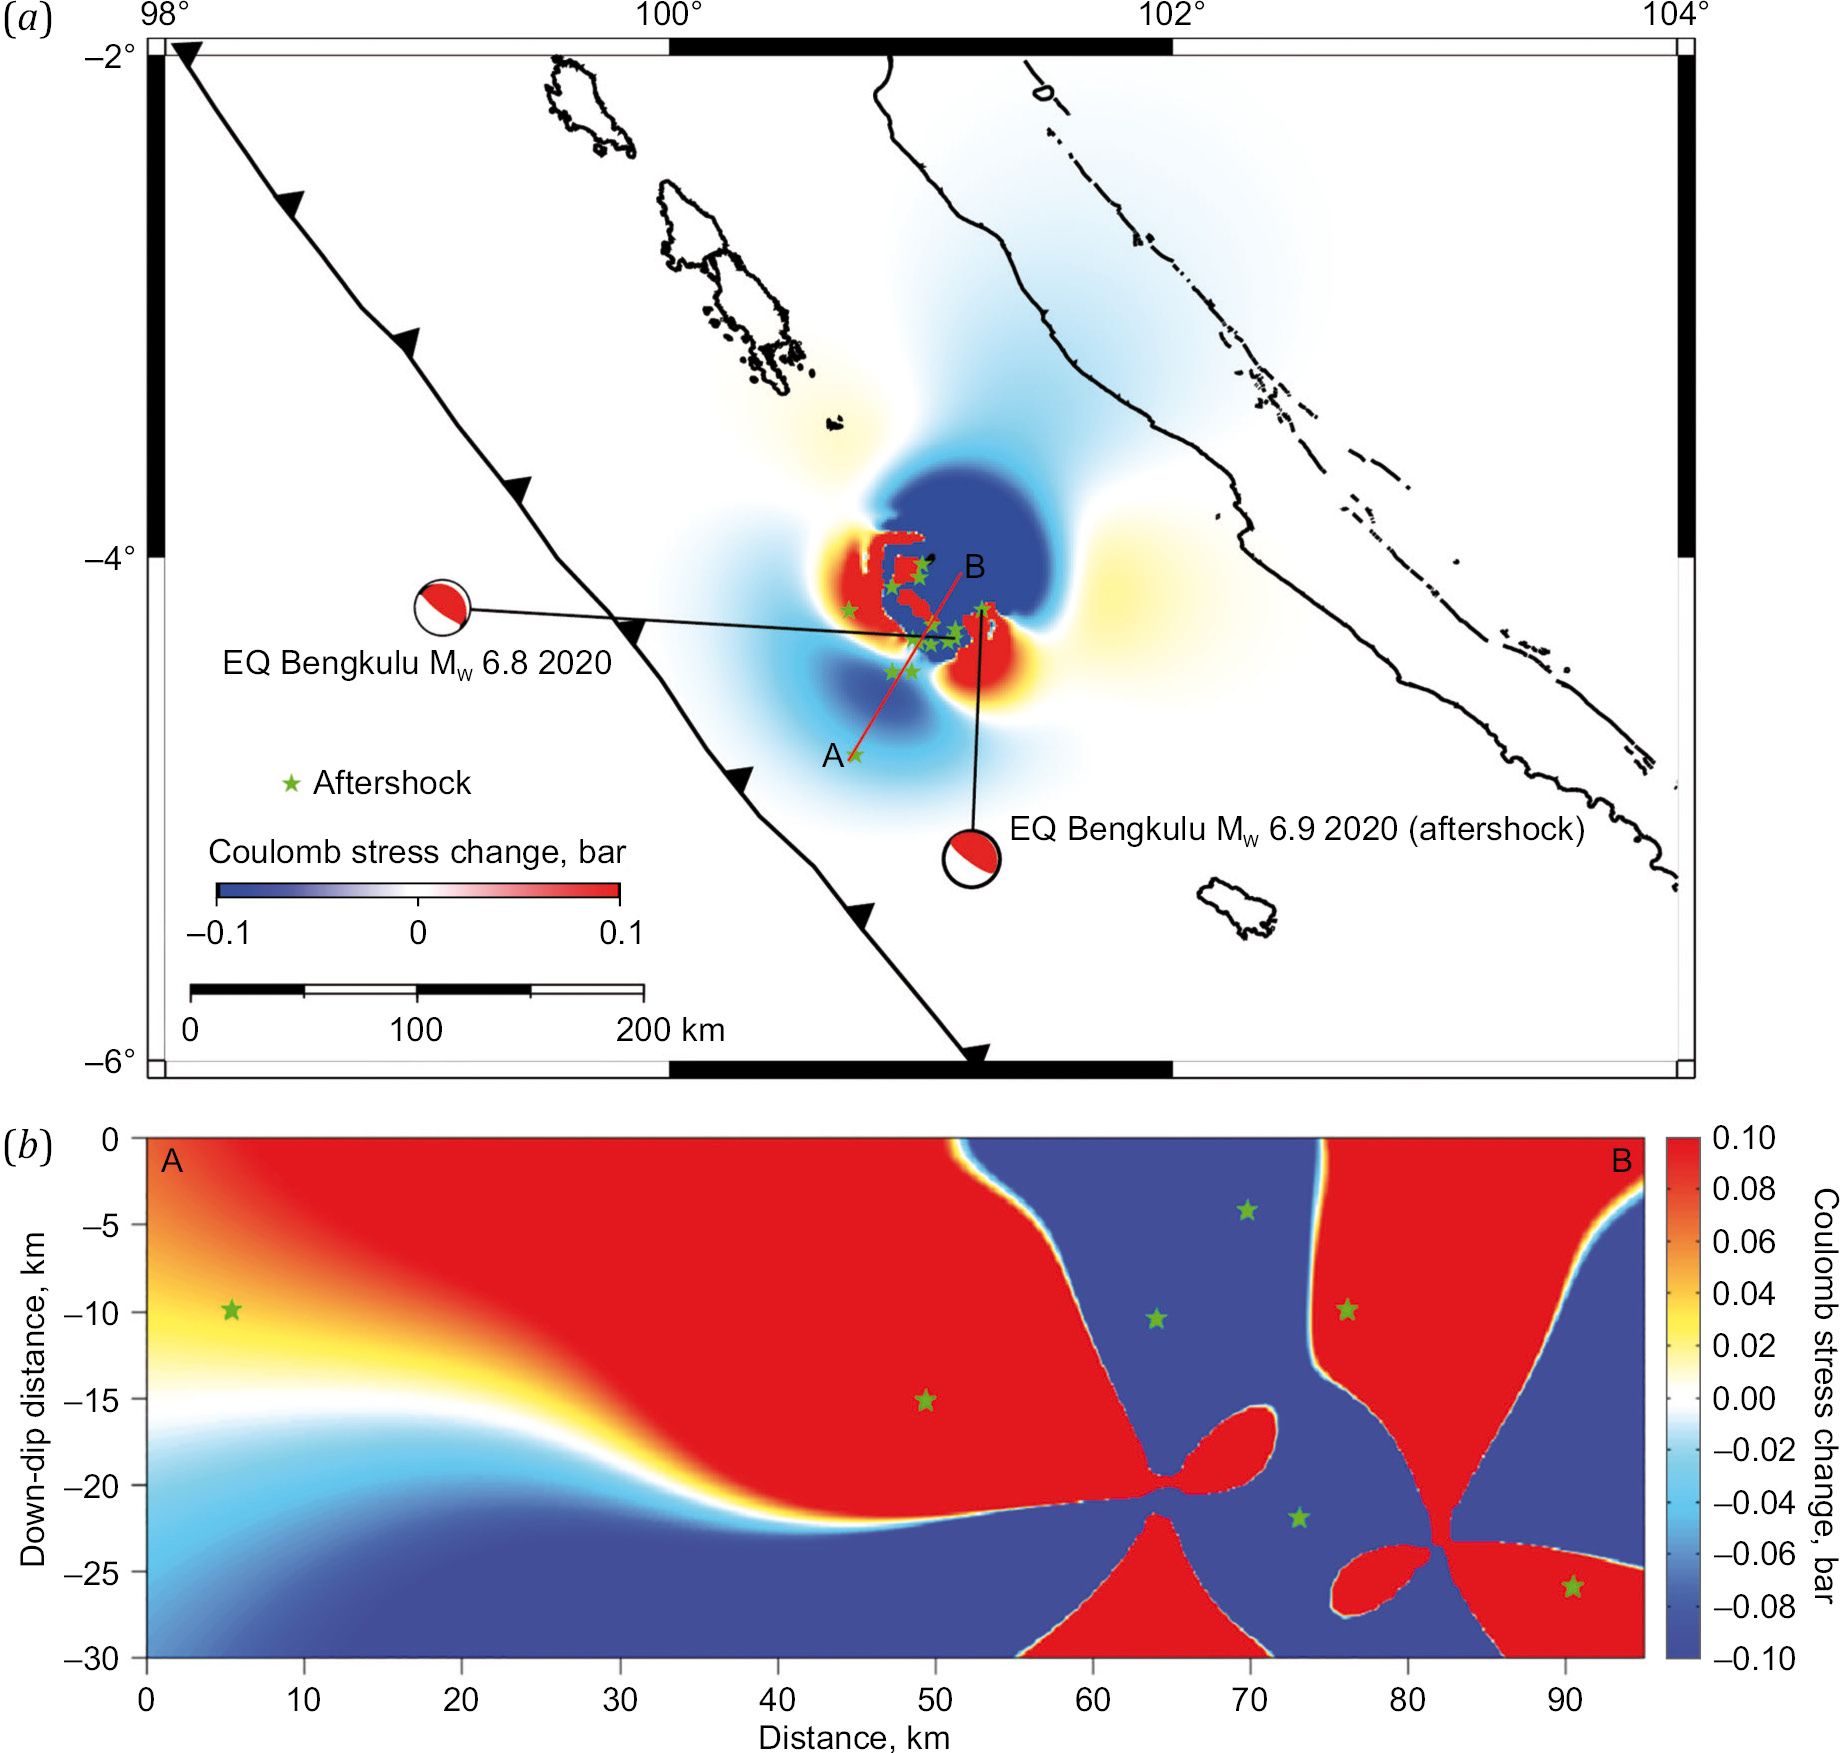
Fig. 4. Coulomb Failure Stress (∆CFS) caused by the August 18, 2020 earthquake.
The epicenter location is determined from USGS data. The green stars represent the aftershock spread from August 18 to August 20, 2020. The focal mechanisms of the mainshock (MW 6.8) and the aftershock (MW 6.9) are shown. The cross-section A–B is detailed in fragment (b).
Рис. 4. Изменение кулоновского напряжения (∆CFS), вызванное землетрясением 18 августа 2020 г.
Местоположение эпицентра установлено по данным USGS. Распространение афтершоков с 18 по 20 августа 2020 г. отмечено зелеными звездочками. Показаны механизмы очага главного толчка (MW 6.8) и афтершока (MW 6.9). Разрез А–B детализирован на фрагменте (b).
Based on the GPS measurements, the coseismic displacement of the August 18, 2020 earthquake was insignificant, less than ~5 mm. The best-fit model is Model 1 with a misfit value of ~0.4 mm, resulting in a seismic moment of 1.73·1019 Nm equivalent to MW 6.76, which is in agreement with the reported USGS results, suggesting a thrusting fault due to the subduction of the Indo-Australian plate. The analysis of broad-band regional seismic-displacement waveforms could highly contribute to the further development of the seismic slip source model in the Bengkulu region, Indonesia.
1. Alif S.M., Anggara O., Jihad M.F., Perdana R.S., 2024. GNSS Velocity and Strain Field in the Northern Sumatra 15 Years After the 2004 M9.2 Sumatra Andaman Earthquake. Geodynamics & Tectonophysics 15 (6), 0798. https://doi.org/10.5800/GT-2024-15-6-0798.
2. Alif S.M., Erlando M.R., Anggara O., Nurhayati M., 2025. Impact of Baseline Length on Uncertainty in Static Relative GNSS Positioning. Journal of Applied Geodesy. https://doi.org/10.1515/jag-2024-0090.
3. Alif S.M., Fattah E.I., Kholil M., Anggara O., 2021. Source of the 2019 Mw 6.9 Banten Intraslab Earthquake Modelled with GPS Data Inversion. Geodesy and Geodynamics 12 (4), 308–314. https://doi.org/10.1016/j.geog.2021.06.001.
4. Altamimi Z., Rebischung P., Métivier L., Collilieux X., 2016. ITRF2014: A New Release of the International Terrestrial Reference Frame Modeling Nonlinear Station Motions. Journal of Geophysical Research: Solid Earth 121 (8), 6109–6131. https://doi.org/10.1002/2016JB013098.
5. Anggara O., Welly T.K., Fauzi A.I., Alif S.M., Perdana R.S., Oktarina S.W., Nuha M.U., Rosadi U., 2023. Monitoring Ground Deformation of Sinabung Volcano Eruption 2018–2019 Using DInSAR Technique and GPS Data. AIP Conference Proceedings 2654 (1), 050012. https://doi.org/10.1063/5.0114428.
6. Ansari K., Walo J., Simanjuntak A.V.H., Wezka K., 2024. Crustal Deformation from GNSS Measurement and Earthquake Mechanism Along Pieniny Klippen Belt, Southern Poland. Arabian Journal of Geosciences 17, 180. https://doi.org/10.1007/s12517-024-11983-8.
7. Bock Y., Prawirodirdjo L., Genrich J., Stevens C., Mccaffrey R., Subarya C., Puntodewo S., Calais E., 2003. Crustal Motion in Indonesia from Global Positioning System Measurements. Journal of Geophysical Research: Solid Earth 108 (В6), 2367. https://doi.org/10.1029/2001JB000324.
8. Chlieh M., Avouac J.P., Sieh K., Natawidjaja D.H., Galetzka J., 2008. Heterogeneous Coupling of the Sumatran Megathrust Constrained by Geodetic and Paleogeodetic Measurements. Journal of Geophysical Research: Solid Earth 113 (В5), B05305. https://doi.org/10.1029/2007JB004981.
9. Dach R., Lutz S., Walser P., Fridez P. (Eds), 2015. Bernese GNSS Software. Version 5.2. University of Bern, 862 p. DOI:10.7892/boris.72297.
10. Dziewonski A.M., Chou T.-A., Woodhouse J.H., 1981. Determination of Earthquake Source Parameters from Waveform Data for Studies of Global and Regional Seismicity. Journal of Geophysical Research: Solid Earth 86 (В4), 2825. https://doi.org/10.1029/JB086iB04p02825.
11. Gunawan E., Kholil M., Widiyantoro S., 2022. Coseismic Slip Distribution of the 14 January 2021 Mamuju-Majene, Sulawesi, Earthquake Derived from GPS Data. Natural Hazards 111, 939–948. https://doi.org/10.1007/s11069-021-05084-y.
12. Gusman A.R., Tanioka Y., Kobayashi T., Latief H., Pandoe W., 2010. Slip Distribution of the 2007 Bengkulu Earthquake Inferred from Tsunami Waveforms and InSAR Data. Journal of Geophysical Research: Solid Earth 115 (В12), B12316. https://doi.org/10.1029/2010JB007565.
13. Hayes G.P., Wald D.J., Johnson R.L., 2012. Slab1.0: A Three-Dimensional Model of Global Subduction Zone Geometries. Journal of Geophysical Research: Solid Earth 117 (B1), B01302. https://doi.org/10.1029/2011JB008524.
14. Heliani L.S., Pratama C., Wibowo A., Sahara D.P., Susilo S., Wibowo S.T., Safii A.N., Prayoga O. et al., 2024. Strain Accumulation in the Mentawai Forearc Sliver, Indonesia, Inferred from Continuous GNSS-Derived Strain Rate. Geodesy and Geodynamics 16 (1), 1–6. https://doi.org/10.1016/j.geog.2024.04.003.
15. Hill E.M., Borrero J.C., Huang Z., Qiu Q., Banerjee P., Natawidjaja D.H., Elosegui P., Fritz H.M. et al., 2012. The 2010 MW 7.8 Mentawai Earthquake: Very Shallow Source of a Rare Tsunami Earthquake Determined from Tsunami Field Survey and Near-Field GPS Data. Journal of Geophysical Research: Solid Earth 117 (В6), B06402. https://doi.org/10.1029/2012JB009159.
16. Irsyam M., Widiyantoro S., Natawidjaja D.H., Meilano I., Rudyanto A., Hidayati S., Triyoso W., Hanifa N.R., Djarwadi D., Faizal L., Sunarjito (Eds), 2017. Peta Sumber dan Bahaya Gempa Indonesia Tahun 2017. Bandung, 376 p.
17. Ishibe T., Ogata Y., Tsuruoka H., Satake K., 2017. Testing the Coulomb Stress Triggering Hypothesis for Three Recent Megathrust Earthquakes. Geoscience Letters 4, 5. https://doi.org/10.1186/s40562-017-0070-y.
18. King G.C.P., Stein R.S., Lin J., 1994. Static Stress Changes and the Triggering of Earthquakes. Bulletin of the Seismological Society of America 84 (3), 935–953. DOI:10.1785/BSSA0840030935.
19. Konca A.O., Avouac J.P., Sladen A., Meltzner A.J., Sieh K., Fang P., Li Z., Galetzka J. et al., 2008. Partial Rupture of a Locked Patch of the Sumatra Megathrust During the 2007 Earthquake Sequence. Nature 456, 631–635. https://doi.org/10.1038/nature07572.
20. Li L., Huang Z., 2013. Slip Distribution of the 2010 Mentawai Earthquake from Inversion of Tsunami Waveforms and Tsunami Field Survey Data. In: Proceedings of the 7th International Conference on Asian and Pacific Coasts (September 24–26, 2013). Bali, Indonesia, p. 758–763.
21. Lubis A.M., Hashima A., Sato T., 2013. Analysis of Afterslip Distribution Following the 2007 September 12 Southern Sumatra Earthquake Using Poroelastic and Viscoelastic Media. Geophysical Journal International 192 (1), 18–37. https://doi.org/10.1093/gji/ggs020.
22. Lukhnev A.V., Lukhneva O.F., Sankov V.A., Miroshnichenko A.I., 2022. Coseismic Effects of the 11 January 2021 Hovsgol, Mongolia, Earthquake. Geodynamics & Tectonophysics 13 (2), 0626 (in Russian) https://doi.org/10.5800/GT-2022-13-2s-0626.
23. Natawidjaja D.H., Sieh K., Chlieh M., Galetzka J., Suwargadi B.W., Cheng H., Edwards R.L., Avouac J.-Ph., Ward S.N., 2006. Source Parameters of the Great Sumatran Megathrust Earthquakes of 1797 and 1833 Inferred from Coral Microatolls. Journal of Geophysical Research: Solid Earth 111 (В6), B06403. https://doi.org/10.1029/2005JB004025.
24. Newcomb K., McCann W., 1987. Seismic History and Seismotectonics of the Sunda Arc. Journal of Geophysical Research: Solid Earth 92 (B1), 421–439. https://doi.org/10.1029/JB092iB01p00421.
25. Okada Y., 1992. Internal Deformation Due to Shear and Tensile Faults in a Half-Space. Bulletin of the Seismological Society of America 82 (2), 1018–1040. https://doi.org/10.1785/BSSA0820021018.
26. Okada Y., Nishimura T., 2025. Investigation on Short-Term Slow Slip Events in the Northeast Japan Subduction Zones Using Decadal GNSS Data. Earth, Planets and Space 77, 45. https://doi.org/10.1186/s40623-025-02175-z.
27. Prawirodirdjo L., McCaffrey R., Chadwell C.D., Bock Y., Subarya C., 2010. Geodetic Observations of an Earthquake Cycle at the Sumatra Subduction Zone: Role of Interseismic Strain Segmentation. Journal of Geophysical Research: Solid Earth 115 (В3), B03414. https://doi.org/10.1029/2008JB006139.
28. Stamps D.S., Flesch L.M., Calais E., Ghosh A., 2014. Current Kinematics and Dynamics of Africa and the East African Rift System. Journal of Geophysical Research: Solid Earth 119 (6), 5161–5186. https://doi.org/10.1002/2013JB010717.
29. Tanaka Yu., Ohta Yu., Miyazaki Sh., 2019. Real-Time Coseismic Slip Estimation via the GNSS Carrier Phase to Fault Slip Approach: A Case Study of the 2016 Kumamoto Earthquake. Geophysical Research Letters 46 (3), 1367–1374. https://doi.org/10.1029/2018GL080741.
30. Tin T.Z.H., Nishimura T., Hashimoto M., Lindsey E.O., Aung L.T., Min S.M., Thant M., 2022. Present-Day Crustal Deformation and Slip Rate Along the Southern Sagaing Fault in Myanmar by GNSS Observation. Journal of Asian Earth Sciences 228, 105125. https://doi.org/10.1016/j.jseaes.2022.105125.
31. Toda S., Stein R.S., Sevilgen V., Lin J., 2011. Coulomb 3.3. Graphic-Rich Deformation and Stress-Change Software for Earthquake, Tectonic, and Volcano Research and Teaching. User Guide. USGS Open-File Report 2011–1060. 63 p.
32. Tozer B., Sandwell D.T., Smith W.H.F., Olson C., Beale J.R., Wessel P., 2019. Global Bathymetry and Topography at 15 Arc Sec: SRTM15+. Earth and Space Science 6 (10), 1847–1864. https://doi.org/10.1029/2019EA000658.
33. Tsang L.L.H., Hill E.M., Barbot S., Qiu Q., Feng L., Hermawan I., Banerjee P., Natawidjaja D.H., 2016. Afterslip Following the 2007 Mw 8.4 Bengkulu Earthquake in Sumatra Loaded the 2010 Mw 7.8 Mentawai Tsunami Earthquake Rupture Zone. Journal of Geophysical Research: Solid Earth 121 (12), 9034–9049. https://doi.org/10.1002/2016JB013432.
34. Wang L., Wang R., Roth F., Enescu B., Hainzl S., Ergintav S., 2009. Afterslip and Viscoelastic Relaxation Following the 1999 M 7.4 İzmit Earthquake from GPS Measurements. Geophysical Journal International 178 (3), 1220–1237. https://doi.org/10.1111/j.1365-246X.2009.04228.x.
35. Wang R., Diao F., Hoechner A., 2013. SDM-A Geodetic Inversion Code Incorporating with Layered Crust Structure and Curved Fault Geometry. In: Geophysical Research Abstracts of the General Assembly Conference (7–12 April, 2013, Vienna, Austria). Vol. 15. EGU2013-2411.
36. Wessel P., Smith W.H.F., Scharroo R., Luis J., Wobbe F., 2013. Generic Mapping Tools: Improved Version Released. Eos 94 (45), 409–410. https://doi.org/10.1002/2013EO450001.
37. Xiang Yu., Yue J., Wang H., Chen Yu., 2024. GNSS Imaging Coseismic and Postseismic Slip Associated with the 2021 M 8.2 Chignik, Alaska Earthquake. Tectonophysics 876, 230273. https://doi.org/10.1016/j.tecto.2024.230273.
38. Xu X., Sandwell D.T., Klein E., Bock Y., 2021. Integrated Sentinel-1 InSAR and GNSS Time-Series Along the San Andreas Fault System. Journal of Geophysical Research: Solid Earth 126 (11), e2021JB022579. https://doi.org/10.1029/2021JB022579.
39. Zhang H., Chen J., Ge Z., 2012. Multi-Fault Rupture and Successive Triggering During the 2012 Mw 8.6 Sumatra Offshore Earthquake. Geophysical Research Letters 39 (22), L22305. https://doi.org/10.1029/2012GL053805.
40. Zheng Z., Jin Sh., Fan L., 2018. Co-Seismic Deformation Following the 2007 Bengkulu Earthquake Constrained by GRACE and GPS Observations. Physics of the Earth and Planetary Interiors 280, 20–31. https://doi.org/10.1016/j.pepi.2018.04.009.
South Lampung 35365
Bandung 40132
South Lampung 35365
Bogor
Anggara O., Meilano I., Alif S., Susilo S. COSEISMIC SLIP DISTRIBUTION OF THE 2020 Mw 6.8 BENGKULU EARTHQUAKE DERIVED FROM THE GNSS OBSERVATIONS. Geodynamics & Tectonophysics. 2025;16(4):0839. https://doi.org/10.5800/GT-2025-16-4-0839. EDN: HITSKS


Editor-in-Chief
Sklyarov E.V.664033, Irkutsk, Lermontova St., 128,
IEC SB RAS Institute of the Earth's crust
E-mail.: gt@crust.irk.ru
tel.: 8 3952 425422
Processing of personal data


