


Contents
Scroll to:
https://doi.org/10.5800/GT-2025-16-3-0830
EDN: aizyrw
Scroll to:
This study investigates the configuration of sedimentary basin in Lampung area, the southeastern part of the Sumatra Island, using integrated gravity and seismic data. This research aims to enhance the understanding of sedimentary basin structures, focusing on the identification and delineation of sub-basins, basement highs, and fault systems. Gravity data analysis, including Bouguer anomaly mapping and spectral analysis, was used to estimate the depth of sedimentary layers and the configuration of the basement. Seismic data provided direct observations of subsurface reflectors, aiding in the identification of fault structures and stratigraphic continuity. The integration of both datasets allowed for the creation of a detailed geological model of the basin, supported by well log data from wells LPG-1, LPG-2, and LPG-3.
The study identified seven major sedimentary sub-basins, among which are Negara Batin, Menggala, East Menggala, Terbanggi, Metro, and Kotabumi. Forward modeling results indicate that the Terbanggi sub-basin is the deepest, with a maximum depth of approximately 3 kilometers. The presence of volcanic material, particularly tuffaceous sandstone and tuff breccia in the Lower Lahat and Baturaja formations, was confirmed through well and seismic data, highlighting the interaction between volcanic and sedimentary processes in the basin’s evolution. This integrated approach provides a more accurate understanding of the basin’s geometry and structural features, offering valuable insights into the tectonic history of the region.
The findings contribute to future geological studies and exploration efforts, demonstrating the effectiveness of combining gravity and seismic data in analyzing complex subsurface environments.
Febriansanu D.R., Husein S., Surjono S.S. IDENTIFICATION OF LAMPUNG SEDIMENTARY BASIN (SE SUMATRA) USING GRAVITY FORWARD MODELING AND SEISMIC INTERPRETATION. Geodynamics & Tectonophysics. 2025;16(3):0830. https://doi.org/10.5800/GT-2025-16-3-0830. EDN: aizyrw
The South Sumatra Basin, a Tertiary hydrocarbon-producing basin on the Sumatra’s east coast, extends into Lampung province [Amin et al., 1993; Gafoer et al., 1993; Kusnama, Panggabean, 2009; Panggabean, Santy, 2012; Pulunggono, 1992; Williams et al., 1995; Wiyanto et al., 2009]. Recent findings indicate that it is bounded by the Saka and Lampung highlands, discontinuing in southern Lampung [Sedimentary Basin..., 2022].
Horsts and grabens within the South Sumatra Basin contain rift deposits of the Lahat and Lemat formations, formed in fluvial to lacustrine environments during the Middle Eocene – Late Oligocene [Barber et al., 2005; Sarjono, Sardjito, 1989]. Subsequent subsidence in the Late Oligocene led to sag basin formation and sedimentation from the Bukit Barisan volcanic arc. Marine transgression in the Miocene deposited the Gumai, Baturaja, and Talangakar formations and was followed by uplift and inversion tectonics in the Pliocene. The Quaternary period experienced volcanic eruptions depositing basalt, andesite, and tuff, unconformably overlying older formations [Amin et al., 1993].
In Lampung Province, the Bandarjaya and Negara Batin sub-basins, considered part of the South Palembang sub-basin, are separated by structural highs, such as the Meraksa Kuang and Ogan [Ginger, Fielding, 2005; Pulunggono, 1992]. In [Williams et al., 1995] describe the Bandarjaya Basin as a series of grabens, while [Wiyanto et al., 2009] consider the Negara Batin as a separate sub-basin.
This study analyses the Lampung sedimentary basin’s configuration using 2D seismic and gravity data. Regional and residual gravity anomalies were separated to map basin structure, and 2D forward modeling was applied to create a subsurface geological model [Araffa et al., 2021; Dani et al., 2024; Frifita et al., 2020; Osorio-Granada et al., 2022; Sarkowi et al., 2021; Setiadi et al., 2010]. Seismic interpretation, integrated with well log data, refines understanding of the basin structure, fault patterns, and sediment continuity.
This study investigates the Lampung sedimentary basin using gravity and seismic datasets. Data processing and analysis were conducted using Geosoft Oasis Montaj software, applying minimum curvature interpolation to smoothed data representation [Geosoft..., 2024]. The Bouguer anomaly data were filtered using low-pass and high-pass filters to extract regional and local anomaly patterns [Araffa et al., 2021; Zakariah et al., 2021]. Spectral analysis was performed to estimate anomaly depths, particularly the sediment-basement contact, serving as a reference for 2D forward modeling [Frifita et al., 2020]. Second Vertical Derivative (SVD) analysis was applied to enhance geologic anomaly detection and fault identification [Dani et al., 2024].
Gravity data were sourced from the TOPEX dataset (University of California, San Diego) with a 1.85 km resolution and supplemented by GGMPlus data (220 m resolution) [Camacho, Alvarez, 2021] for higher accuracy in selected cross-sections. The study area spans 15.950 km², covering central and northern Lampung Province (Fig. 1).

Fig. 1. Simplified tectonic elements in the Lampung Basin (based from [Pulunggono, 1992; Williams et al., 1995]) and study area (thick black box). Basemap for gravity data collection (right map) covering the central and northern parts of Lampung Province.
Рис. 1. Упрощенная схема тектонических элементов бассейна Лампунг (по [Pulunggono, 1992; Williams et al., 1995]) и изучаемой территории (черный прямоугольник). Карта-схема сбора гравиметрических данных (справа), охватывающая южную и центральную часть провинции Лампунг.
Data preprocessing included terrain correction and Bouguer anomaly calculations, as well as the FAA corrections for tides, drift, and latitude. The TOPEX gravity data error ranges from 1.5 to 2.22 meters or from 5 to 10 mGal [Solheim, 1995; Tapley, Rosborough, 1985]. The Parasnis method was used to estimate surface density [Parasnis, 1986], with the further Bouguer correction applied thereto to to adjust for terrain and elevation variations.
SVD analysis has been employed since the 1950s to enhance the quality of gravity data by emphasizing shallow geologic anomalies while suppressing regional trends. Traditionally performed using predefined spatial domain templates [Elkins, 1951], SVD plays a crucial role in gravity interpretation, particularly in fault identification [Wahyudi et al., 2017] and hydrocarbon prospecting [Kadir et al., 2013]. SVD analysis, applied to enhance gravity data interpretation, emphasized local faults and structural discontinuities [Aku, 2014]. The Talwani modeling method [Talwani et al., 1959] iteratively improved the basin’s subsurface structural model, constrained by seismic interpretations, residual anomalies, and SVD-derived structural trends. This integration reduced ambiguity and enhanced the accuracy of the geological model [Grandis, 2022].
2D seismic and well log data obtained from PUSDATIN (Indonesian Ministry of Energy & Mineral Resources). The seismic dataset includes two sections: LPG-A & LPG-B (W-E direction), while well data consists of three exploration wells (LPG-1, LPG-2, LPG-3) (Fig. 1; Table 1). Seismic interpretation, in conjunction with gravity modeling, was used to delineate subsurface structures, fault systems, and stratigraphic continuity.
The interpretation of seismic profiles (A-A' and B-B') was conducted through horizon correlations with drilling well data. The LPG-1 and LPG-2 wells were correlated with seismic LPG-A, while the LPG-3 well was associated with seismic LPG-B. Well-seismic tie analysis, using density logs, helped to refine structural interpretations and depth constraints.
Table 1. Simplified lithological interpretation of log data from wells LPG-1, LPG-2 and LPG-3
Таблица 1. Упрощенная литологическая интерпретация каротажа скважин LPG-1, LPG-2 и LPG-3
|
No |
Well |
Formation |
Lithology |
|
1 |
LPG-1 |
Kasai (KAF) |
Interbedded sand and shale, with dominant tuff in upper section. Deposited in volcanoclastic environment. |
|
Muaraenim (MEF) |
Interbedded shale and sandstone. Deposited in deltaic environment. |
||
|
Air Benakat (ABF) |
Interbedded shale and sandstone with marine influence. Deposited in deltaic environment. |
||
|
Gumai (GUF) |
Interbedded shale and marine sandstone in upper section; calcareous sandstone rich of foraminifera planktonic in lower section. Deposited in neritic (middle shelf – prodelta) environment. |
||
|
Baturaja (BRF) |
Reef limestone (grainstone - packstone). Deposited in neritic (Inner shelf/carbonate platform) environment. |
||
|
Talangakar (TAF) |
Sandstone with clay and coal intercalation. Deposited in deltaic environment. |
||
|
Upper Lahat (ULAF) |
Interbedded of shale and sandstone with coal. Deposited in fluvio-lacustrine environment. |
||
|
Lower Lahat (LLAF) |
Dominantly shale in upper section. Interbedded of sandstone and claystone with tuffaceous matrix in middle section. Tuff and shale with thin coal bed in lower section. Deposited in lacustrine (upper section) and fluvio-lacustrine (middle and lower environment). |
||
|
Basement |
Green schist with calcite vein |
||
|
2 |
LPG-2 |
Kasai (KAF) |
Interbedded sand and shale, with intercalation of tuff. Deposited in volcanoclastic environment. |
|
Muaraenim (MEF) |
Predominantly sandstone with intercalation of shale and lignite. Deposited in deltaic environment. |
||
|
Air Benakat (ABF) |
Interbedded shale and sandstone with marine influence. Deposited in deltaic environment. |
||
|
Gumai (GUF) |
Interbedded shale and marine sandstone. Deposited in neritic environment. |
||
|
Baturaja (BRF) |
Reef limestone with strong influence of volcanic, as tuff breccia deposited in middle section. Deposited in neritic (inner shelf/carbonate platform) with volcanic influence environment. |
||
|
Basement |
Green schist with calcite vein |
||
|
3 |
LPG-3 |
Kasai (KAF) |
Predominantly tuffaceous sandstone with intercalation of shale. Deposited in volcanoclastic environment. |
|
Muaraenim (MEF) |
Interbedded shale and sandstone. Deposited in volcanoclastic environment. |
||
|
Air Benakat (ABF) |
Interbedded shale and sandstone with marine influence. Deposited in deltaic environment. |
||
|
Gumai (GUF) |
Interbedded shale and marine sandstone in upper section; calcareous mudstone in lower section. Deposited in Neritic (Middle Shelf) environment. |
||
|
Baturaja (BRF) |
Reef limestone with abundant of coral, molusca and forams. Deposited in neritic (Inner shelf/carbonate platform) environment. |
||
|
Talangakar (TAF) |
Conglomerate in upper section, sandstone with intercalation of shale and coal in lower section. Deposited in deltaic environment. |
||
|
Upper Lahat (ULAF) |
Interbedded of shale and sandstone. Deposited in fluvio-lacustrine environment. |
||
|
Lower Lahat (LLAF) |
Predominantly shale with sandstone in upper section. Sandstone with intercalation of claystone with bed of coal in middle section. Tuffaceous sandstone interbedded with claystone in lower section. Deposited in lacustrine and fluvio-lacustrine (upper – middle section) and fluvio-lacustrine (lower section) environment. |
Bouguer gravity anomaly data, collected at 200 m intervals using Geosoft Oasis Montaj software, ranged from 10 to 100 mGal and was categorized into high (60–100 mGal), medium (40–60 mGal), and low (10–40 mGal) values (Fig. 2). These variations indicate subsurface density differences, influencing the basin configuration.

Fig. 2. Complete Bouguer anomaly map of the study area.
Рис. 2. Полная карта аномалий Буге изучаемой территории.
The initial Bouguer anomaly map lacked clear geological structure delineation due to subsurface heterogeneity. To enhance interpretation, regional and residual anomaly separation was performed using Fast Fourier Transform (FFT) analysis [Harrison, Dickinson, 1989; Zakariah et al., 2021]. The log power spectrum of the gravity data (Fig. 3) was generated by applying the FFT to the spatial gravity profile. In this spectrum, distinct linear segments corresponding to different wavelength domains were identified, representing sources at different depth levels [Dhaoui et al., 2014]. The slope of each segment in the log power spectrum provided a basis for distinguishing between deep-seated regional trends, intermediate residual structures, and shallow or noise-dominated signals. The spectral analysis-derived cut-off values were 6.145 km for regional anomalies and 2.408 km for residual anomalies (see Fig. 2); the bandpass filter was then applied to distinguish between long-wavelength regional trends and shorter-wavelength local structures.

Fig. 3. Spectrum analysis chart results.
Рис. 3. График результатов спектрального анализа.
The regional anomaly map (20–70 mGal) (Fig. 4) revealed high anomalies (55–70 mGal) in the south-central and north-central regions, indicating bedrock uplifts and shallower Moho depths. Low anomalies (20–35 mGal), especially in the western and southwestern areas, correspond to the Bukit Barisan Mountains’ isostatic effect [Setiadi et al., 2010]. Residual anomalies, obtained by subtracting regional anomalies from Bouguer anomalies, exposed shallower structures, including sedimentary basin configurations (Fig. 5). The residual anomaly map highlighted basin orientations, predominantly north-south and northwest-southeast, aligning with regional tectonic trends. Еру tectonic features such as faults and horsts, defining sub-basin boundaries.

Fig. 4. Regional anomaly map of the study area.
Рис. 4. Региональная карта аномалий изучаемой территории.

Fig. 5. Residual anomaly map in the study area.
Рис. 5. Карта остаточных аномалий изучаемой территории.
To refine structural interpretations, SVD analysis was applied using Laplace’s equation [Alhassan, Aliyu, 2022], enhancing local anomaly detection (Fig. 6). SVD maps, generated via minimum curvature map method in Geosoft Oasis Montaj, delineated structural geology lineament at 0 mGal/m² [Aku, 2014]. The correlation between SVD-derived lineaments and residual anomalies confirmed the fault-controlled basin formation. The results of the lineament analysis will be combined with the geological structure analysis from seismic data and used as a control parameter in forward modeling.

Fig. 6. SVD map and structural lineament analysis (a) and overlay between structural lineament analysis and residual anomaly map (b).
Рис. 6. Карта вторых вертикальных производных и структурный анализ линеаментов (a), а также наложение анализа структурного линеамента на карту остаточных аномалий (b).
Generally, two geological fault trends can be observed. First, there is a continuity of faults trending relatively northwest-southeast and interpreted as normal faults [Pulunggono, 1992] stated that the Upper Cretaceous – Lower Tertiary north-south lineaments in the southeastern Sumatra were subject to extension, with the SW-NE trendings normal faults resulted in horst and graben topography. Second, the west-east trending faults are interpreted as a result of dextral strike-slip faulting [Siringoringo et al., 2023] or as those influenced by the pre-Tertiary structures within the basement rocks of Sumatra [Pulunggono, 1992]. The presence of southwest-northeast fault structures can be validated by the SVD analysis. In addition to these two southwest-northeast faults, the SVD analysis also indicates faults having relative east-west orientation.
Forward modeling was conducted using residual anomaly basemap sections. Three representative sections of the study area were modeled: A, B, and C (Fig. 7). The NE-SE-oriented Section A exhibits the basin’s general configuration and northern and southern basin boundaries. The west-east oriented Section B intersects wells LPG-1 and LPG-2, and seismic line LPG-A. The west-east oriented Section C intersects well LPG-3 and seismic line LPG-B. This 2D forward modeling was divided into basement complex and seven sedimentary units, including Upper & Lower Lahat, Talangakar, Baturaja, Gumai, Air Benakat, Muaraenim, and Kasai formations. The density of the basement and sedimentary units was estimated from the average sedimentary rock density within the study area [Telford et al., 1990, Table 2].
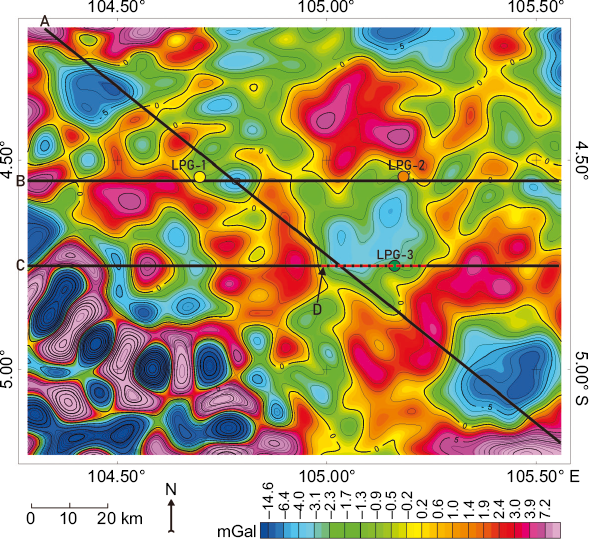
Fig. 7. Location of forward modeling Section A, B, C and D (GGMPlus, red stripped lines) towards of residual anomaly map.
Рис. 7. Положение модельных разрезов A, B, C and D (GGMPlus, красные пунктирные линии) относительно карты остаточных аномалий.
Table 2. The average density values from the basement complex and each sedimentary unit
Таблица 2. Значения средней плотности комплекса пород фундамента и каждой осадочной толщи
|
No |
Formation |
Density (g/cm³) |
Lithology (in general) |
|
1 |
Kasai (KAF) |
2.00 |
Volcanic (tuff) |
|
2 |
Muaraenim (MEF) |
2.30 |
Shale |
|
3 |
Air Benakat (ABF) |
2.33 |
Sandstone |
|
4 |
Gumai (GUF) |
2.48 |
Shale |
|
5 |
Baturaja (BRF) |
2.41 |
Limestone |
|
6 |
Talangakar (TAF) |
2.44 |
Sandstone |
|
7 |
Upper & Lower Lahat (ULAF & LLAF) |
2.40 |
Shale |
|
8 |
Basement |
2.70 |
Schist |
Fig. 8 shows the forward modeling results for Section A, oriented northwest-southeast. Based on the regional stratigraphy, Section A consists of a basement complex and seven sedimentary units, as detailed in Table 2. This model provides valuable insights into the layering and composition of geological structures beneath the surface, enhancing our understanding of the spatial distribution and characteristics of different rock types. The subsurface modeling involved aligning field data with theoretical models to produce a curve that reflects observation points with minimal fitting errors.

Fig. 8. Forward modeling results for Section A.
Рис. 8. Результаты моделирования разреза А.
The observed data (black dots) closely match the calculated models (black lines), with a minimal gravity curve error of 0.776 (Fig. 8), supporting a robust geological interpretation. Additionally, this section outlines the subsurface configuration of the sedimentary basin, characterized by a major basin and several sub-basins separated by horsts. The northwestern area of Section A exhibits a basement high, which may serve as the boundary of this sedimentary basin. This basement high is called Meraksa Kuang High by in [Pulunggono, 1992] and [Ginger, Fielding, 2005]. At the southeastern boundary of Section A, the Lampung Highlands [Amin et al., 1993] mark the eastern boundary of this sedimentary basin. Fault structures significantly influence the formation of these sub-basins, with the basin thickness reaching up to 3 km.
Fig. 9 displays the forward modeling results for west-east oriented Section B. The observed data (black dots) closely match the calculated models (black lines), with a minimal gravity curve error of 1.146, supporting a robust geological interpretation. In the bottom panel graph, seismic profile shows subsurface structures from the reflected waves. Wells LPG-1 and LPG-2 represent the location of wells that penetrate through different sedimentary units.

Fig. 9. Forward modeling results for Section B correlated with seismic section LPG-A.
Рис. 9. Результаты моделирования разреза В, коррелирующего с сейсмическим разрезом LPG-A.
This section exhibits the Negara Batin, Menggala, and East Menggala sub-basins, constrained by normal faults (Fig. 9). Negara Batin sub-basin has a maximum depth of 2.2–2.3 km, confirmed by LPG-1 well data (basement penetrated at 2300 m). The Menggala sub-basin has a maximum depth of 1.2 km, confirmed by LPG-2 well data. LPG-2 well penetrated basement at 800 m, not at the basin’s depocenter but still indicating local depth variations. The East Menggala sub-basin has a maximum estimated depth of 1.5–1.6 km. None of the wells in this sub-basin have penetrated the basement. However, based on the margin of error for the gravity data and the correlation of basement depths in the other two sub-basins, it can be concluded that the depth of the East Menggala sub-basin is valid.
Fig. 10 shows the forward modeling results for west-east oriented Section C with an error value of 2.045. This gravity data-based section shows a high land in the western part and several sub-basins. We believe the western part of this section is the Bukit Barisan Mountain region or basement complex with high anomaly value (see Fig. 7). These sub-basins correspond to those seen on seismic line LPG-B. Due to the correlation between the forward modeling of Section C and the seismic section of LPG-B, the sedimentary sub-basins are clearly defined therein. Among them is the Terbanggi sub-basin, bounded by the normal fault-controlled basement high. Based on the forward modeling results, the Terbanggi sub-basin has a maximum depth ranging from 2.7 to 2.8 km. This is supported by the data from well LPG-3, which, at a depth of 2.742 meters, has not penetrated the basement yet. At this depth, well LPG-3 still penetrates the sedimentary succession of the Lower Lahat formation.

Fig. 10. Forward modeling results for Section C correlated with seismic section LPG-B.
Рис. 10. Результаты моделирования разреза С, коррелирующего с сейсмическим разрезом LPG-A.
This study integrates seismic interpretation, gravity data analysis, and forward modeling to delineate sub-basins within the Lampung sedimentary basin. The time structure map (Fig. 11) identifies seven sedimentary sub-basins whose correlation, derived from model sections A, B, and C, allows comparing sub-basins 1, 2 and 3, clearly defined in Section B (see Fig. 9).

Fig. 11. Time structure map from seismic interpretation show several sedimentary sub-basins have been identified.
Рис. 11. Карта изохрон на основе интерпретации сейсмических данных, с несколькими суббассейнами.
Sub-basin 1 corresponds to the Negara Batin, sub-basin 2 – to the Menggala, and sub-basin 3 – to the East Menggala. Sub-basins 4 and 5 can be seen both on the time-structure map and the seismic line LPG-B, where they are separated by a horst structure. Model section C does not exhibit the horst structure, which is likely due to low TOPEX data resolution (1.8 km). In connection to this, forward modeling for Section D was conducted using GGMplus gravity data, which offers a high resolution of 200 m [Camacho, Alvarez, 2021]. Forward modeling Section D was conducted using residual anomaly map from GGMPlus gravity data (Fig. 12). The GGMplus data successfully identified the horst separating the two basins (Fig. 13), with a low error value of 0.158. This interpretation was validated by seismic line LPG-B (Fig. 13, bottom), confirming the presence of the horst and basin structures. It is concluded that sedimentary basins 4 and 5 are separated by a horst. Sub-basins 4 and 5 correspond to the Terbanggi sub-basin. Sub-basin 6 (Kotabumi) is visible in Section A and on the time structure map, while sub-basin 7 (Metro) is identified solely on the time structure map.

Fig. 12. GGMPlus anomaly map. The black stripped lines show forward modeling Section D.
Рис. 12. Карта аномалий GGMPlus. Черным пунктиром показан модельный разрез D.

Fig. 13. Forward modeling results for Section D (GGMPlus) correlated with seismic section LPG-B.
Рис. 13. Модельный разрез D (GGMPlus), коррелирующий с сейсмическим разрезом LPG-B.
Table 3 summarizes sub-basin dimensions, with lengths and widths derived from distance measurements and thicknesses estimated based on forward modeling and well data. The maximum depth of the East Menggala, Kotabumi, and Metro sub-basins is inferred solely from forward modeling, as no well data is available.
Table 3. The dimensions of basin-constituent sub-basins
Таблица 3. Размеры суббассейнов, входящих в состав бассейна
|
No. |
Sub-basin |
Length, km |
Wide, km |
Max thickness, km |
Area, km² |
|
1 |
Negara Batin |
17.80 |
8.90 |
2.3 |
158.420 |
|
2 |
Menggala |
11.04 |
13.05 |
1.2 |
144.072 |
|
3 |
East Menggala |
15.96 |
8.76 |
1.6 |
139.8096 |
|
4 |
Terbanggi A |
21.46 |
11.65 |
3.0 |
250.009 |
|
5 |
Terbanggi B |
21.33 |
8.56 |
3.0 |
182.5848 |
|
6 |
Metro |
15.84 |
12.20 |
– |
193.248 |
|
7 |
Kotabumi |
11.54 |
9.20 |
– |
106.168 |
A prior study [Sarkowi et al., 2021], based solely on the gravity data (Bouguer anomaly and 2.5D modeling), identified 18 hydrocarbon sub-basins with Bouguer anomaly values ranging from 0 to 90 mGal. This study builds upon that work through integration of the gravity and seismic data, leading to a more refined and precise sub-basin delineation. While gravity data alone inferred subsurface structures, seismic data provided direct observations of faults and stratigraphic continuity, yielding a clearer sub-basin geometry definition. For example, the Terbanggi sub-basin, previously identified through gravity analysis, is now confirmed through seismic data, offering a more accurate depth estimate (up to 3 km) and a better understanding of the sub-basin-bordering fault systems. Both studies emphasize fault structures as a key control in sub-basin formation. The previous study inferred fault zones using gravity gradients and spectral analysis, while faults are mapped through seismic reflection profiling, which reveals the presence of horst and graben structures in the Terbanggi and Menggala sub-basins.
Notably, the presence of volcanic materials such as tuffaceous sandstone and tuff breccia in the Lower Lahat formation is confirmed through wells LPG-1 and LPG-3, and in the Baturaja formation – through well LPG-2. These findings confirm episodic volcanic activity influencing sedimentary processes and thus contributing to sediment fluxes and basin architecture. Fault-controlled sedimentary systems likely interacted with volcanic inputs, impacting depositional environments and basin evolution. Moreover, these volcanic deposits offer insight into source-to-sink relationships, where the proximity to Bukit Barisan volcanic arcs influenced sedimentary composition. This underscores the complex interplay between tectonics, sedimentation, and magmatism in shaping the Lampung sedimentary basin.
The integration of seismic and gravity data significantly improves resolution compared to gravity data alone. While the earlier study estimated basement depths at 2.4 to 4.4 km, the current study provides clearer and more precise depth measurements. For example, the East Menggala sub-basin, previously inferred, is now confirmed with a maximum depth of 1.6 km. In conclusion, while the earlier gravity-only study laid the groundwork for identifying sub-basins, the current integration of seismic and gravity data offers a clearer and more detailed understanding of the Lampung sedimentary basin structure.
This study integrates gravity and seismic data to delineate the Lampung sedimentary basin in the southeastern Sumatra, identifying seven sub-basins: Negara Batin, Menggala, East Menggala, Terbanggi, Kotabumi, and Metro. Forward modeling confirms normal fault-controlled sub-basin formation, with the key role played by basement highs and lows.
The correlation between seismic data and gravity models improves depth accuracy, particularly in the Negara Batin, Terbanggi, and Menggala sub-basins, where depths reach 2.7–3.0 km. Seismic integration clarifies fault boundaries and enhances resolution beyond gravity-based interpretations. GGMPlus gravity data (200 m resolution) resolves previously unclear horst structures using TOPEX data (1.8 km resolution), particularly between sub-basins 4 and 5 (Terbanggi sub-basin). The study also confirms the presence of volcanic deposits within the lithological sequence in the study area, supporting the interaction between tectonics, sedimentation and magmatism therein.
Overall, this research enhances the understanding of geological and tectonic history of the Lampung sedimentary basin. The combination of seismic and gravity data provides a robust methodology for delineating complex subsurface structures in tectonically active regions.
The authors extend their heartfelt gratitude to PUSDATIN, Indonesian Ministry of Energy and Mineral Resources, for providing the seismic and well data for this research. Special thanks to Mr. Purwaditya Nugraha for his insightful discussions and to Dina Nurvaningsih for her technical assistance. Lastly, we are thankful for the constructive feedback from the anonymous reviewers, which significantly enhanced the quality of this manuscript.
D.R. Febriansanu: conceptualization, writing and drafting, data analysis; S. Husein: conceptualization, supervision, review and editing; S.S. Surjono: conceptualization, supervision, review and editing.
The authors declare that they have no conflicts of interest relevant to this manuscript. The authors read and approved the final manuscript.
1. Aku M.O., 2014. Application of Second Vertical Derivative Analytical Method to Bouguer Data for the Purpose of Delineation of Lithological Boundaries. Science World Journal 9 (3), 27–32.
2. Alhassan A., Aliyu A., 2022. The Principle of Interpretation of Gravity Data Using Second Vertical Derivative Method. In Kh.S. Essa (Ed.), Gravitational Field. Concept and Applications. IntechOpen. https://doi.org/10.5772/intechopen.100443.
3. Amin T.C., Sidarto S., Santosa S., Gunawan W., 1993. Geological map of the Kotaagung Quadrangle, Sumatra. GRDC, Bandung.
4. Araffa S.A.S.A.S., Abdelazeem M., Sabet H.S.S., Al Dabour A.M.M., 2021. Gravity Interpretation for Delineating Subsurface Structures and Depth of Basement at El Moghra Area, North Western Desert, Egypt. NRIAG Journal of Astronomy and Geophysics 10 (1), 270–278. https://doi.org/10.1080/20909977.2021.1913364.
5. Barber A., Crow M., Milson J. (Eds), 2005. Sumatra: Geology, Resources and Tectonic Evolution. Geological Society of London Memoirs 31, 290 p. https://doi.org/10.1144/GSL.MEM.2005.031.
6. Camacho M., Alvarez R., 2021. Geophysical Modeling with Satellite Gravity Data: Eigen-6C4 vs. GGM Plus. Engineering 13 (12), 690–706. https://doi.org/10.4236/eng.2021.1312050.
7. Dani I., Zaenudin A., Hutomo A.I., Yuniza N., 2024. Analysis of Subsurface Structure of Bandar Lampung City Based on Gravity Anomalies. Geodynamics & Tectonophysics 15 (4), 0772 (in Russian) https://doi.org/10.5800/GT-2024-15-4-0772.
8. Dhaoui M., Gabtni H., Jallouli Ch., Jleilia A., Mickus K.L., Turki M.M., 2014. Gravity Analysis of the Precambrian Basement Topography Associated with the Northern Boundary of Ghadames Basin (Southern Tunisia). Journal of Applied Geophysics 111, 299–311. https://doi.org/10.1016/j.jappgeo.2014.10.014.
9. Elkins T.A., 1951. The Second Derivative Method of Gravity Interpretation. Geophysics16 (1), 29–50. https://doi.org/10.1190/1.1437648.
10. Frifita N., Mickus K., Gharbi M., 2020. Gravity Contribution to the Mejerda Foreland Basin, Northwestern Region of Tunisia. Journal of African Earth Sciences 171, 103956. https://doi.org/10.1016/j.jafrearsci.2020.103956.
11. Gafoer S., Amin T.C., Pardede R., 1993. Geological Map of Baturaja Sheet, Sumatra. GRDC, Bandung.
12. Geosoft Oasis Montaj Software, 2024. Available from: https://www.seequent.com/help-support/oasis-montaj/ (Last Accessed October 2, 2024).
13. Ginger D., Fielding K., 2005. The Petroleum Systems and Future Potential of the South Sumatra Basin. In: IPA Proceedings of the 30th Annual Convention & Exhibition. V. 1. IPA, p. 67–89. https://doi.org/10.29118/IPA.2226.05.G.039.
14. Grandis H., 2022. Pengantar Pemodelan Inversi Geofisika. https://doi.org/10.17605/OSF.IO/PHGCW.
15. Harrison J.C., Dickinson M., 1989. Fourier Transform Methods in Local Gravity Modeling. Bulletin Géodésique 63, 149–166. https://doi.org/10.1007/BF02519148.
16. Kadir W.G.A., Alawiyah S., Dahrin D., Santoso D., Setianingsih, Wahyudi E.J., Adabi A., Widianto E., 2013. Identification of Fault Structure and Hydrocarbon Prospect Areas based on Integration of Gravity Anomalies, Geology and Production Well Analysis in the 'X' Oil Field, East Kalimantan. In: Proceedings of the 11th SEGJ International Symposium (November 18–21, 2013, Yokohama, Japan). SEG, p. 180–184. https://doi.org/10.1190/segj112013-046.
17. Kusnama K., Panggabean H., 2009. Karakteristik Batubara dan Batuan Sedimen Pembawanya, Formasi Talangakar, di Daerah Lampung Tengah. Indonesian Journal on Geoscience 4 (2), 133–144. https://doi.org/10.17014/ijog.4.2.133-144.
18. Osorio-Granada A.M., Jigena-Antelo B., Vidal Pérez J.M., Hernández-Pardo O., León-Rincón H., Muñoz-Pérez J.J., 2022. Potential Fields Modeling for the Cayos Basin (Western Caribbean Plate): Implications in Basin Crustal Structure. Marine Geology 449, 106819. https://doi.org/10.1016/j.margeo.2022.106819.
19. Panggabean H., Santy L.D., 2012. History of Hoarding South Sumatra Basin and Its Implications to Time Generation Hydrocarbons. Jurnal Sumber Daya Geologi 22 (4), 11. DOI:10.33332/jgsm.geologi.v22i4.122.
20. Parasnis D.S., 1986. Principles of Applied Geophysics. Chapman and Hall, New York, 402 p. https://doi.org/10.1007/978-94-009-4113-7.
21. Pulunggono A., 1992. Pre-Tertiary and Tertiary Fault Systems as a Framework of the South Sumatra Basin; A Study of SAR-Maps. In: IPA Proceedings of the 21st Annual Convention. Vol. 1. IPA, p. 339–360. https://doi.org/10.29118/IPA.24.339.360.
22. Sarjono S., Sardjito, 1989. Hydrocarbon Source Rock Identification in the South Palembang Sub-Basin. In: IPA Proceedings of the 18th Annual Convention. Vol. 1. IPA, p. 427–467. https://doi.org/10.29118/IPA.1862.427.467.
23. Sarkowi M., Wibowo R.C., Minardi S., Arifianto I., 2021. Identification of Hydrocarbons Sub-Basin Based on Gravity Data Analysis in Lampung Area. Jurnal Penelitian Fisika dan Aplikasinya 11 (2), 106–113. https://doi.org/10.26740/jpfa.v11n2.p106-113.
24. Sedimentary Basin Map of Indonesia, 2022. Ministry of Energy and Mineral Resources, Bandung.
25. Setiadi I., Setyanta B., Widijono B.S., 2010. Delineasi Cekungan Sedimen Sumatra Selatan Berdasarkan Analisis Data Gaya Berat. Jurnal Sumber Daya Geologi 20 (2), 93–106. DOI:10.33332/jgsm.geologi.20.2.93-106.
26. Siringoringo L.P., Sapiie B., Rudyawan A., Sucipta I.G.B.E., 2023. Subsurface Delineation of Sukadana Basalt Province Based on Gravity Method, Lampung, Indonesia. Lithosphere 23 (6), 1027–1037 (in Russian) https://doi.org/10.24930/1681-9004-2023-23-6-1027-1037.
27. Solheim D., 1995. International Geoid Commission National Report for Norway. In: IGeC Activity Report 1991–1995. P. 78.
28. Talwani M., Worzel J.L., Landisman M., 1959. Rapid Gravity Computations for Two-Dimensional Bodies with Application to the Mendocino Submarine Fracture Zone. Journal of Geophysical Research 64 (1), 49–59. https://doi.org/10.1029/JZ064i001p00049.
29. Tapley B.D., Rosborough G.W., 1985. Geographically Correlated Orbit Error and Its Effect on Satellite Altimetry Missions. Journal of Geophysical Research: Oceans 90 (C6), 11817–11831. https://doi.org/10.1029/JC090iC06p11817.
30. Telford W.M., Geldart L.P., Sheriff R.E., 1990. Applied Geophysics. Second Edition. Cambridge University Press, Cambridge, 792 p. https://doi.org/10.1017/CBO9781139167932.
31. Wahyudi E.J., Kynantoro Y., Alawiyah S., 2017. Second Vertical Derivative Using 3-D Gravity Data for Fault Structure Interpretation. Journal of Physics: Conference Series 877, 012039. https://doi.org/10.1088/1742-6596/877/1/012039.
32. Williams H.H., Fowler M., Eubank R.T., 1995. Characteristics of Selected Palaeogene and Cretaceous Lacustrine Source Basins of Southeast Asia. Geological Society of London Special Publications 80 (1), 241–282. https://doi.org/10.1144/GSL.SP.1995.080.01.12.
33. Wiyanto B., Junaedi T., Sulistiyono S., Prabawa H., Wibowo Y.,2009. Potensi Hidrokarbon Sub-Cekungan Bandarjaya Provinsi Lampung. LPMGB 43 (1), 1-10. https://doi.org/10.29017/LPMGB.43.1.121.
34. Zakariah M.N.A., Roslan N., Sulaiman N., Lee S.C.H., Hamzah U., Noh K.A.M., Lestari W., 2021. Gravity Analysis for Subsurface Characterization and Depth Estimation of Muda River Basin, Kedah, Peninsular Malaysia. Applied Sciences 11 (14), 6363. https://doi.org/10.3390/app11146363.
South Lampung 35365
Salahuddin Husein
Febriansanu D.R., Husein S., Surjono S.S. IDENTIFICATION OF LAMPUNG SEDIMENTARY BASIN (SE SUMATRA) USING GRAVITY FORWARD MODELING AND SEISMIC INTERPRETATION. Geodynamics & Tectonophysics. 2025;16(3):0830. https://doi.org/10.5800/GT-2025-16-3-0830. EDN: aizyrw


Editor-in-Chief
Sklyarov E.V.664033, Irkutsk, Lermontova St., 128,
IEC SB RAS Institute of the Earth's crust
E-mail.: gt@crust.irk.ru
tel.: 8 3952 425422
Processing of personal data


