


Contents
Scroll to:
https://doi.org/10.5800/GT-2025-16-1-0803
EDN: lezdxi
Scroll to:
This study presents a comprehensive investigation of the crustal structure in Thailand, Myanmar, and Malaysia using Rayleigh wave dispersion data from a dense network of 49 seismic stations. A direct inversion approach is employed to derive a high-resolution, 3D shear wave velocity model of the crust, circumventing the traditional intermediate step of constructing group velocity maps. The Fast Marching Method is utilized to compute surface wave travel times and ray paths, ensuring an accurate representation of the complex wave propagation patterns within the heterogeneous Earth structure. The resulting 3D velocity model, with dimensions of 120 (longitude) × 112 (latitude) × 9 (depth) and a total of 120960 grid points, reveals significant lateral heterogeneity that correlates with major tectonic features such as the West Burma terrane, Shan-Thai terrane, Indo-China terrane, and the Sagaing fault. The integration of these findings with existing geological and geophysical knowledge provides critical insights into the tectonic evolution and crustal dynamics of this seismically active region, furthering our understanding of the complex interplay between tectonic processes and crustal architecture in Southeast Asia.
Saetang K., Srisawat W. DIRECT INVERSION OF RAYLEIGH WAVE GROUP VELOCITY DISPERSION FOR 3D CRUSTAL SHEAR WAVE VELOCITY STRUCTURE IN THAILAND, MYANMAR, AND MALAYSIA. Geodynamics & Tectonophysics. 2025;16(1):0803. https://doi.org/10.5800/GT-2025-16-1-0803. EDN: lezdxi
Southeast Asia, encompassing Thailand, Myanmar, and Malaysia, is a region characterized by complex tectonic settings and significant seismic activity. Situated at the confluence of the West Burma terrane, the Shan-Thai terrane, and the Indo-China terrane (Fig. 1), this area has undergone a multifaceted geological evolution. The West Burma terrane, an extension of the West Sumatra block, was separated from the main continent by the Miocene opening of the Andaman Sea [Barber, Crow, 2009]. The Shan-Thai terrane stretches from western Thailand to southern China, while the Indo-China terrane constitutes the core of Southeast Asia [Morley et al., 2011]. These terranes are demarcated by several prominent fault systems, notably the right-lateral Sagaing fault in Myanmar, which is linked to the Mae Ping fault in Thailand [Searle, Morley, 2011]. To unravel the ongoing tectonic processes and to interpret the crustal architecture of this region, comprehensive seismic imaging is essential.
Numerous studies have endeavored to model the crustal structure of Southeast Asia using various techniques, underscoring the need for high-resolution, three-dimensional models that accurately capture variations in shear wave velocity [Bao et al., 2015; Shapiro, Ritzwoller, 2002]. Rayleigh wave dispersion analysis, a well-established method in seismology, involves measuring the velocity of Rayleigh waves at different frequencies to infer subsurface structures [Dziewonski, Anderson, 1981]. [Saetang et al., 2018] applied travel time tomography to delineate subsurface geothermal sources and the Moho depth in Northern Thailand, revealing a correlation between subsurface geothermal sources and surface hot spring locations, and estimating the Moho depth to be approximately 35 km.
Seismic anisotropy, a crucial indicator of mantle deformation and flow, has been investigated in the region using shear-wave splitting (SWS) measurements. [Saetang, 2022] presented a two-layer anisotropy model beneath Myanmar and Thailand, interpreting the upper and lower layers as the lithosphere and asthenosphere, respectively. The study revealed that the fast polarization direction (φ) values of the West Burma terrane indicate a northward flow direction, while the Shan-Thai terrane and Indo-China terrane exhibit a southeastern flow direction.
Earthquake focal mechanisms offer valuable insights into the stress field orientation and fault geometry. [Saetang, 2017] determined the focal mechanisms of Mw 6.3 aftershocks in the Phayao fault zone, Northern Thailand, using waveform inversions. The results indicated a WSW-trending left-lateral strike-slip fault with a reverse component in the northern part of the fault zone. [Noisagool et al., 2016; Pananont et al., 2017] also investigated the focal mechanisms and aftershocks of the Mw 6.3 earthquake, reporting both reverse and normal faulting.
To further enhance understanding of the crustal structure in the region [Saetang, Duerrast, 2023] developed a minimum 1-D velocity model for Northern Thailand using the VELEST code. The study utilized P- and S-wave travel time data from local earthquakes recorded by stations of the Thai Meteorological Department (TMD) network. The resulting velocity model, along with station delays, provided insights into the lateral velocity variations related to the near-surface geology.
This study aims to apply a direct inversion method to Rayleigh wave dispersion data to derive a high-resolution, three-dimensional shear wave velocity model of the crust in Thailand, Myanmar, and Malaysia. By circumventing the traditional intermediate step of constructing group velocity maps and employing the Fast Marching Method (FMM) for computing surface wave travel times and ray paths, we expect to obtain a more accurate representation of the crustal structure. The integration of our findings with existing geological and geophysical knowledge will contribute to a comprehensive understanding of the tectonic evolution and crustal dynamics in Southeast Asia. This research will shed light on the complex interplay between tectonic processes and crustal architecture, providing valuable insights for seismic hazard assessment and resource exploration in the region.
To achieve the objectives outlined in the introduction and obtain a high-resolution 3D crustal model of the study area, we employ a comprehensive data collection, preprocessing, and inversion approach. The following sections detail the Ambient Noise Tomography (ANT) method used to extract Rayleigh wave dispersion data, the quality control measures applied to ensure data reliability, and the direct inversion technique employed to derive the 3D shear wave velocity structure. By leveraging advanced seismological techniques and robust methodologies, we aim to provide valuable insights into the crustal structure of the region encompassing Thailand, Myanmar, and Malaysia.
2.1. Data collection and preprocessing
In this study, the ANT method was applied to extract surface waves using cross-correlation of vertical components of Rayleigh waves recorded at 49 seismic stations (Fig. 1). Data, sourced from the DMC Web Services covering the period until May 2018, underwent preprocessing steps such as instrument response removal, daily trend adjustments, and band-pass filtering to emphasize signals within the 15–50 s period range. Signals were resampled at 1 Hz for consistency. The continuous waveform data were processed using the seismic-noise-tomography Python framework [Goutorbe et al., 2015]; generating 1032 station pairs, and dispersion curves for Rayleigh wave group velocities were extracted using Frequency-Time Analysis techniques.
Quality control involved evaluating the Signal-to-Noise Ratio (SNR) and Standard Deviations (SD) of group velocity, with criteria set to ensure high-quality data (minimum SNR of 2 and maximum SD of 0.1 km/s). To mitigate seasonal variations and enhance the reliability of velocity measurements, dispersion curves were systematically stacked over three-month intervals (Fig. 2). Each subset of input waveforms was grouped into specific monthly combinations, and the SD of group velocity for each period and station pair were computed from these three-month stacks. The cross-correlation procedure followed the steps advocated by [Bensen et al., 2007], and the measurement of dispersion curves was based on the FTAN with phase-matched filtering described by [Levshin, Ritzwoller, 2001; Bensen et al., 2007].
2.2. Direct inversion of Rayleigh wave dispersion
After extracting dispersion curves from the preprocessed ambient noise data, the DSurfTomo v1.4 software [Fang et al., 2015] was employed to directly invert the dispersion data and obtain a 3D shear wave velocity model of the study area. This approach circumvents the conventional intermediate step of constructing group velocity maps, thereby minimizing potential biases introduced by the assumption of great-circle propagation paths. DSurfTomo v1.4 utilizes the FMM [Rawlinson, Sambridge, 2004] to compute surface wave travel times and raypaths at each period, ensuring a more accurate representation of the complex wave propagation patterns within the heterogeneous Earth structure (Fig. 3).
To optimize the inversion process and ensure high-resolution imaging, input parameters for DSurfTomo v1.4 were carefully selected. The study area, encompassing Thailand, Myanmar, and Malaysia, was parameterized using a 3D grid with dimensions of 120 (longitude) × 112 (latitude) × 9 (depth), resulting in a total of 120,960 grid points. The geographic coordinates of the grid were defined with the upper left corner at 25.5°N, 92.5°E, and a uniform grid spacing of 0.25° in both latitude and longitude. This parameterization yielded a model space extending from 92.5 °E to 122.25 °E in longitude and from –2.25 °N to –25.5 °N in latitude, with a depth range of 0–40 km.
The dispersion data, consisting of Rayleigh wave group velocities measured at 36 periods ranging from 4.0 to 39.0 s with an increment of 1.0 s, were provided as input to the inversion algorithm. To balance the trade-off between data fitting and model smoothness, weighting parameters of 5.0 and 1.0 were assigned to the data misfit and regularization terms, respectively. The smoothing factor, controlling the vertical smoothness of the model, was set to 3, allowing for the resolution of vertical velocity gradients. The initial shear wave velocity model was derived from the 1D model proposed by [Saetang, Duerrast, 2023] for Northern Thailand, with a depth range of 0–40 km and a layer thickness of 5 km (Table 1).
To ensure the stability and convergence of the inversion process, we imposed velocity bounds of 1.5–6.0 km/s based on the observed velocity range in the dispersion curves. These bounds serve to constrain the inversion and prevent the algorithm from exploring unrealistic velocity values [Fang et al., 2015]. The maximum number of iterations was set to 10, providing sufficient cycles for the algorithm to converge to a stable solution while avoiding excessive computational time. As suggested in the DSurfTomo user manual [Fang, Yao, 2023], 10 iterations are usually more than enough, and stable results are often achieved after 4–5 iterations.
The damping factor, which controls the amplitude of the model perturbations, was set to 0.2. This value strikes a balance between allowing the model to adapt to the data and preventing overfitting or instability [Fang, Yao, 2023]. The damping parameter is an input for the lsqr function, which is responsible for controlling the amplitude of the inverted parameters [Fang, Yao, 2023].
To enhance the robustness of the inversion results, a threshold value of 1.5 was used to remove outliers from the dispersion data. By filtering out anomalous data points that deviate significantly from the general trend, the inversion process becomes less sensitive to noise and errors in the dispersion measurements [Fang, Yao, 2023]. The threshold parameter in the input file represents a value between 1 and 2, which is mainly used to remove outliers from the data [Fang, Yao, 2023]. Setting the threshold to 1.5 will remove residuals greater than 1.5 times the 75th percentile of all the residuals and those smaller than the 25th percentile.
2.3. Methodology for direct inversion
The methodology employed for direct inversion of surface wave dispersion data is based on the approach described by [Fang et al., 2015]. This method inverts dispersion data directly to 3D shear wave velocity (Vs) models using frequency-dependent ray tracing and a wavelet-based sparsity-constrained tomographic inversion technique.
The inversion procedure utilizes the FMM [Rawlinson, Sambridge, 2004] to compute surface wave travel times and ray paths between sources and receivers at each period. This approach avoids the assumption of great-circle propagation, which is generally inappropriate in complex media.
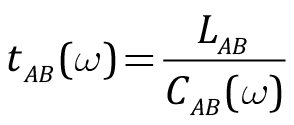
For the forward problem, the average surface wave group velocity  is measured at angular frequency between source A and receiver B with an assumption of great-circle propagation. The actual travel time
  is then given by:
 (1)
(1)
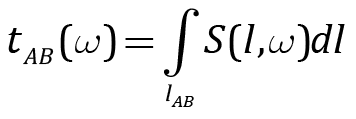
where  is the great-circle distance between A and B. Due to structural heterogeneity, the real surface wave ray path may deviate from the great-circle path, and the travel time can be expressed as:
 (2)
(2)
where  is the local slowness along the actual ray path
  . Discretizing this, we get:
 (3)
(3)
where  represents the group slowness for path segment
  along AB, and P is the number of path segments.
The study area is parametrized using a regular grid of K points, each associated with a 1-D model  . The slowness at the kth grid point
  is obtained from a forward function
  , mapping to frequency-dependent group velocities. The travel time can then be expressed as:
 (4)
(4)
where  are bilinear interpolation coefficients.
The objective of the inversion is to minimize the differences  between observed travel times
  and model predictions
  for all frequencies
  . The travel time difference for path i is:
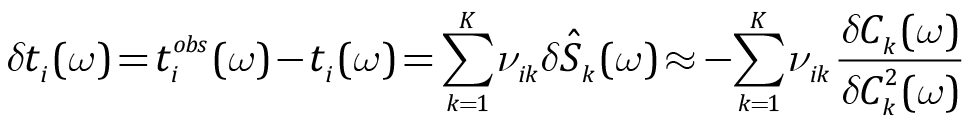 (5)
(5)
where  and
and 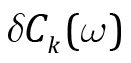 are the group velocity and its perturbation at the kth grid point, respectively. The group velocity perturbation is:
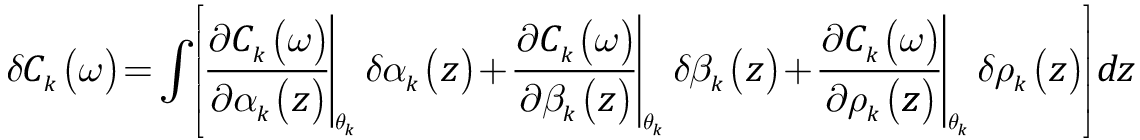 (6)
(6)
where 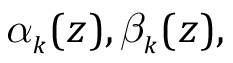 and
and 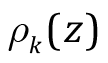 are the compressional wave speed, shear wave speed, and mass density, respectively. Utilizing empirical relationships of [Brocher, 2005], these parameters and their perturbations are related to shear wave speed β.
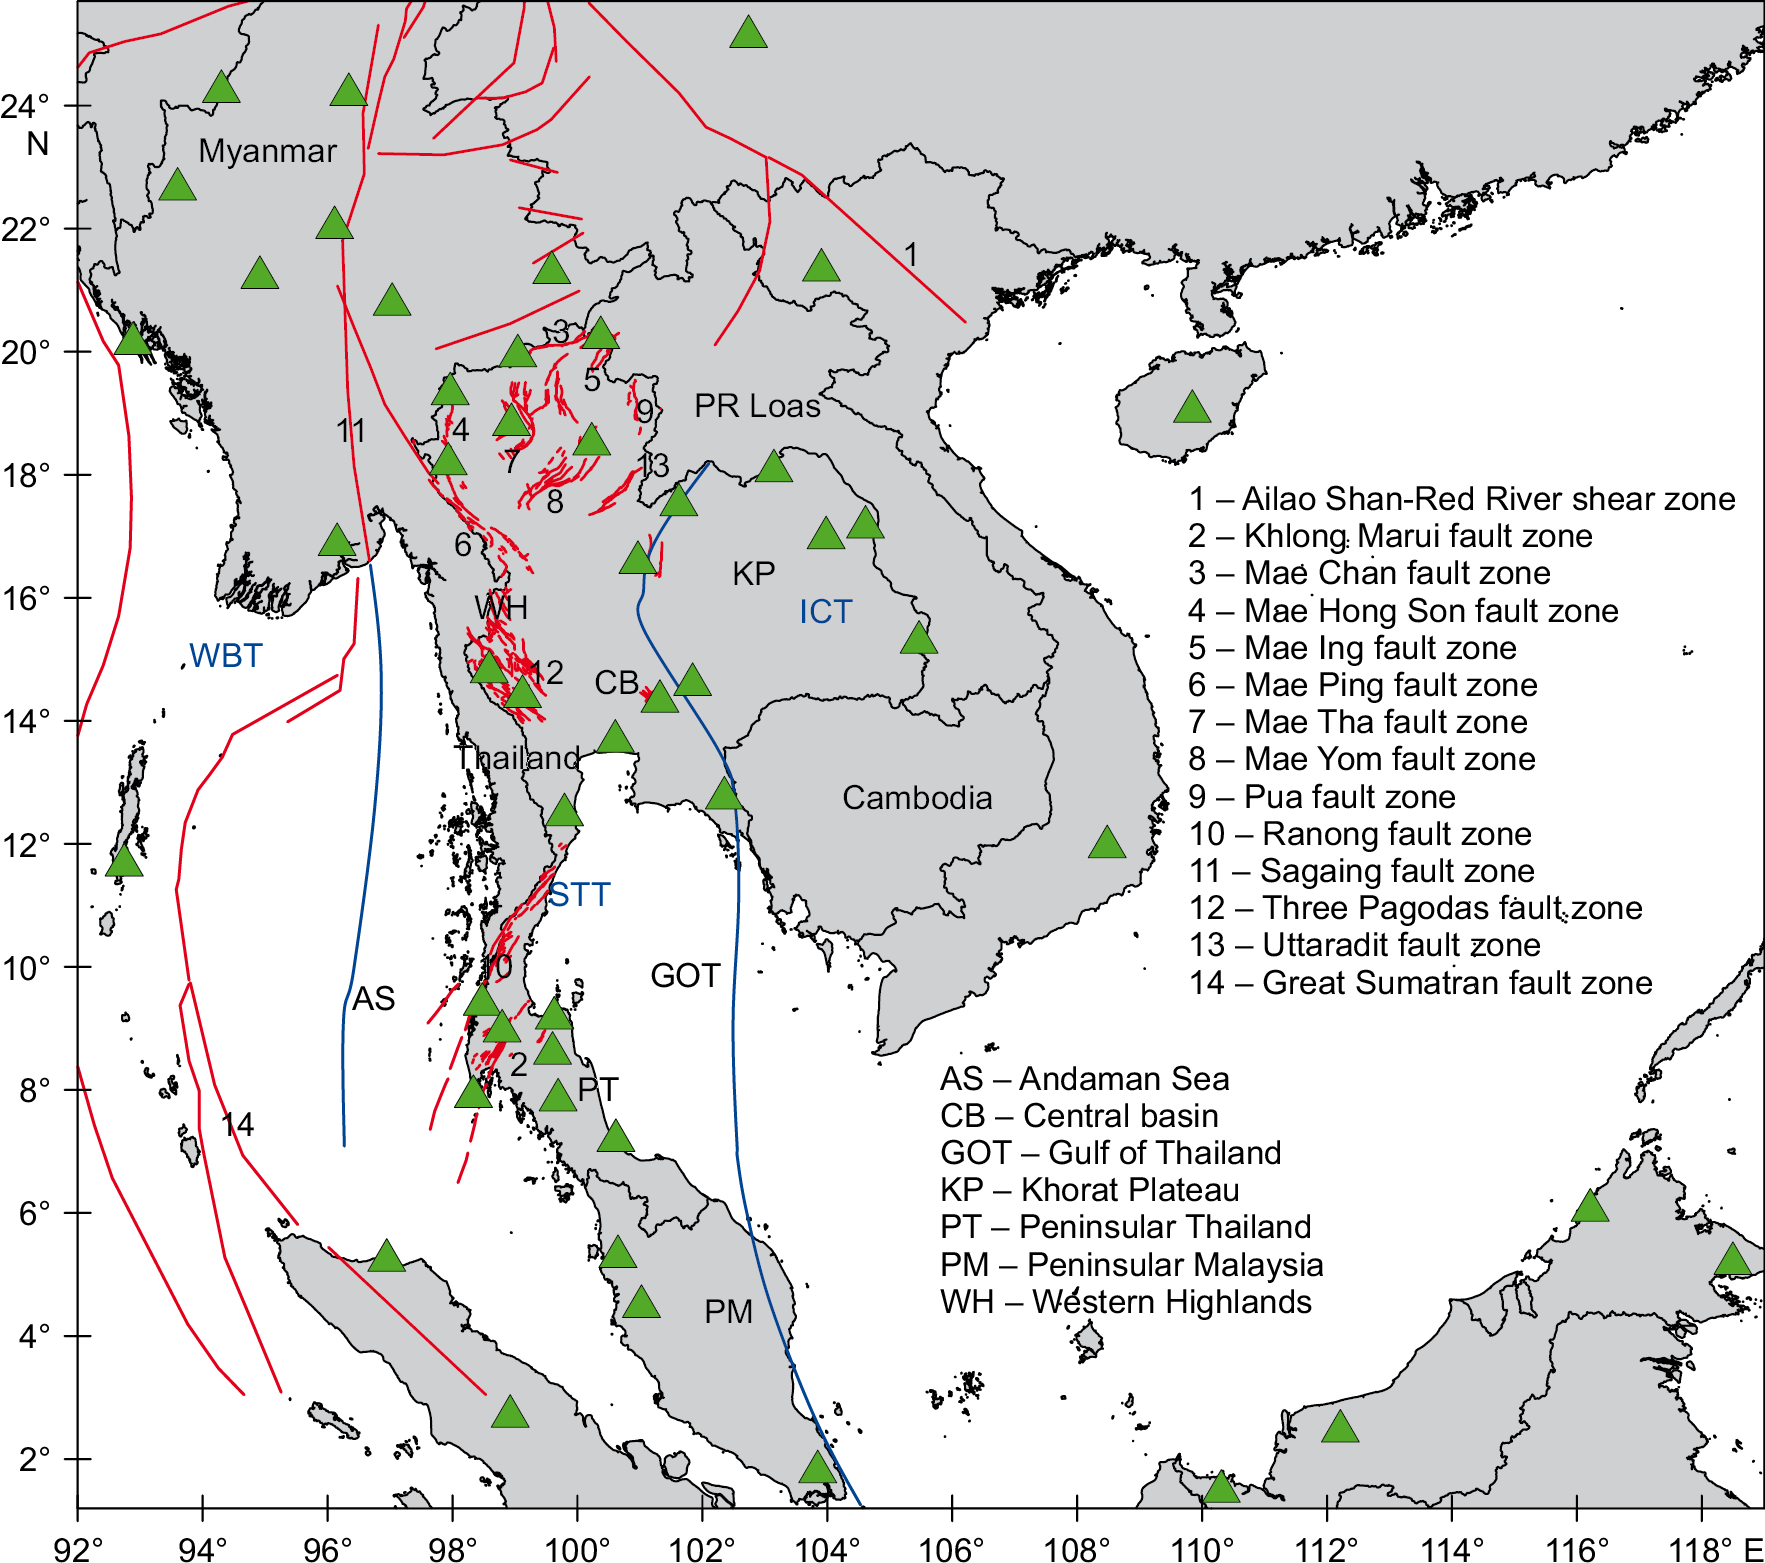
Fig. 1. Tectonic setting and seismic station distribution in Thailand, Myanmar, and Malaysia.
Green triangles indicate the seismic stations employed in this study. Major tectonic boundaries and terranes are delineated with red and blue lines, respectively. The map highlights the West Burma Terrane (WBT), Shan-Thai Terrane (STT), and Indo-China Terrane (ICT). Key geological features and fault zones are numbered and labelled (modified from [Charusiri et al., 1993; Geological Map…, 2007; Morley et al., 2011]).
Рис. 1. Тектоническая обстановка и распределение сейсмических станций в Таиланде, Мьянме и Малайзии.
Зелеными треугольниками обозначены сейсмостанции, задействованные в данном исследовании. Главные тектонические границы и террейны обозначены красными и синими линиями соответственно. На карте показаны Западно-Бирманский блок (WBT), Шан-Тайский террейн (STT) и Индокитайский террейн (ICT). Основные геологические объекты и зоны разломов пронумерованы и промаркированы (по [Charusiri et al., 1993; Geological Map…, 2007; Morley et al., 2011], с изменениями).

Fig. 2. FTAN plot for the station pair TM.CMMT-IC.KMI (distance – 801 km, n days – 1782).
The green curve represents the SNR, while the grey lines show the three-month dispersion curves. The black line indicates the clean dispersion curve. The inset map locates the CMMT and KMI stations within the regional tectonic framework.
Рис. 2. График частотно-временного анализа (FTAN) для пары станций TM.CMMT-IC.KMI (расстояние – 801 км, количество дней – 1782).
Зеленая кривая представляет собой отношение сигнал/шум (SNR), серыми линиями показаны дисперсионные кривые за трехмесячный период. Черной линией показана кривая дисперсии в чистом виде. На карте-врезке показано местоположение станций CMMT и KMI внутри региональной тектонической структуры.
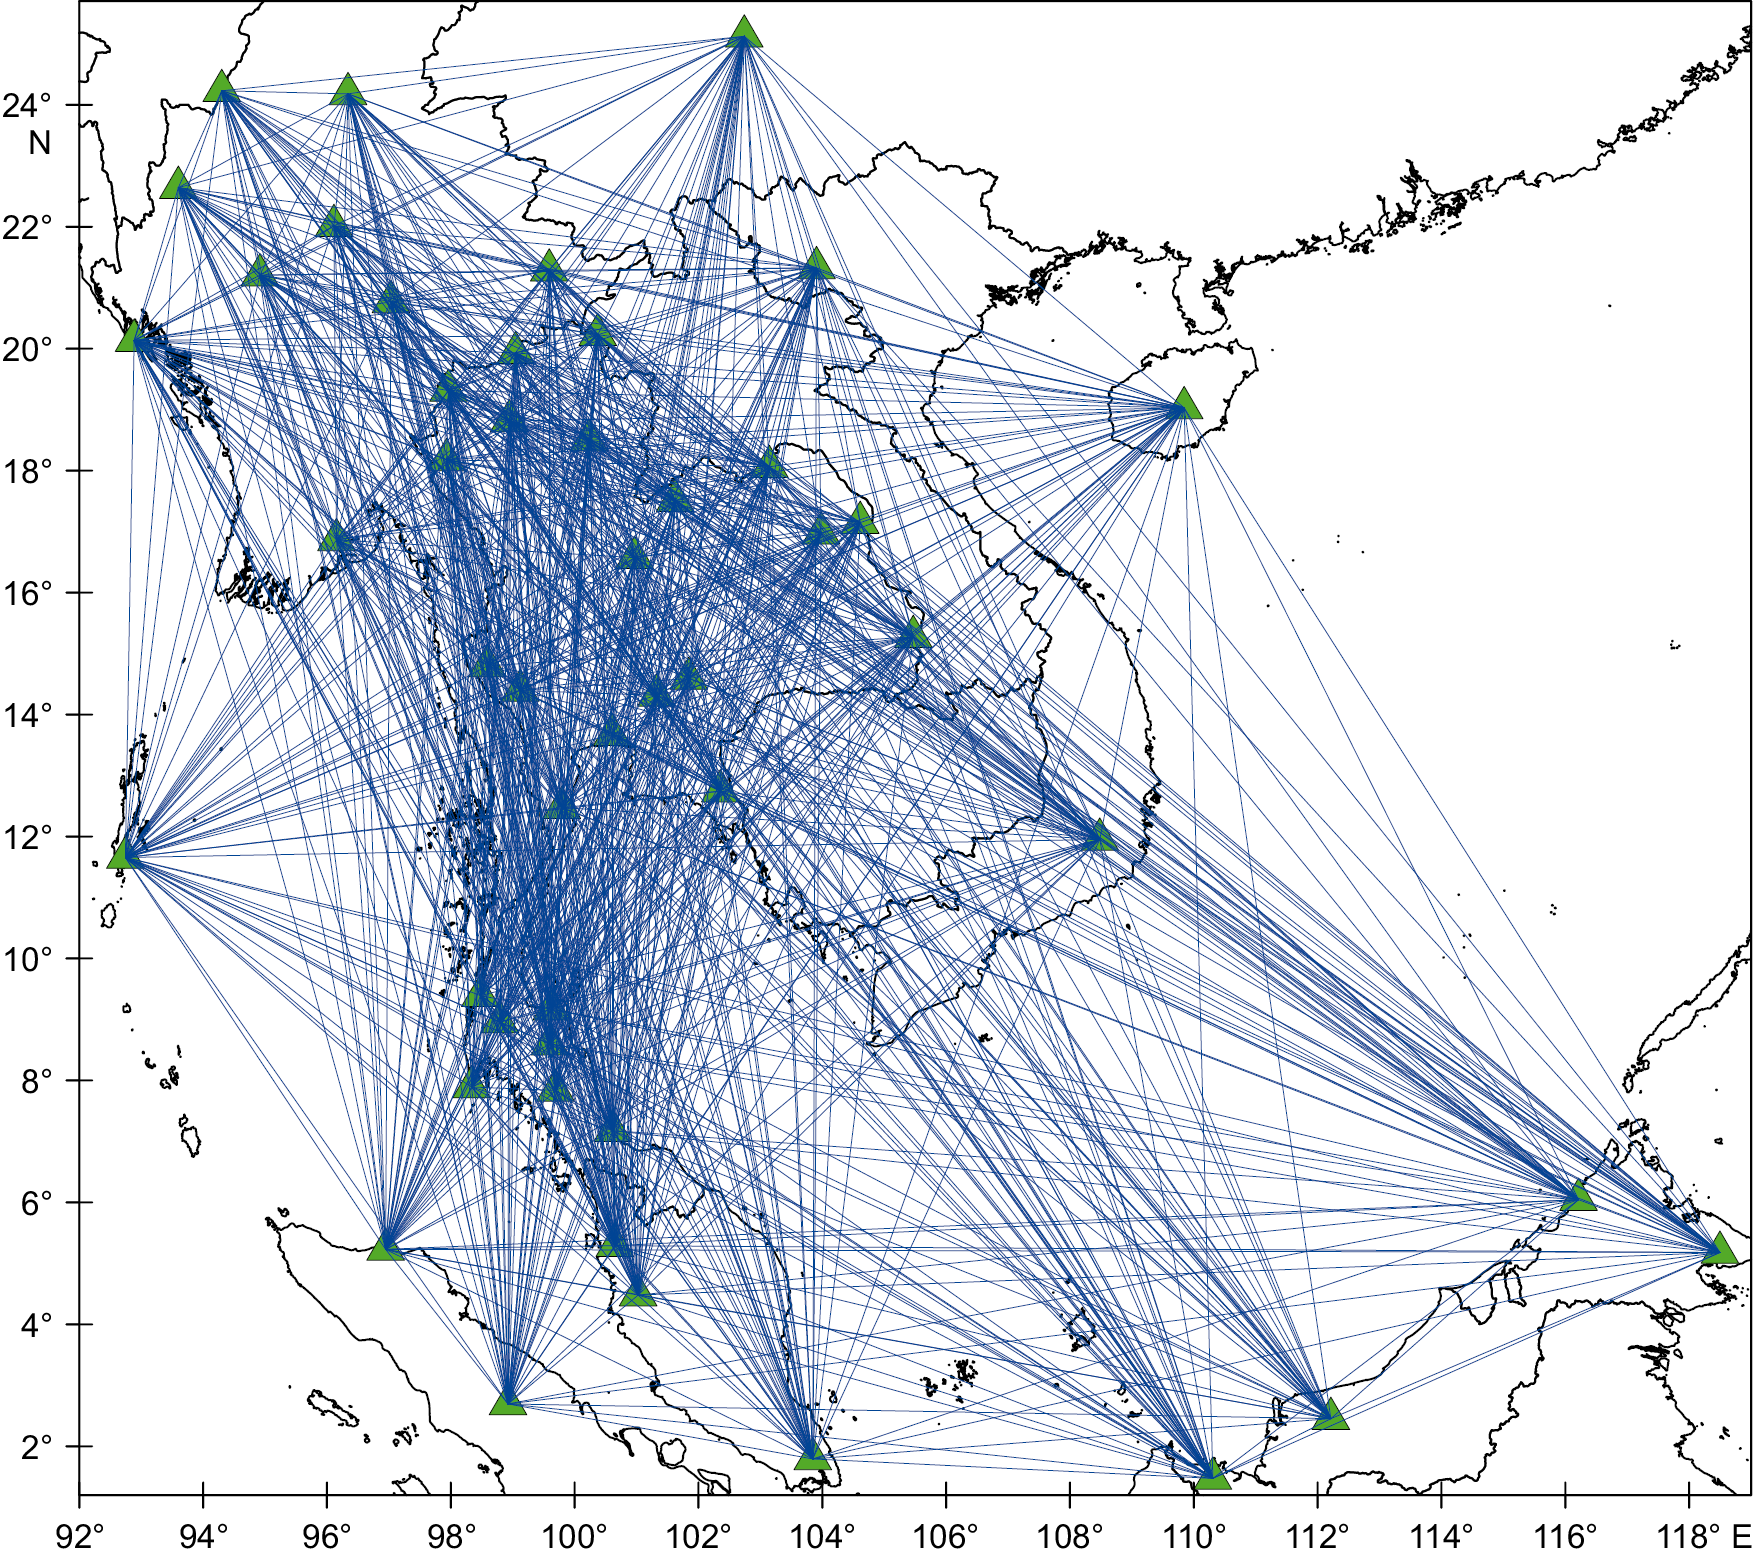
Fig. 3. Spatial distribution of seismic stations and inter-station raypaths utilized in this study.
The map depicts the locations of 49 seismic stations (green triangles) across Thailand, Myanmar, and Malaysia. Blue lines represent the 1032 station pairs for which Rayleigh wave dispersion data were obtained and analyzed.
Рис. 3. Пространственное распределение сейсмических станций и межстанционных траекторий движения лучей, задействованных в данном исследовании.
На карте показано местоположение 49 станций (зеленые треугольники) в Таиланде, Мьянме и Малайзии. Синими линиями показаны 1032 пары станций, для которых были получены и проанализированы данные о дисперсии волн Рэлея.
Table 1. Initial 1-D shear wave velocity model used in the 3D inversion, based on the model proposed by [Saetang, Duerrast, 2023] for Northern Thailand
Таблица 1. Исходная одномерная модель скорости сдвиговых волн, используемая в 3D инверсии, основанная на модели, предложенной [Saetang, Duerrast, 2023] для Северного Таиланда
|
Depth, km |
S-wave velocity, km/s |
|
0–5 |
3.35 |
|
5–10 |
3.35 |
|
10–15 |
3.53 |
|
15–20 |
3.59 |
|
20–25 |
3.67 |
|
25–30 |
3.67 |
|
30–35 |
3.67 |
|
35–40 |
4.00 |
Note. The model extends from the surface to a depth of 40 km, with a layer thickness of 5 km for each depth interval.
Примечание. Модель представлена для глубин от поверхности Земли до 40 км, при толщине слоя 5 км для каждого глубинного интервала.
The 3D shear wave velocity model derived from the direct inversion of Rayleigh wave dispersion data reveals significant lateral heterogeneity in the crustal structure across Thailand, Myanmar, and Malaysia. The velocity maps at depths of 10, 15 and 20 km (Figs 4, 5, and 6) showcase distinct velocity patterns that correlate with major tectonic features, such as the West Burma terrane, Shan-Thai terrane, Indo-China terrane, Peninsular Thailand, and the Sagaing fault (see Fig. 1).
The spatial resolution and model reliability are fundamentally constrained by the distribution of seismic stations across the study region (see Fig. 3). Marine areas, particularly the Andaman Sea and Gulf of Thailand, exhibit limited resolution due to the absence of offshore instrumentation. Velocity structures in the offshore domain, notably the high-velocity anomalies in the 4–10° N, 104–112° E region, require careful consideration in interpretation due to sparse raypath coverage, an inherent limitation of the land-based seismic network configuration. Thus, our analysis principally focuses on continental regions where dense raypath coverage provides optimal model resolution.
At a depth of 10 km (see Fig. 4), high-velocity anomalies are predominantly observed in the mountainous regions of western Thailand and eastern Myanmar, corresponding to the Shan-Thai terrane. However, the pattern and orientation of these anomalies deviate from the expected north-south trending layout of basement rocks, as described by [Charusiri et al., 1993]. This discrepancy suggests the influence of additional geological factors, such as mafic intrusions or the older and more thermally stable crustal segments. High-velocity anomalies extend from the northern part of the Sagaing fault to the Mae Ping fault, indicating a complex interaction of tectonic processes in these regions. The 10 km deep high-velocity anomalies observed in the mountainous regions of western Thailand and eastern Myanmar do not appear to extend significantly into the southern part of the Central Basin and the Gulf of Thailand. The same-depth high-velocity anomalies from the southern part of the West Burma terrane are less prominent and do not clearly extend into the Andaman Sea. The 10 km high-velocity anomalies are evident on the eastern side of the Khlong Marui fault zone in southern Thailand but not strongly connected with those in Peninsular Malaysia. High-velocity anomalies are observed at the northern and southern parts of the Khorat Plateau, highlighting areas of dense and consolidated crustal structure.
In contrast, prominent low-velocity anomalies are observed in the central part of the Central Basin of Thailand, the Gulf of Thailand, and the Andaman Sea. These anomalies are associated with thick sedimentary sequences and extended continental crust, characteristic of these regions [Morley, 2002; Curray, 2005].
At a depth of 15 km (see Fig. 5), the high-velocity anomalies remain pronounced in the mountainous regions of western Thailand and eastern Myanmar, aligning with the tectonic boundaries of the Shan-Thai terrane. The persistence of these anomalies suggests the presence of mafic or the older and stable crustal segments that have not undergone significant tectonic disruption. Low-velocity anomalies are observed in the central part of the Central Basin, the northern part of the Gulf of Thailand, and the Andaman Sea, indicating the presence of thick sedimentary sequences at this depth. High-velocity anomalies from the southern part of the West Burma terrane extend into the Andaman Sea, while those at the eastern part of the Khlong Marui fault zone in southern Thailand are less pronounced compared to the 10 km depth map. High-velocity anomalies are evident in Peninsular Malaysia, further highlighting the structural complexity of these regions. The Khorat Plateau exhibits a mix of high and low-velocity anomalies, with high-velocity anomalies more prominent in the southern part, indicating areas of dense and consolidated crust.
At a depth of 20 km (Fig. 6), the shear wave velocity distribution shows high velocities beneath eastern Myanmar, northern and eastern Thailand, and the Sunda Shelf. These high-velocity anomalies may indicate the presence of more mafic or the denser and more thermally stable crustal segments, consistent with the geological characteristics of these regions [Searle, Morley, 2011]. The persistence of low-velocity anomalies associated with the central part of the Central Basin and the northern part of the Gulf of Thailand at this depth suggests that these areas are underlain by deep-rooted sedimentary basins, extending into the lower crust and potentially influencing the region’s tectonic and thermal evolution [Morley, 2002]. The low-velocity zones in the Andaman Sea and the southern part of the Gulf of Thailand continue to reflect the extended continental crust and sediment accumulation in these areas. High-velocity anomalies are also observed in the southern part of Peninsular Malaysia, indicating the presence of the denser crustal materials.
The similarity in the velocity patterns across the investigated depths (10, 15 and 20 km) suggests a consistent crustal structure in terms of major tectonic features, with the boundaries of the West Burma terrane, Shan-Thai terrane, and Indo-China terrane extending through these depths. The observed high-velocity anomalies in various regions and the low-velocity zones provide critical insights into the region’s tectonic architecture. The correlation of lateral heterogeneity in shear wave velocity with known tectonic features enhances our understanding of the crustal dynamics and deformation mechanisms in this seismically active region.
Fig. 4. Shear wave velocity map at a depth of 10 km.
The color scale represents shear wave velocity (Vs) in km/s, with red areas indicating higher velocities and green and blue areas indicating lower velocities. Major tectonic boundaries and terranes (dark green lines), corresponding to those shown in Fig. 1, delineate the primary geological features of the region. Pink triangles denote the locations of seismic stations used in this study.
Рис. 4. Карта скорости сдвиговой волны на глубине 10 км.
Цветовая шкала отображает скорость сдвиговой волны (Vs) в км/с; красные области указывают на более высокие скорости, зеленые и синие области – на более низкие. Главные тектонические границы и террейны (темно-зеленые линии), соответствующие главным тектоническим границам и террейнам, показанным на рис. 1, очерчивают основные геологические объекты региона. Розовыми треугольниками обозначено местоположение сейсмических станций, задействованных в данном исследовании.
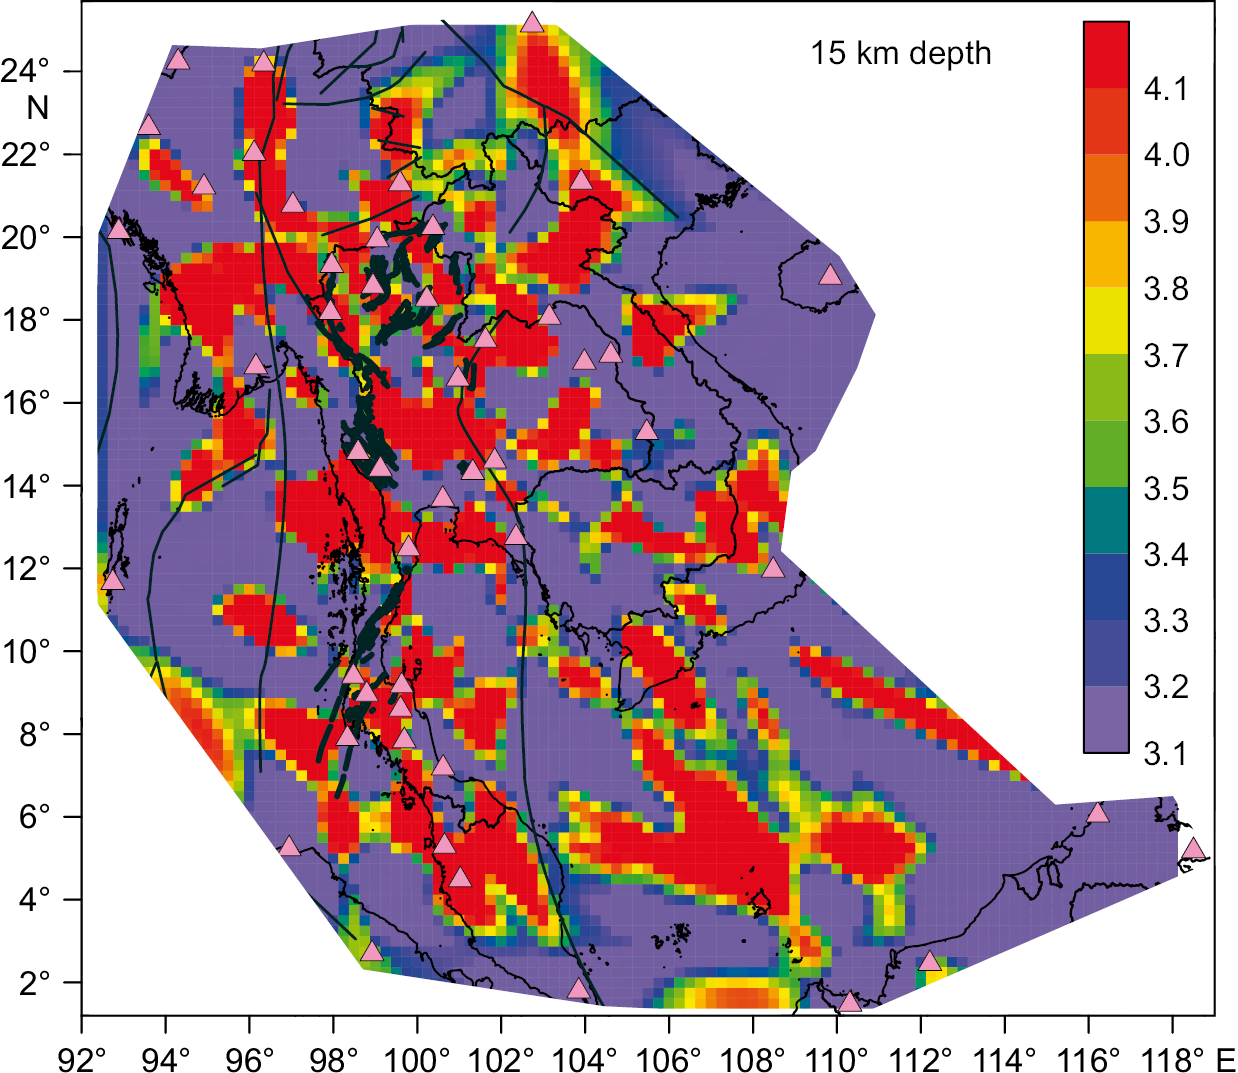
Fig. 5. Shear wave velocity map at a depth of 15 km. See the caption of Fig. 4 for explanations.
Рис. 5. Карта скорости сдвиговой волны на глубине 15 км. Пояснения – см. подпись к рис. 4.
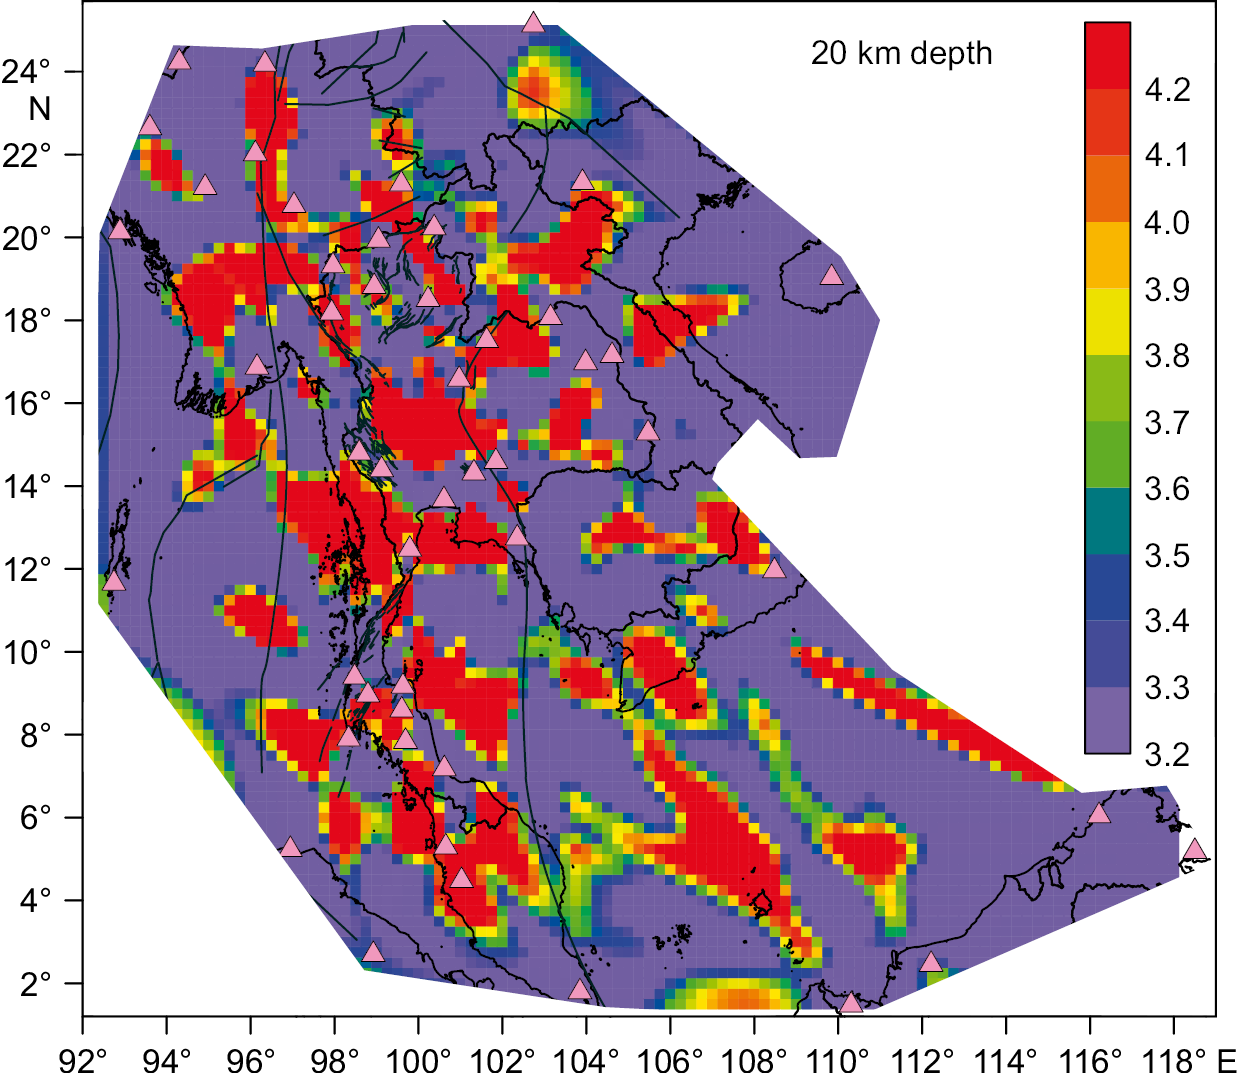
Fig. 6. Shear wave velocity map at a depth of 20 km. See the caption of Fig. 4 for explanations.
Рис. 6. Карта скорости сдвиговой волны на глубине 20 км. Пояснения – см. подпись к рис. 4.
The 3D shear wave velocity model derived from the direct inversion of Rayleigh wave dispersion data reveals a complex and heterogeneous crustal structure across Thailand, Myanmar, and Malaysia. The observed velocity anomalies, including high-velocity regions corresponding to dense, consolidated crustal segments and low-velocity zones associated with sedimentary basins and extended continental crust, provide critical insights into the region’s tectonic architecture. The high-resolution imaging achieved through the direct inversion method allows for a detailed interpretation of subsurface structures, revealing the intricate interplay between tectonic processes and crustal dynamics. The similarity in velocity patterns across the investigated depths (10, 15 and 20 km) suggests a consistent crustal structure, with the boundaries of major tectonic features such as the West Burma terrane, Shan-Thai terrane, and Indo-China terrane extending through these depths. The strong correlation between lateral heterogeneity in shear wave velocity and known tectonic elements enhances our understanding of the crustal deformation mechanisms and tectonic evolution in this seismically active region. Furthermore, this study demonstrates the effectiveness of the direct inversion approach in imaging the crustal structure with high resolution, contributing to a comprehensive understanding of the geodynamics and tectonic history of Southeast Asia. The insights gained from this research have important implications for seismic hazard assessment, resource exploration, and further geophysical investigations in the region.
1. Bao X., Song X., Li J., 2015. High-Resolution Lithospheric Structure Beneath Mainland China from Ambient Noise and Earthquake Surface-Wave Tomography. Earth and Planetary Science Letters 417, 132–141. https://doi.org/10.1016/j.epsl.2015.02.024.
2. Barber A.J., Crow M.J., 2009. Structure of Sumatra and Its Implications for the Tectonic Assembly of Southeast Asia and the Destruction of Paleotethys. Island Arc 18 (1), 3–20. https://doi.org/10.1111/j.1440-1738.2008.00631.x.
3. Bensen G.D., Ritzwoller M.H., Barmin M.P., Levshin A.L., Lin F., Moschetti M.P., Shapiro N.M., Yang Y., 2007. Processing Seismic Ambient Noise Data to Obtain Reliable Broad-Band Surface Wave Dispersion Measurements. Geophysical Journal International 169 (3), 1239–1260. https://doi.org/10.1111/j.1365-246X.2007.03374.x.
4. Brocher T.M., 2005. Empirical Relations Between Elastic Wavespeeds and Density in the Earth’s Crust. Bulletin of the Seismological Society of America 95 (6), 2081–2092. https://doi.org/10.1785/0120050077.
5. Charusiri P., Clark A.H., Farrar E., Archibald D.A., Charusiri B., 1993. Granite Belts in Thailand: Evidence from 40Ar/39Ar Geochronological and Geological Syntheses. Journal of Southeast Asian Earth Sciences 8 (1–4), 127–136. https://doi.org/10.1016/0743-9547(93)90014-G.
6. Curray J.R., 2005. Tectonics and History of the Andaman Sea Region. Journal of Asian Earth Sciences 25 (1), 187–232. https://doi.org/10.1016/j.jseaes.2004.09.001.
7. Dziewonski A.M., Anderson D.L., 1981. Preliminary Reference Earth Model. Physics of the Earth and Planetary Interiors 25 (4), 297–356. https://doi.org/10.1016/0031-9201(81)90046-7.
8. Fang H., Yao H., 2023. Users’ Manual for DSurfTomo. Version 1.4. 5 p.
9. Fang H., Yao H., Zhang H., Huang Y.C., van der Hilst R.D., 2015. Direct Inversion of Surface Wave Dispersion for Three-Dimensional Shallow Crustal Structure Based on Ray Tracing: Methodology and Application. Geophysical Journal International 201 (3), 1251–1263. https://doi.org/10.1093/gji/ggv080.
10. Geological Map of Thailand, 2007. Department of Mineral Resources, Ministry of Natural Resources and Environment, Thailand.
11. Goutorbe B., de Oliveira Coelho D.L., Drouet S., 2015. Rayleigh Wave Group Velocities at Periods of 6–23 s Across Brazil from Ambient Noise Tomography. Geophysical Journal International, 203 (2), 869–882. https://doi.org/10.1093/gji/ggv343.
12. Levshin A.L., Ritzwoller M.H., 2001. Automated Detection, Extraction, and Measurement of Regional Surface Waves. Pure and Applied Geophysics 158, 1531–1545. https://doi.org/10.1007/PL00001233.
13. Morley C.K., 2002. A Tectonic Model for the Tertiary Evolution of Strike-Slip Faults and Rift Basins in SE Asia. Tectonophysics 347 (4), 189–215. https://doi.org/10.1016/S0040-1951(02)00061-6.
14. Morley C.K., Charusiri P., Watkinson I.M., 2011. Structural Geology of Thailand During the Cenozoic. In: M.F. Ridd, A.J. Barber, M.J. Crow (Eds), The Geology of Thailand. Geological Society of London, p. 273–334. https://doi.org/10.1144/GOTH.11.
15. Noisagool S., Boonchaisuk S., Pornsopin P., Siripunvaraporn W., 2016. The Regional Moment Tensor of the 5 May 2014 Chiang Rai Earthquake (Mw=6.5), Northern Thailand, with Its Aftershocks and Its Implication to the Stress and the Instability of the Phayao Fault Zone. Journal of Asian Earth Sciences 127, 231–245. https://doi.org/10.1016/j.jseaes.2016.06.008.
16. Pananont P., Herman M.W., Pornsopin P., Furlong K.P., Habangkaem S., Waldhauser F., Wongwai W., Limpisawad S., Warnitchai P., Kosuwan S., Wechbunthung B., 2017. Seismotectonics of the 2014 Chiang Rai, Thailand, Earthquake Sequence. Journal of Geophysical Research: Solid Earth, 122 (8), 6367–6388. https://doi.org/10.1002/2017JB014085.
17. Rawlinson N., Sambridge M., 2004. Wave Front Evolution in Strongly Heterogeneous Layered Media Using the Fast Marching Method. Geophysical Journal International 156 (3), 631–647. https://doi.org/10.1111/j.1365-246X.2004.02153.x.
18. Saetang K., 2017. Focal mechanisms of Mw 6.3 Aftershocks from Waveform Inversions, Phayao Fault Zone, Northern Thailand. International Journal of Geophysics 2017 (1), 9059825. https://doi.org/10.1155/2017/9059825.
19. Saetang K., 2022. Two-Layer Model of Anisotropy Beneath Myanmar and Thailand Revealed by Shear-Wave Splitting. Annals of Geophysics 65 (6). https://doi.org/10.4401/ag-8769.
20. Saetang K., Duerrast H., 2023. A Minimum 1-D Velocity Model of Northern Thailand. Journal of Seismology 27, 493–504. https://doi.org/10.1007/s10950-023-10148-6.
21. Saetang K., Srisawat W., Dürrast H., 2018. Crustal Structures, Geothermal Sources and Pathways Beneath Northern Thailand Revealed by Local Earthquake Tomography. Chiang Mai Journal of Science 45 (1), 565–575.
22. Searle M.P., Morley C.K., 2011. Tectonic and Thermal Evolution of Thailand in the Regional Context of SE Asia. In: M.F. Ridd, A.J. Barber, M.J. Crow (Eds), The Geology of Thailand. Geological Society of London, p. 539–571. https://doi.org/10.1144/GOTH.20.
23. Shapiro N.M., Ritzwoller M.H., 2002. Monte-Carlo Inversion for a Global Shear-Velocity Model of the Crust and Upper Mantle. Geophysical Journal International 151 (1), 88–105. https://doi.org/10.1046/j.1365-246X.2002.01742.x.
Nakhon Si Thammarat Province, 80280, Thailand
Nakhon Si Thammarat Province, 80000, Thailand
Saetang K., Srisawat W. DIRECT INVERSION OF RAYLEIGH WAVE GROUP VELOCITY DISPERSION FOR 3D CRUSTAL SHEAR WAVE VELOCITY STRUCTURE IN THAILAND, MYANMAR, AND MALAYSIA. Geodynamics & Tectonophysics. 2025;16(1):0803. https://doi.org/10.5800/GT-2025-16-1-0803. EDN: lezdxi


Editor-in-Chief
Sklyarov E.V.664033, Irkutsk, Lermontova St., 128,
IEC SB RAS Institute of the Earth's crust
E-mail.: gt@crust.irk.ru
tel.: 8 3952 425422
Processing of personal data


