


Contents
Scroll to:
https://doi.org/10.5800/GT-2025-16-1-0804
EDN: yrhysl
Scroll to:
The aim of this study is to quantify and map a recent seismic swarm sequence that occurred in the Alboran Sea between 2020 and 2021, focusing specifically on the South Alboran Basin. To identify the seismic clusters, a criterion based on seismicity is employed, considering the distribution of two parameters: the kernel density of earthquakes and the kernel density of seismic moments. The first parameter reveals the presence of two seismic clusters: one located north of Al Hoceima, specifically within the southern segment of the Al-Idrissi Fault System (AIFS), and another in the Granada Basin. The second parameter indicates that both clusters released significant amounts of energy, particularly in the southern part of the AIFS, with values reaching up to 1.6·1014 J·km–2·year–1. The 3D seismic modeling indicates a clustering of seismic occurrences in northern Morocco, displaying an eastward pattern in terms of depth. This observation leads to speculation about the existence of nearby geological formations, possibly associated with the AIFS system. Analysis according to the Gutenberg-Richter law shows that the seismic swarm sequence in the southern Alboran Basin exhibits a b-value close to 1, indicating a slip regime. Temporal analysis of the b-value variation reveals two stress regimes: an initial decreasing regime with a b-value close to one, succeeded by a sharp increase indicative of an extensional regime, possibly due to fracture opening. The focal mechanisms show an alternation between strikeslip and strike-slip with normal components, indicative of a transtensional regime. This type of faulting suggests both lateral motion and some degree of extensional force, which aligns with certain rises in the b-value, as these could correspond to stress release events associated with opening fractures or fault segments, although the timing does not perfectly match b-value fluctuations. Together, these findings highlight a complex tectonic environment marked by strike-slip and transtensional forces, supporting the ongoing southern development of the AIFS.
Bouhali K., Rouai M., Dekayir A., Essaied A. THE SOUTH ALBORAN BASIN SEISMIC SWARM IN 2020-2021 AND ITS POSSIBLE RELATION TO THE SOUTHERN DEVELOPMENT OF THE AL-IDRISSI FAULT SYSTEM. Geodynamics & Tectonophysics. 2025;16(1):0804. https://doi.org/10.5800/GT-2025-16-1-0804. EDN: yrhysl
Earthquake swarms represent a distinct form of seismic activity that diverges from the typical mainshock-aftershock pattern or Omori’s law [Sykes, 1970; Hainzl, 2003]. They are often associated with volcanic processes [Aoki et al., 1999; Hayashi, Morita, 2003]. Conversely, non-volcanic earthquake swarms have been observed at plate boundaries [Shimamoto, 1993; Tryggvason, 1973] and within tectonic plates [Lopes et al., 2010]. To comprehend the seismic sources and spatial distribution of seismic events, it is imperative to map seismic swarms. The proposed methodology [Sharon et al., 2020] stands out as highly effective for earthquake modeling, facilitating the quantitative characterization of regional seismicity by generating both earthquake kernel density maps and seismic moment (M0) kernel density maps [Deif et al., 2023; Sharon et al., 2020].
The recently increased seismic activity has been observed in the Alboran Sea, particularly within the South Alboran Basin, marked by a notable increase in seismic events, including aftershock sequences and clustered seismic swarms. An overview of historical and instrumental seismicity in the Alboran Sea reveals significant seismic occurrences such as the Adra earthquakes [Peláez et al., 2007] in 1804 and 1910 (MSK Intensity VIII–X), the Al Hoceima earthquakes in 1994 and 2004 with magnitudes Mw=6 and Mw=6.3, respectively [Cherkaoui, El Hassani, 2012], as well as the 2016 Mw=6.4 earthquake off the coast of Al Hoceima [Buforn et al., 2017; Medina, Cherkaoui, 2017], considered the most intense seismic event in the region. Positioned along the convergent boundary of the African and Eurasian plates, the Al Hoceima region is considered as the most seismically active area in the southern Alboran Sea [Hamdache et al., 2022]. Recent data from the National Center for Scientific and Technical Research (CNRST) indicates a prolonged seismic swarm in the South Alboran Basin spanning several months in 2020–2021. This study aims to delineate the seismic swarm to discern the spatial clustering of seismic events both at the surface and in depth. Employing the methodology proposed by [Sharon et al., 2020], we quantify the density of seismic events per square kilometer during the swarm period, encompassing approximately two years (2020 & 2021). Additionally, to visualize the spatial distribution in depth, the hypocenters have been mapped in three dimensions to elucidate the tectonic processes in the region where the seismic activity occurred.
The Alboran Sea, situated in the western Mediterranean region between the Iberian Peninsula and northern Morocco, lies at the boundary the Eurasian and African plates. Bathymetric data sourced from the General Bathymetric Chart of the Oceans (https://www.gebco.net/) illustrate the intricate morphology of the sea floor, accentuated by the presence of mountainous landforms known as the Alboran ridges (AR). To facilitate study, many researchers [Gràcia et al., 2019; Ercilla et al., 2021; d’Acremont et al., 2022] have partitioned the basin into three distinct segments (Fig. 1): the South Alboran Basin (SAB), the East Alboran Basin (EAB), and the West Alboran Basin (WAB). Present-day crustal deformations result from fault systems within the broader framework of NW-SE to NNW-SSE trending convergence (4.5–5.6 mm/yr) between the Nubian and Eurasian plates [DeMets et al., 2015], serving as the primary driver of seismic activity.
The sea floor of the Alboran Sea is characterized by a network of normal and strike-slip faults. The Youssuf fault (YF) network, representing the dextral strike-slip system [Stich et al., 2020], contributes to numerous seismic events in northern Algeria. Additionally, fault systems such as Carboneras (CF), Nekor (NK), and Al Idrissi (AIFS) correspond to sinistral strike-slip faults, with the Al Idrissi fault system obviously associated with significant earthquakes in northern Morocco [Gràcia et al., 2019; Stich et al., 2020].
Given the large scale of the investigation area, precise earthquake coordinates are essential for effective spatial data processing. While most seismic stations in Morocco are concentrated in the northern region, Spain is equipped with a dense network of seismic stations (https://visualizadores.ign.es/estaciones_sismicas/). For this study, we utilized data from both the CNRST and the Instituto Geográfico Nacional (IGN) to handle spatial data processing and mapping. The seismic events under analysis were located within the coordinates 35–37 °N and 2–8 °W, covering the period from January 1, 2020, to December 31, 2021. Over this timeframe, there were recorded 6.354 seismic events with magnitudes ranging from 1.5 to 5.1 (1.5<M≤5.1) and depths varying from 1 to 200 kilometers. The maximum location uncertainties for these events are less than 10 km horizontally. We also referenced seismogenic zones defined by the Geological and Mining Institute of Spain (ZEIS Database, https://info.igme.es/zesis/) to identify precisely the locations of seismic swarms. While both the CNRST and IGN catalogues were employed for spatial data processing and mapping, the statistical analysis was based solely on the CNRST catalogue, which reports local magnitudes. Detailed descriptions of the methodology and statistical approaches will be provided in the methods section.
Fig. 2 depicts the spatial distribution of seismic events in the Alboran Sea, highlighting clusters of heightened seismic activity concentrated within specific seismogenic zones such as the Alboran Ridge – Central Rif (AR – CR), the Granada Basin (GB), and the Gulf of Cadiz North (GCN).
The focal mechanisms, as shown in Table.1, for earthquakes with magnitudes greater than 3, were acquired from the IGN open access data.
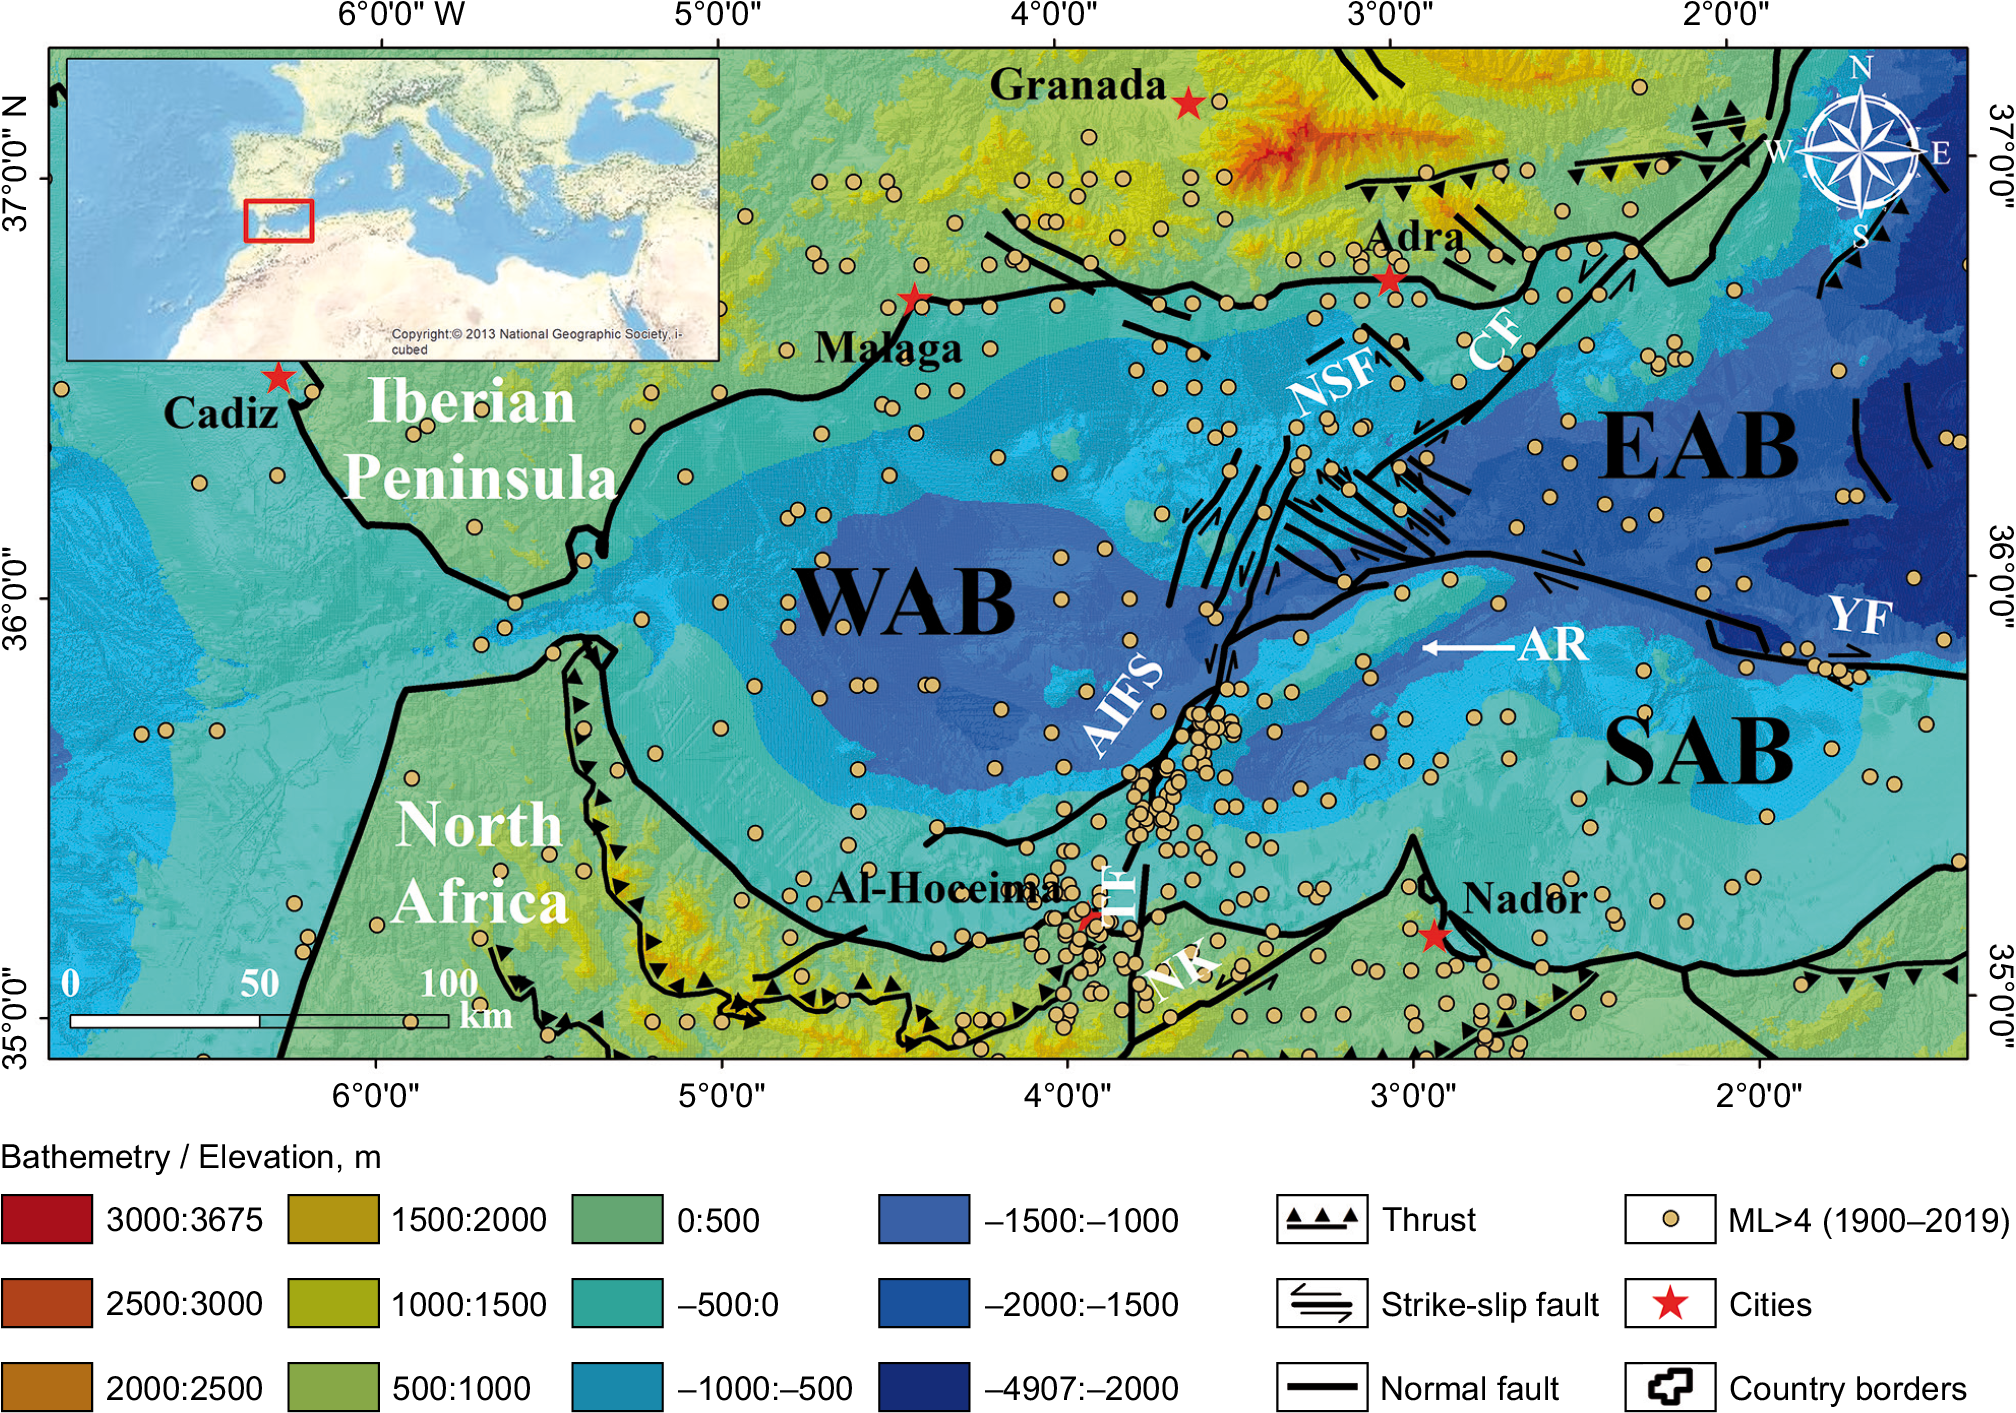
Fig. 1. Main structures of the Alboran Sea overlaid on the bathymetric/elevation map, showing seismicity (ML>4) prior to the earthquake swarm.
EAB – East Alboran Basin, WAB – West Alboran Basin, SAB – South Alboran Basin, AR – Alboran ridges. The main faults (after [Gràcia et al., 2019]): AIFS – Al-Idrissi fault system, NK – Nekor fault, CF – Carboneras fault, TF – Trougout fault, NSF – North-South faults, YF – Yusuf fault.
Рис. 1. Основные структуры Альборанского моря, нанесенные на батиметрическую/изобатическую карту сейсмической активности (ML>4), предшествующей рою землетрясений.
EAB – Восточно-Альборанская впадина, WAB – Западно-Альборанская впадина, SAB – Южно-Альборанская впадина, AR – Альборанский хребет. Главные разломы (по [Gràcia et al., 2019]): AIFS – система разломов Аль-Идрисси, NK – Некорский разлом, CF – разлом Карбонерас, TF – разлом Трогаут, NSF – разломы в направлении с севера на юг, YF – Юсуфский разлом.
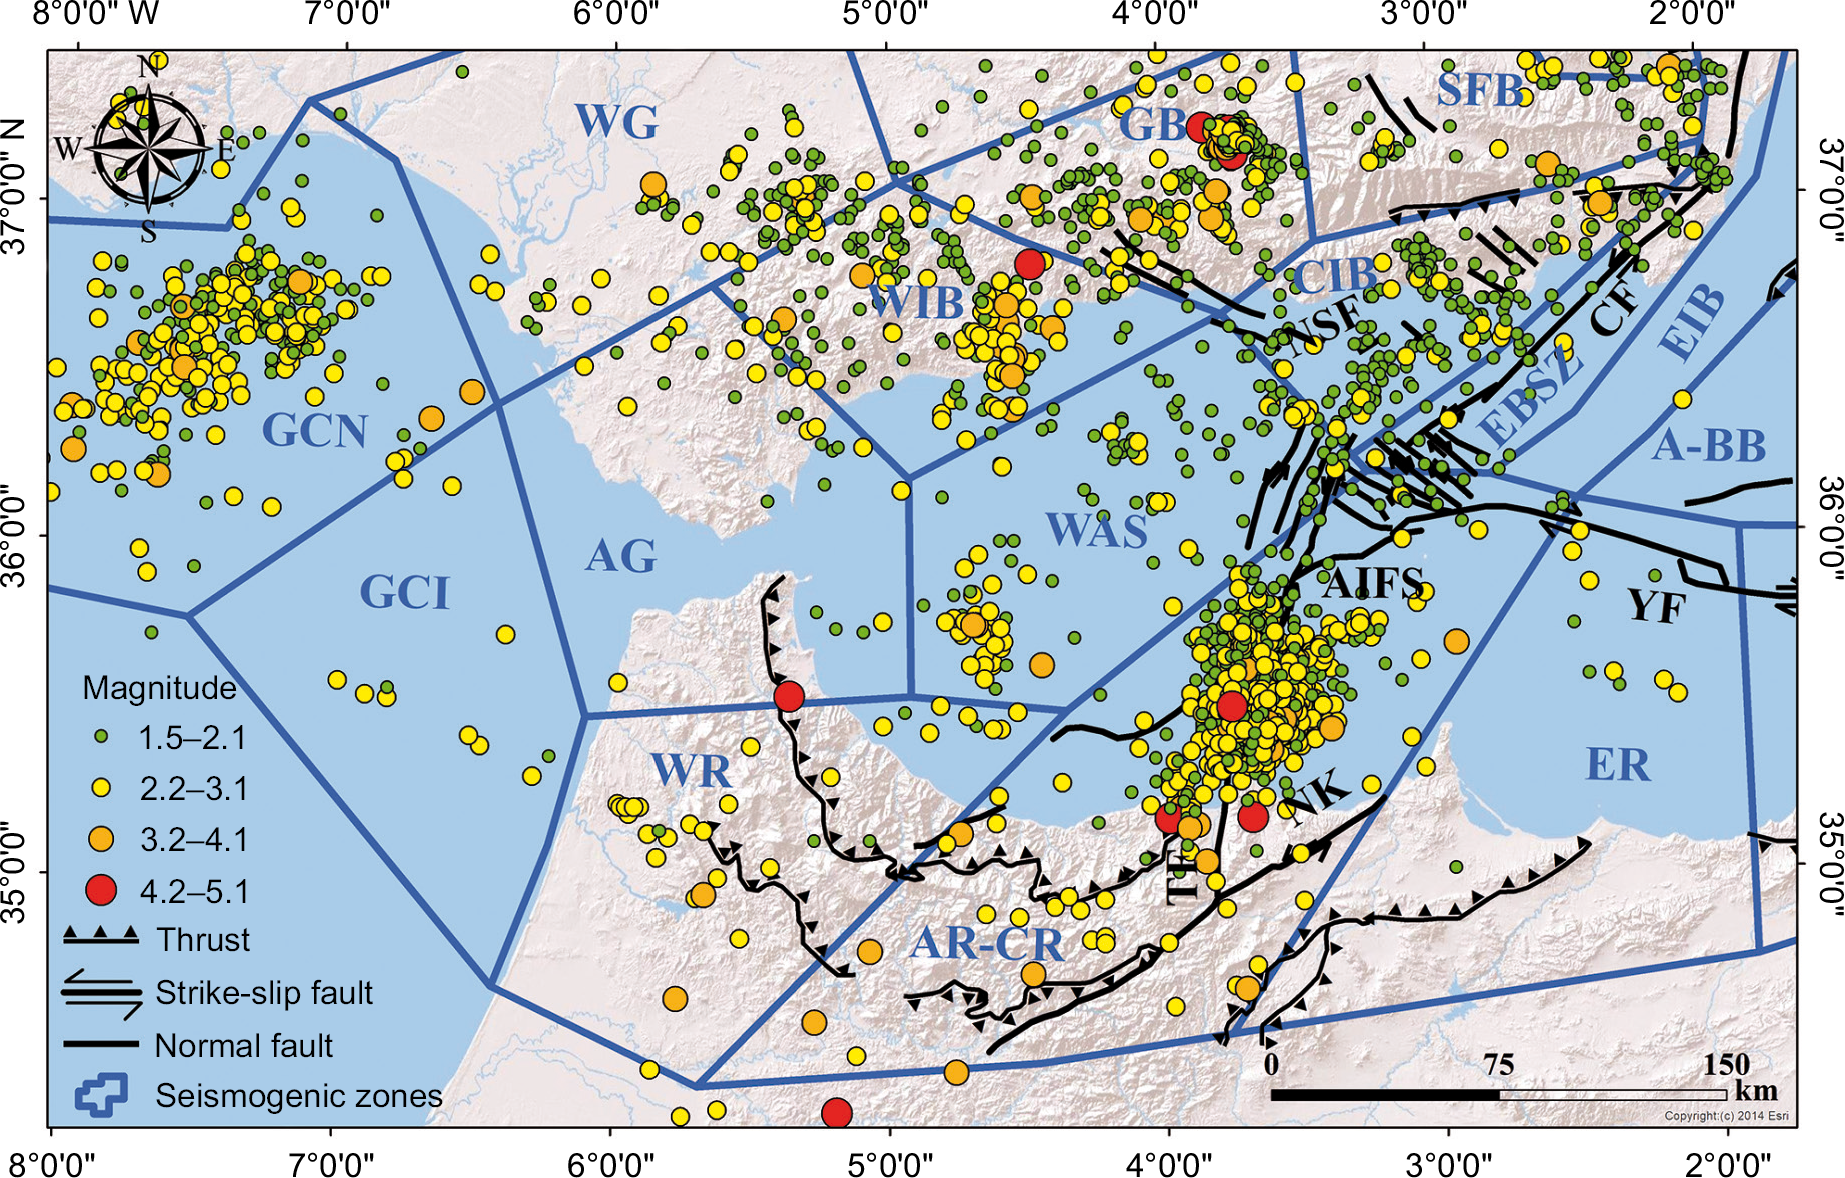
Fig. 2. Spatial distribution of the seismicity in the Alboran Sea during 2020–2021, superimposed on the seismogenic zones.
Рис. 2. Пространственное распределение сейсмичности в Альборанском море в течение 2020–2021 гг., с наложением на сейсмогенные зоны.
Table 1. Parameters of earthquakes with M>3 recorded during the Alboran Sea seismic swarm
Таблица 1. Параметры землетрясений с M>3, зарегистрированных при проявлении роевой сейсмической активности в Альборанском море
|
Date and time |
Latitude |
Longitude |
Z |
Mw |
Plane A |
Plane B |
Agency |
||||
|
Strike |
Dip |
Rake |
Strike |
Dip |
Rake |
||||||
|
30/12/2021 15:28:20 |
35.4549 |
–3.6736 |
5 |
4.0 |
234 |
84 |
13 |
142 |
77 |
174 |
NGI |
|
23/12/2021 01:54:26 |
35.1483 |
–3.9071 |
5 |
4.5 |
162 |
64 |
–82 |
324 |
28 |
–106 |
NGI |
|
14/11/2021 04:53:20 |
35.4292 |
–3.6654 |
7 |
3.9 |
81 |
90 |
–178 |
351 |
88 |
0 |
NGI |
|
14/11/2021 04:48:27 |
35.4363 |
–3.6287 |
13 |
4.4 |
4 |
75 |
–26 |
102 |
65 |
–163 |
NGI |
|
23/10/2021 19:54:02 |
35.4126 |
–3.6643 |
7 |
3.8 |
360 |
81 |
–18 |
93 |
72 |
–170 |
NGI |
|
24/09/2021 00:31:27 |
35.5881 |
–3.7363 |
5 |
3.8 |
101 |
84 |
–153 |
8 |
64 |
–7 |
NGI |
|
19/09/2021 00:31:48 |
35.4570 |
–3.6333 |
7 |
4.0 |
359 |
77 |
–14 |
93 |
76 |
–167 |
NGI |
|
01/09/2021 12:51:59 |
35.4355 |
–3.6538 |
5 |
4.1 |
356 |
87 |
–33 |
88 |
57 |
–176 |
NGI |
|
28/08/2021 12:09:43 |
35.4594 |
–3.6148 |
5 |
4.0 |
8 |
73 |
–32 |
109 |
59 |
–160 |
NGI |
|
28/08/2021 11:20:50 |
35.4545 |
–3.6202 |
6 |
5.1 |
14 |
82 |
–13 |
105 |
77 |
–172 |
NGI |
|
08/08/2021 05:50:39 |
35.3843 |
–3.5447 |
6 |
4.0 |
1 |
90 |
–21 |
91 |
69 |
–180 |
NGI |
|
07/08/2021 04:19:16 |
35.4648 |
–3.6241 |
5 |
4.4 |
13 |
86 |
–19 |
105 |
71 |
–176 |
NGI |
|
02/08/2021 14:06:10 |
35.4886 |
–3.6928 |
5 |
4.0 |
11 |
76 |
–20 |
107 |
70 |
–165 |
NGI |
|
01/08/2021 10:48:19 |
35.4734 |
–3.6069 |
15 |
4.0 |
6 |
77 |
–18 |
100 |
72 |
–167 |
NGI |
|
30/07/2021 09:13:03 |
35.4978 |
–3.6597 |
5 |
4.2 |
279 |
89 |
–167 |
189 |
77 |
–1 |
NGI |
|
30/07/2021 08:58:51 |
35.4144 |
–3.6350 |
5 |
4.5 |
6 |
84 |
–21 |
99 |
69 |
–173 |
NGI |
|
30/07/2021 08:38:53 |
35.4474 |
–3.6204 |
5 |
4.3 |
12 |
86 |
–14 |
103 |
76 |
–175 |
NGI |
|
11/07/2021 11:40:03 |
35.4397 |
–3.6789 |
10 |
4.3 |
15 |
82 |
–21 |
108 |
69 |
–171 |
NGI |
|
22/06/2021 14:54:33 |
35.4346 |
–3.6385 |
5 |
4.0 |
16 |
89 |
–16 |
107 |
74 |
–179 |
NGI |
|
19/06/2021 03:23:06 |
35.4843 |
–3.6428 |
5 |
4.7 |
8 |
85 |
–12 |
99 |
78 |
–175 |
NGI |
|
27/05/2021 22:55:43 |
35.4143 |
–3.6537 |
4 |
4.0 |
11 |
84 |
–24 |
103 |
66 |
–174 |
NGI |
|
23/05/2021 06:42:15 |
35.4417 |
–3.6981 |
5 |
4.2 |
7 |
81 |
–20 |
100 |
71 |
–170 |
NGI |
|
23/05/2021 06:18:39 |
35.3674 |
–3.6901 |
7 |
4.1 |
4 |
80 |
–18 |
97 |
72 |
–170 |
NGI |
|
21/05/2021 11:10:55 |
35.4490 |
–3.6549 |
7 |
4.1 |
2 |
76 |
–21 |
97 |
69 |
–165 |
NGI |
|
14/05/2021 06:54:58 |
35.4855 |
–3.6089 |
9 |
4.0 |
14 |
82 |
–15 |
106 |
75 |
–172 |
NGI |
|
11/05/2021 16:52:03 |
35.4672 |
–3.6494 |
5 |
4.0 |
7 |
81 |
–20 |
100 |
71 |
–170 |
NGI |
|
01/05/2021 22:10:06 |
35.4227 |
–3.6167 |
5 |
4.3 |
13 |
85 |
–12 |
104 |
78 |
–175 |
NGI |
|
28/04/2021 12:40:51 |
35.4957 |
–3.6635 |
9 |
4.1 |
14 |
85 |
–13 |
105 |
77 |
–175 |
NGI |
|
17/04/2021 09:51:29 |
35.3931 |
–3.6783 |
6 |
3.9 |
6 |
84 |
–21 |
99 |
69 |
–173 |
NGI |
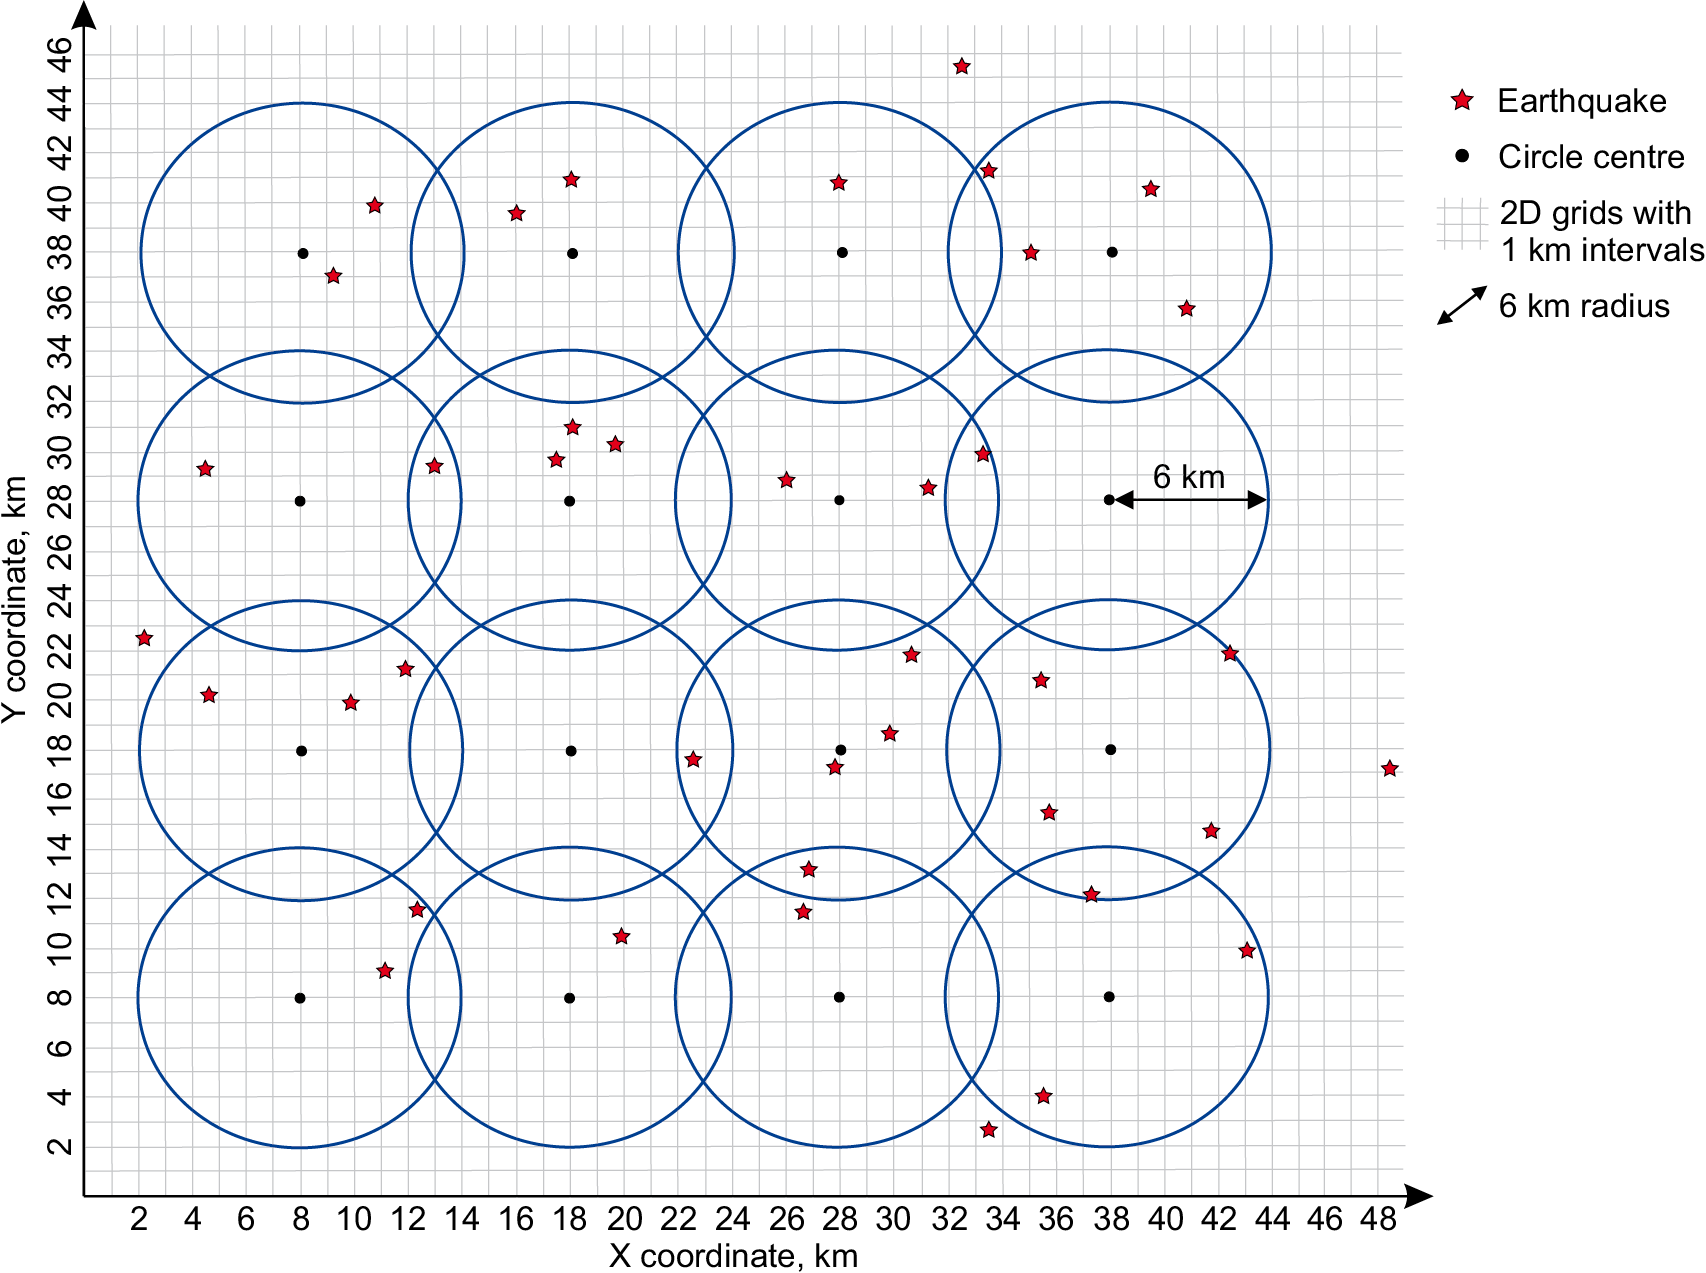
Fig. 3. Representative illustration of the method used to compute the earthquake kernel density.
Рис. 3. Репрезентативная иллюстрация метода, используемого для вычисления плотности ядра землетрясения.
To quantify regional seismicity, we utilized two parameters: earthquake kernel density and seismic moment (M0) kernel density. The subsequent spatial data processing steps outline the calculation of both parameters. A regional analysis was conducted in horizontal coordinates on a 2D grid with 1 km intervals. For each grid point, both parameters were computed using all recorded events within a 6 km radius. Kernel density estimation was employed as a method to ascertain the spatial distribution via a probability density function, where the distance from a reference point was utilized to weight each event.
The earthquake kernel density parameter, denoted as Nk, was computed by summing the weighted events within a 6 km radius of each grid point (Fig. 3), dividing their total by the sampling area (πr²), and normalizing by the earthquake catalogue duration (T) [Sharon et al., 2020]:
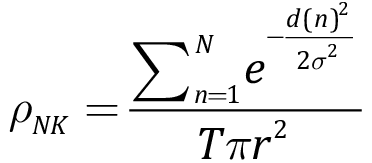 (1)
(1)
where N represents the number of earthquakes within a circle of radius r, d(n) denotes the distance between an earthquake event (n) and the center of the circle, σ represents the standard deviation of the Gaussian function, and T signifies the duration of the earthquake catalogue. The resulting values are expressed in events per square kilometer per year (events·km–2·year–1). The kernel density method allows for a more sophisticated visualization of seismic activity by smoothing the distribution of seismic events, which helps to reveal patterns and trends that might not be evident in a conventional epicenters map.
Our study encompasses a large area spanning over 33000 km2. The process of calculating the earthquake kernel density parameter is complex, particularly when considering the duration of the earthquake catalogue. Therefore, the utilization of computational tools is recommended to facilitate this calculation. For our investigation, we utilized the code (it's available at https://fr.mathworks.com/) and implemented several modifications to enhance the accuracy of our results.
To compute the kernel density of the seismic moment, denoted as ρMok, the seismic moment released by each seismic event must be determined using the following relationship proposed by [Hanks, Kanamori, 1979]:
 (2)
(2)
Each energy quantity is weighted according to the distance of the seismic event from the center of the circle, just like the earthquake kernel density estimation. The obtained results are expressed in J·km–2·year–1.
 (3)
(3)
The open-source software Zmap [Wiemer, 2001] was used for statistical analysis of seismic swarm event sizes and spatial distributions in order to deduce changes in local stresses. We used the Gutenberg Richter law to determine the b-value of the seismic swarm sequence, which is expressed as [Gutenberg, Richter, 1944]:
 (4)
(4)
where N is the number of events with magnitude larger than Mth. In this study, the b-value of the Gutenberg – Richter relation is used as an indicator of the stress regime [Schorlemmer et al., 2005]. The maximum curvature technique is used to analyze the frequency-magnitude data, and the maximum likelihood approach is used to estimate the b-value [Aki, 1965]:
 (5)
(5)
where  is the average magnitude value, M is the lower limit of the magnitude in the catalog, and ΔM is the catalog binning width. The following relationship describes the uncertainty in estimating the b-value [Shi, Bolt, 1982]:
 (6)
(6)
where nс is the number of earthquakes in the given sample.
The vertical stress is minimal for b values less than 1, indicating a compressive regime [Schorlemmer et al., 2005]. If the vertical stress is intermediate, the value of b is likely to be close to the universal value of unity, indicating a slip fault. If it exceeds 1, the stress regime is extensional [Schorlemmer et al., 2005].
As anticipated, Fig. 4 illustrates that the majority of earthquakes are concentrated along the AR – CR seismogenic zone, which includes the Al Idrissi fault system, with a lesser occurrence along the GB seismogenic zone. Moreover, notable clusters are observed in the GCN seismogenic zone, albeit with lower density values compared to the AR and GB zones. The seismic activity shows a more dispersed pattern at the junctions of the CIB and AR seismogenic zones, indicating the intersection of the AIFS and CF fault systems.
These findings reveal the occurrence of two seismic swarms in the Alboran Sea between 2020 and 2021. The most intense swarm, in terms of earthquake frequency, is associated with the Central Rif – Alboran Ridge, while the least intense swarm is linked to the Granada Basin.
According to the findings depicted in Fig. 5, the distribution pattern of seismic moment kernel density in the Alboran Sea closely mirrors that of earthquake kernel density, highlighting pronounced seismic activity zones along the AR and GB. Building upon the preceding observations, it is noteworthy that the locations of the two seismic swarms directly oppose each other. This prompts speculation regarding a potential correlation between these distinct seismic events.
Fig. 6 presents the temporal distribution of seismic events in the GB and AR – CR swarms. The GB swarm shows a sharp increase in seismicity around t=3∙107 seconds, followed by a decline in both the frequency and magnitude of events, indicating a rapid release of stress. In contrast, the AR – CR swarm exhibits continuous seismic activity over time, with frequent moderate to large events. This continuous seismicity suggests a prolonged period of stress release, distinct from the more abrupt behavior observed in the GB swarm.
The presence of two seismic swarms, namely the AR – CR and the GB, positioned opposite each other (face-to-face), may either be coincidental or suggestive of a deeper correlation. A review of literature concerning the Alboran Sea accentuates the intricate nature of the Betic-Rif orogenic system, fueling ongoing debates surrounding diverse geodynamic reconstructions. Prominent models propose subduction processes involving slab roll-back, delamination, slab break-off, or slab tearing, as postulated by [Royden, 1993; Lonergan, White, 1997; Spakman, Wortel, 2004; Jolivet et al., 2008; Vergés, Fernàndez, 2012]. Multiple tomographic studies have delineated a high-velocity structure pervading the upper mantle beneath the Betic Arc and Gibraltar Arc, as highlighted by [Gutscher et al., 2002; Spakman, Wortel, 2004; Bezada et al., 2013]. This anomalous structure displays characteristics resembling a slab and is likely indicative of subducted oceanic lithosphere (Fig. 7).
Seismic activity in the Alboran Sea primarily consists of shallow earthquakes below 40km, as reported by [Buforn et al., 1995; Morales et al., 1997]. Furthermore, intermediate earthquakes (40–150 km of depth) are frequent, predominantly associated with the subducting plate [Santos-Bueno et al., 2019; López-Sánchez et al., 2022]. Deep events, occurring rarely at depths of around 600–650 km, have also been documented, as observed by [Buforn et al., 2011; Chung, Kanamori, 1976]. Given this context, we are unable to offer a definitive explanation for the juxtaposition of these two seismic clusters, AR – CR and GB, in this instance. Consequently, it is advisable to construct a three-dimensional sketch illustrating the distribution of earthquakes at depth to ascertain the most appropriate interpretation.
Fig. 8, a, illustrates the three-dimensional distribution of earthquakes spanning from the Central Rif to the Betic Zone. Examining this diagram reveals a distinct orientation of seismic depth events extending eastward from the Central Rif. Conversely, within the Betic Zone, the structural pattern of earthquakes at depth appears less discernible, likely attributed to a smaller quantity of earthquakes compared to those located in the northern region of Morocco. The focal mechanism of the significant seismic event within the seismic swarm in the AR – CR indicates a left-lateral slip (IGN open access data), with a predominant nodal plane orientation of 14°/82°/–13° (strike/dip/rake). [Lozano et al., 2022] investigated the seismic sequence spanning from 2020 to 2021 in the GB and observed that the hypocenters follow a near-vertical pattern associated with normal faults. [Madarieta-Txurruka et al., 2022] conducted a study on the 2021 seismic sequence in the GB, revealing a concentrated "Chimney-shape" seismic activity resulting from the activation of a normal fault.
Based on the dissimilar orientation of seismic activity at depth between the AR – CR and the GB, along with differences in the tectonic regime of associated faults in these two seismogenic zones, it can be inferred that the positioning of these two seismic swarms opposite each other was coincidental, likely attributed to the high seismicity rate in these two regions. Since the two seismic swarm sequences are unrelated, we have turned our attention to studying the seismic activity in the AR – CR area. Here, we observed that the seismic activity is slanting towards the east. At first glance, this appeared to be related to subduction processes (Fig. 8, a, b), However, existing research indicates that the subduction zone, where intermediate earthquakes typically occur, is situated between longitudes 6–5 W° [Santos-Bueno et al., 2019; López-Sánchez et al., 2022], whereas the observed seismicity is concentrated between longitudes 3–4 W° (Fig. 8, b). These findings are intriguing and highlight the need for further exploration of this seismic swarm to determine if there are nearby structures, possibly associated with the AIFS system, influencing the seismic activity in the eastward direction.
The seismic activity in the CR – AR region seems to be focused mainly on the southern part of the AIFS, as shown in Figs. 4, 5, and 8. Many studies [El Alami et al., 1998; Medina, 2015; Medina, Cherkaoui, 2017; Gràcia et al., 2019] indicate that this specific segment of the fault system experienced significant seismic events during the 2016 crisis, as well as in previous occurrences in 1994 and 2004. Interestingly, there is a lack of strong seismic events in the central and northern segments of the AIFS. This suggests that these segments might be inactive or undergoing slow movement [Gràcia et al., 2019]. Additionally, research suggests that the AIFS has the potential to cause multiple segment ruptures [Gràcia et al., 2019], a phenomenon closely linked to the seismic activity observed in the South Alboran Sea in 2020 and 2021. Density distribution analyses highlight a high concentration of seismic events at the southern end of the AIFS, with significant energy release. To further investigate the cause of the South Alboran seismic swarm, changes in the tension regime during the swarm were monitored by observing the evolution of the b-value.
The b-value calculated for the seismic cluster in the South Alboran Sea is 1.16±0.04 (Fig. 9), which closely aligns with the b-values reported by [Hamdache et al., 2022] for the aftershock sequences following the 1994 event (b=1.01±0.07) and the 2004 event (b=1.04±0.05) by [Telesca et al., 2009]. Since these values are close to one, they suggest compatibility with a slip stress regime, as proposed by [Grob, van der Baan, 2011].
To ensure the accurate estimation of the b-value, we employed moving windows that maintain a consistent number of epicenters. This approach, as proposed by [De Rubeis et al., 1993], tracks the variation of spatial correlation dimension over time. Following numerous tests, we determined that a fixed number of 150 epicenters per window provides precise estimations. Analysis of the b-value variation over time reveals distinct stress regimes (Fig. 10): an initial strike-slip regime with a b-value approximating 1 transitions abruptly to an extensional regime [Schorlemmer et al., 2005]. This abrupt increase in b-value suggests the opening of fractures, thereby possibly supporting the concept of the AIFS southern development proposed by [Gràcia et al., 2019]. Subsequently, these two regimes have alternated. Comparable patterns have been observed in seismic swarms, such as the 2012–2013 seismic swarm in the Eastern Guadalquivir Basin (Southern Spain), where b-values indicate alternating extensional and strike-slip regimes [Peláez et al., 2015].
However, the b-value does not definitively establish the stress regime due to its sensitivity to various influencing factors. Although we utilize the b-value as an indicator of stress variation, a comprehensive analysis, including focal mechanism inversion, is necessary for a more accurate identification of the stress regime.
The focal mechanism data reveal a sequence of seismic events dominated by strike-slip faulting, with occasional evidence of an extensional component. The majority of events are characterized by steep dip angles and rake values near 0° or ±180°, indicating a predominantly lateral motion. However, several events show rake values between –20° and –80°, suggesting oblique mechanisms with a normal (extensional) component (Table 1). This alternation between pure strike-slip and strike-slip with normal faulting may indicate variations in the local stress field, potentially associated with transient stress changes or complex fault geometries (Fig. 11). The consistent presence of these strike-slip mechanisms, with intermittent extensional elements, implies a tectonic regime primarily governed by horizontal shear, with occasional influences from extensional forces likely due to local fault interactions or episodic changes in stress conditions.
The correlation between focal mechanism results and b-value trends appears complex rather than straightforward. The b-value graph shows periods of decreasing b-values, followed by sharp increases. This pattern suggests changes in stress regimes, with drops in b-value potentially indicating increased stress or fault locking, and rises pointing to possible fracture opening or release of stress. Meanwhile, the focal mechanisms show an alternation between strike-slip and strike-slip with normal components, indicative of a transtensional regime. This type of faulting suggests both lateral motion and some degree of extensional force, which aligns with certain rises in the b-value, as these could correspond to stress release events associated with opening fractures or fault segments.
However, the alternation in focal mechanisms does not perfectly mirror the exact timing or scale of b-value fluctuations. Instead, both sets of data collectively point to a variable stress regime but may reflect slightly different aspects of the tectonic process. The b-value is a statistical measure of earthquake magnitude distribution and tends to capture broader stress trends, while focal mechanisms provide a more direct view of the specific faulting style for individual events. Together, these analyses Alboran Ridge the region’s complex tectonic environment, where the interplay of strike-slip and transtensional forces may contribute to the ongoing southern development of the AIFS.
Fig. 4. The kernel density distribution of earthquakes in the Alboran Sea during the seismic swarm. The colors and corresponding numbers indicate the values in events per square kilometer per year (events·km–2·year–1).
Рис. 4. Распределение плотности ядра землетрясений в Альборанском море в ходе проявления роевой сейсмичности. Цветом и соответствующей ему цифрой показаны параметры событий из расчета на км2 в год (событие·км–2·год–1).
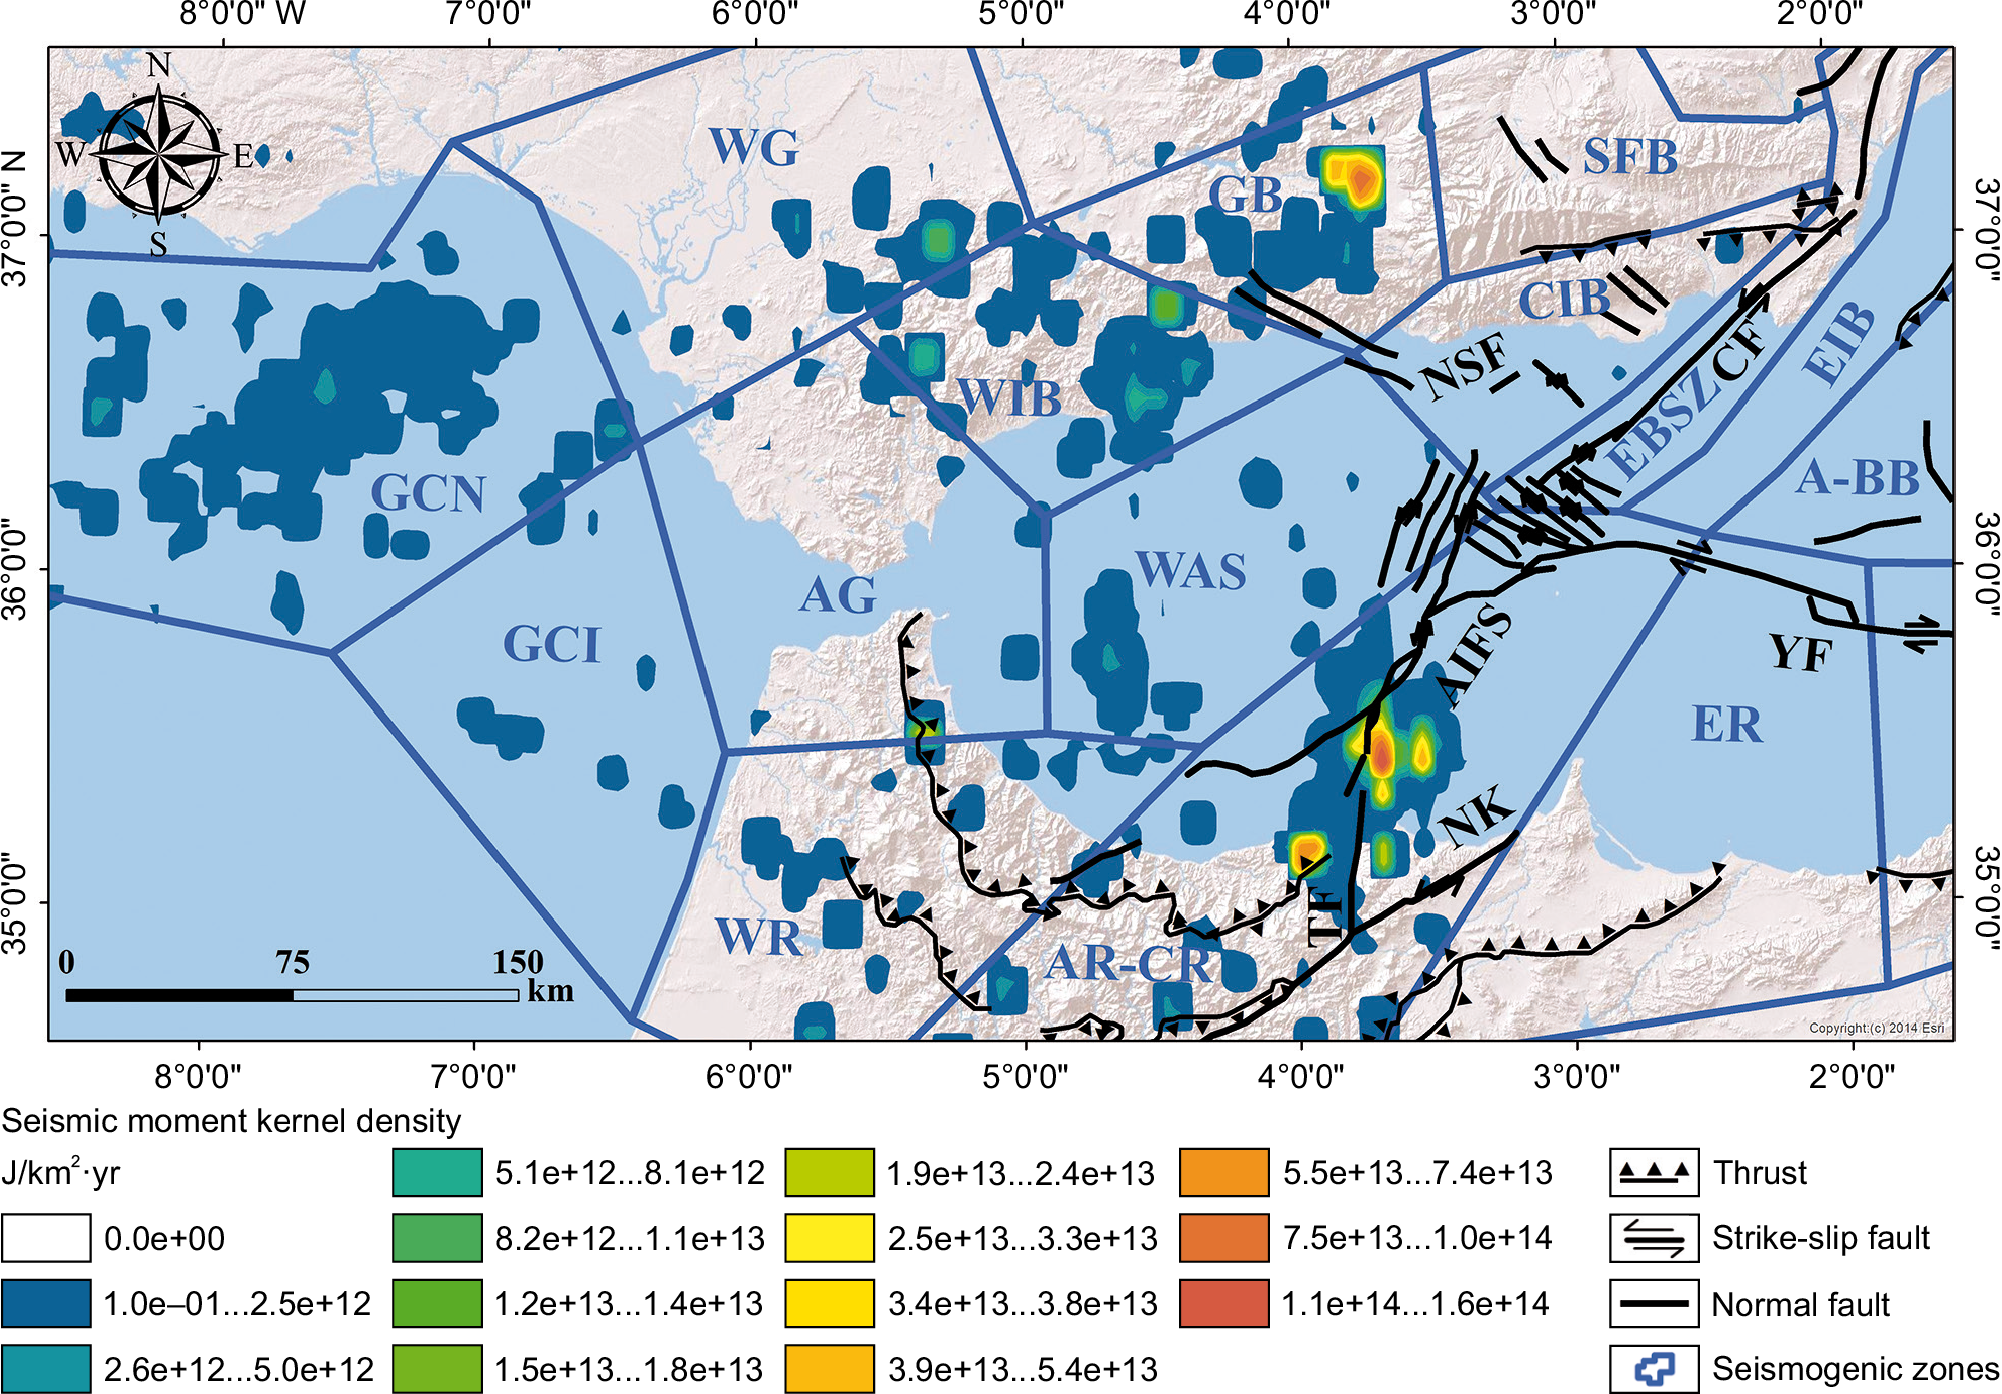
Fig. 5. The distribution of the seismic moment kernel density in the Alboran Sea during the seismic swarm. The colors and corresponding numbers indicate the value in events per square kilometer per year (J·km–2·year–1).
Рис. 5. Распределение плотности ядра сейсмического момента в Альборанском море в ходе проявления роевой сейсмичности. Цветом и соответствующей ему цифрой показаны параметры событий из расчета на км2 в год (Дж·км–2·год–1).
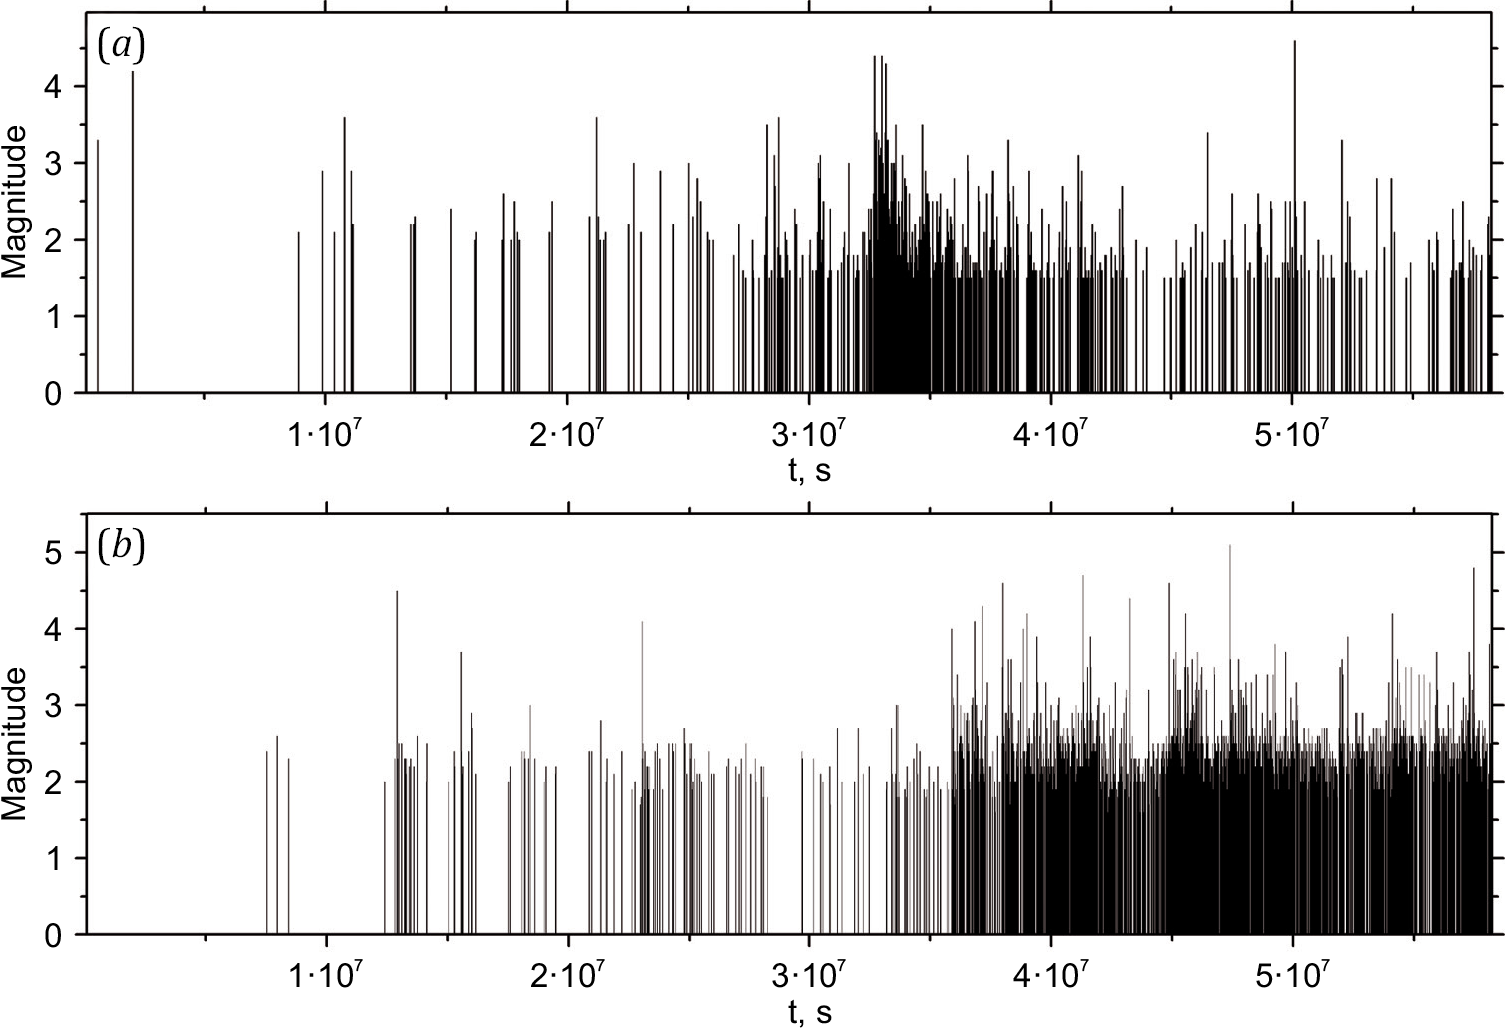
Fig. 6. Temporal distribution of seismic events in the Granada Basin (a) and Alboran Ridge – Central Rif (b) swarms.
Рис. 6. Временно́е распределение сейсмических событий в ходе проявления роевой сейсмичности в Гранадской впадине (a) и в зоне Альборанского хребта – Центрального рифа (b).
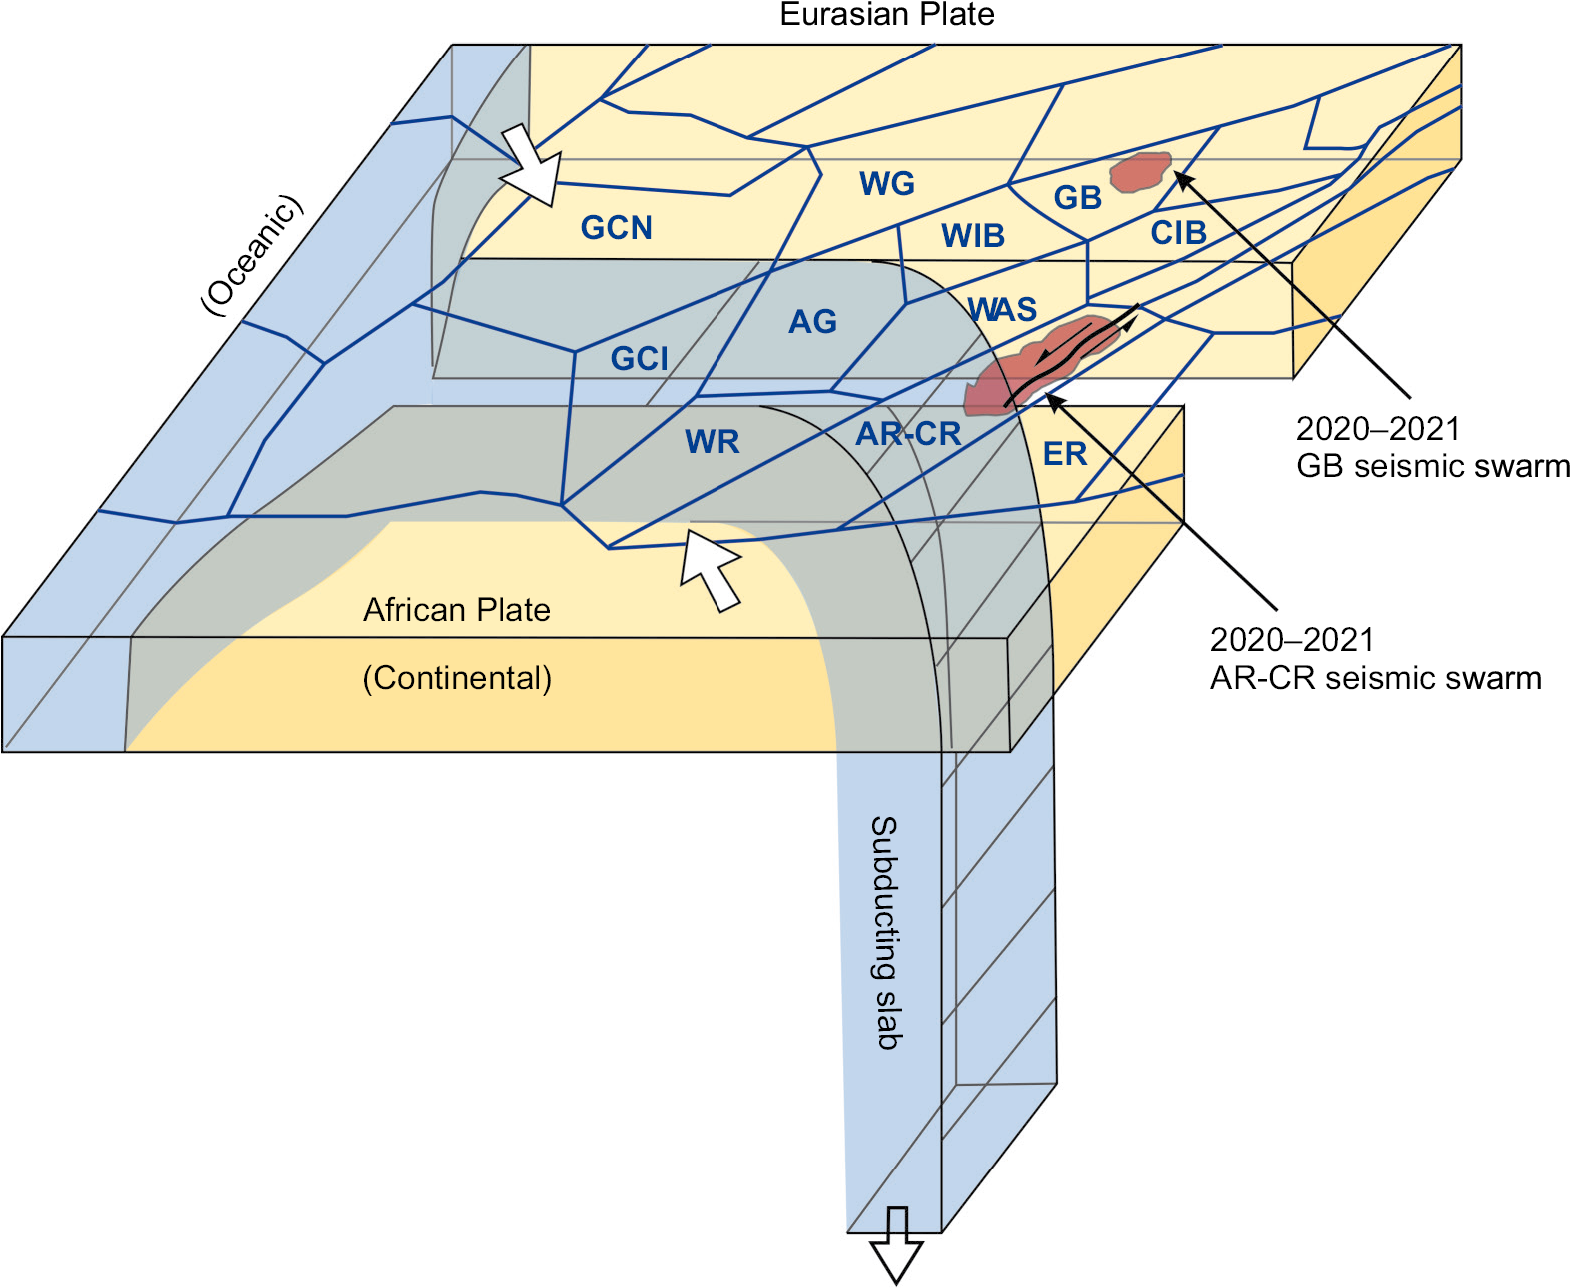
Fig. 7. Three-dimensional block diagram illustrating the sinking and roll-back of the oceanic lithosphere of the African Plate. Seismogenic zones and the locations of the Granada Basin and Alboran Ridge – Central Rif seismic swarms (2020–2021) are highlighted in color.
Рис. 7. Трехмерная блок-диаграмма, иллюстрирующая погружение и откатывание океанической литосферы Африканской плиты. Цветом выделены сейсмические зоны и места проявления роевой сейсмичности в Гранадской впадине и в зоне Альборанского хребта – Центрального рифа (2020–2021 гг.).
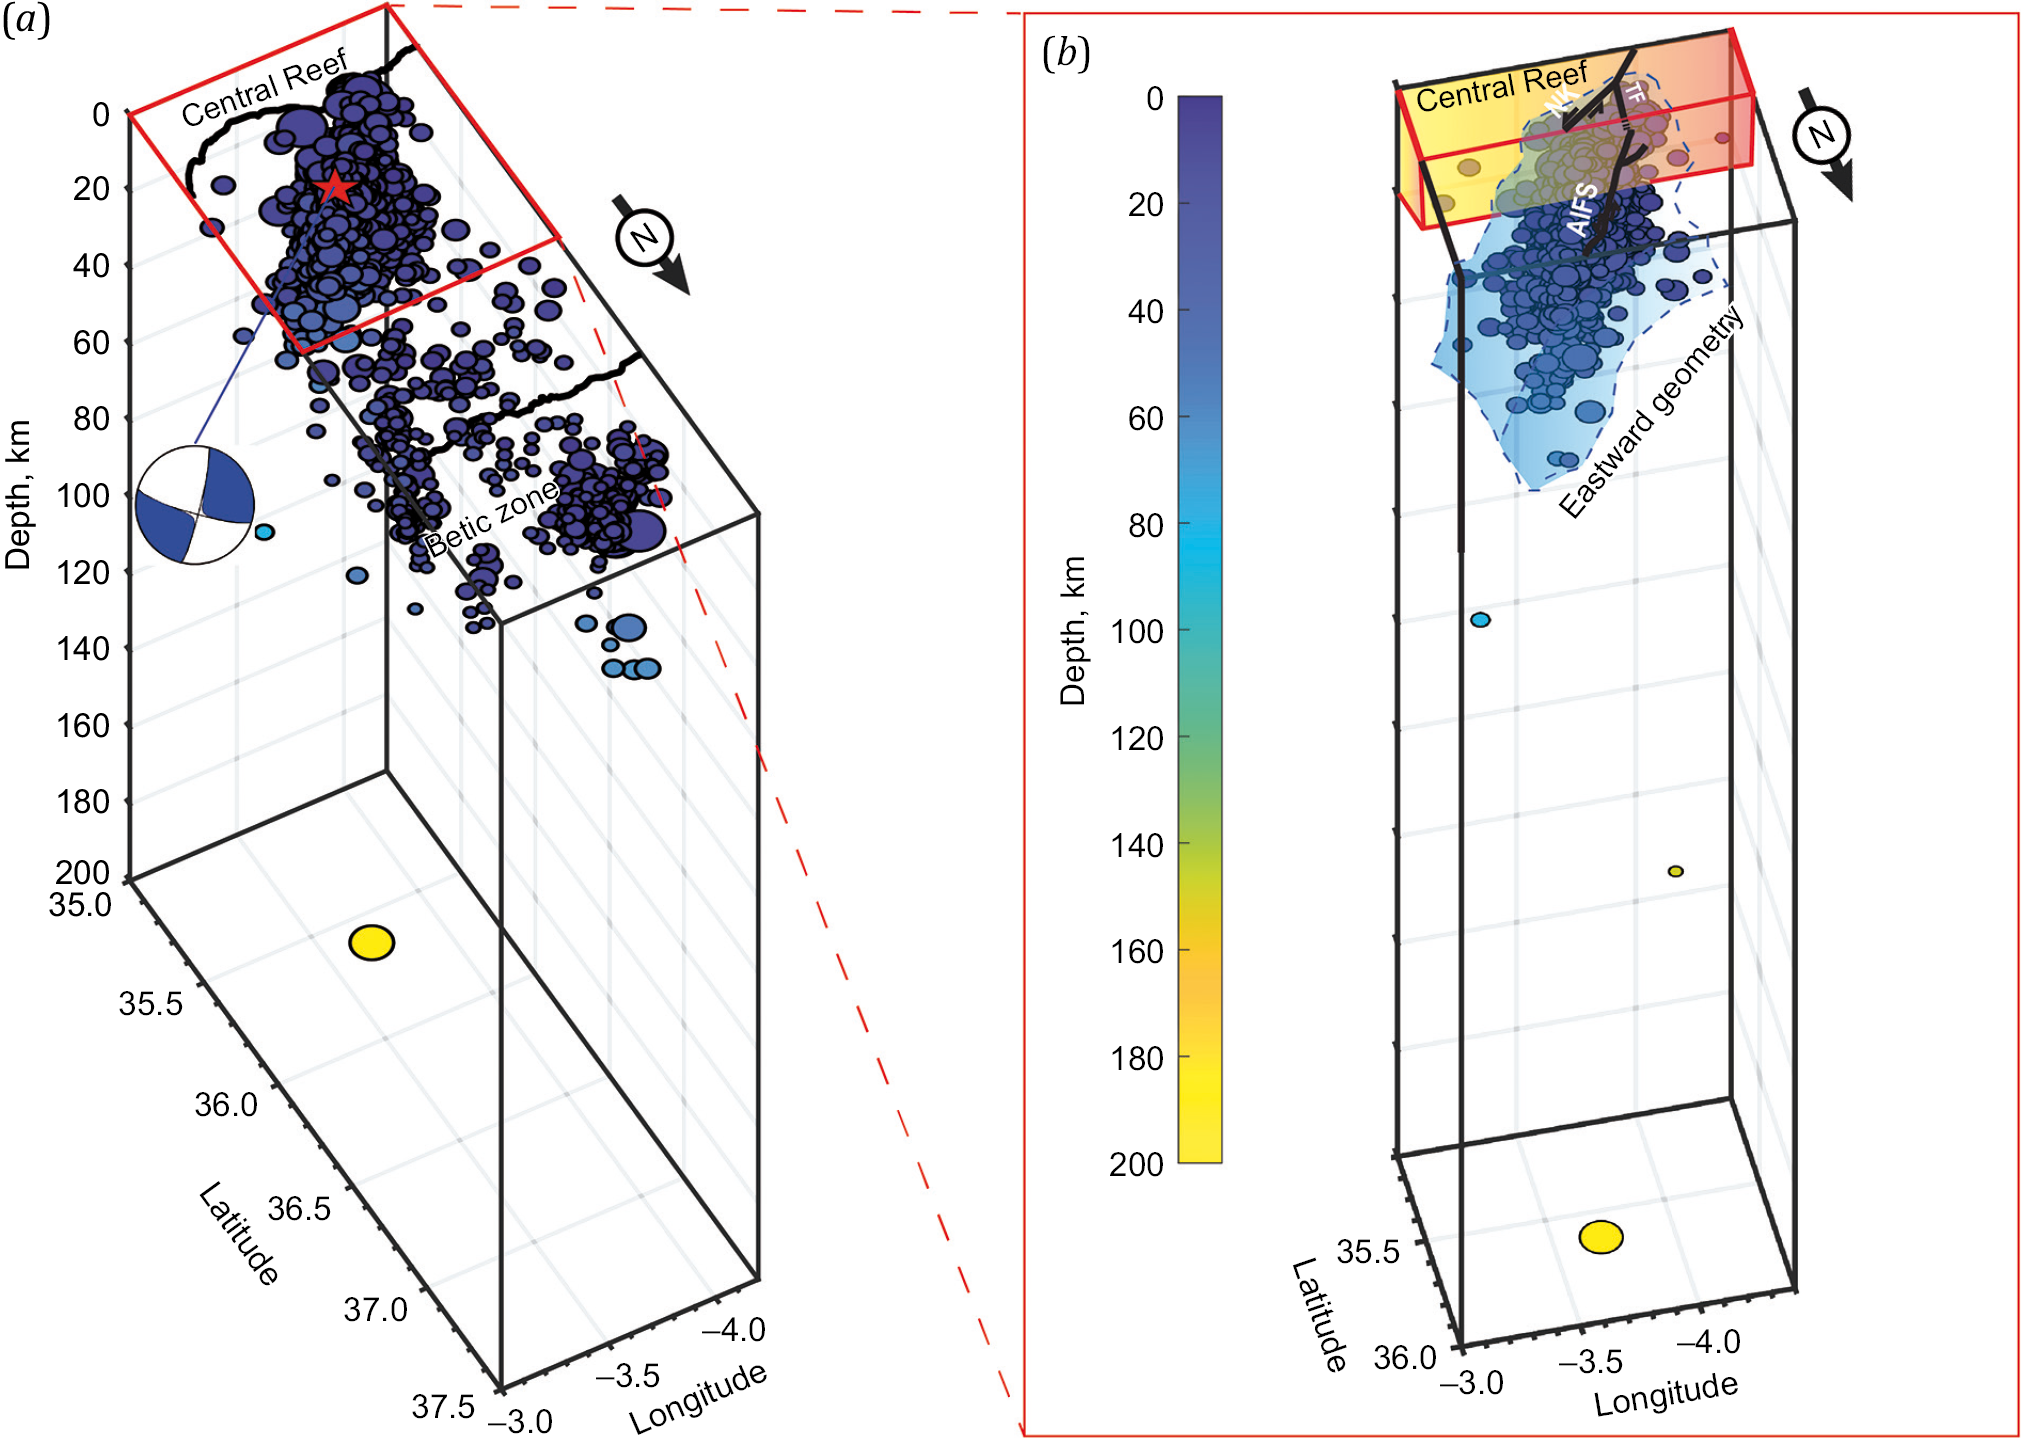
Fig. 8. 3D depiction of seismic occurrences within the Central Rif – Betic Zone spanning the years 2020–2021 (a) and 3D visualization of seismic events along the Alboran Ridge – Central Rif, illustrating their eastward-slanting geometry (b).
Рис. 8. 3D изображение сейсмических проявлений в зоне Центральный риф – Бетис в период 2020–2021 гг. (a) и 3D визуализация сейсмических событий вдоль зоны Альборанского хребта – Центрального рифа, иллюстрирующая их геометрию на плоскости с наклоном на восток (b).
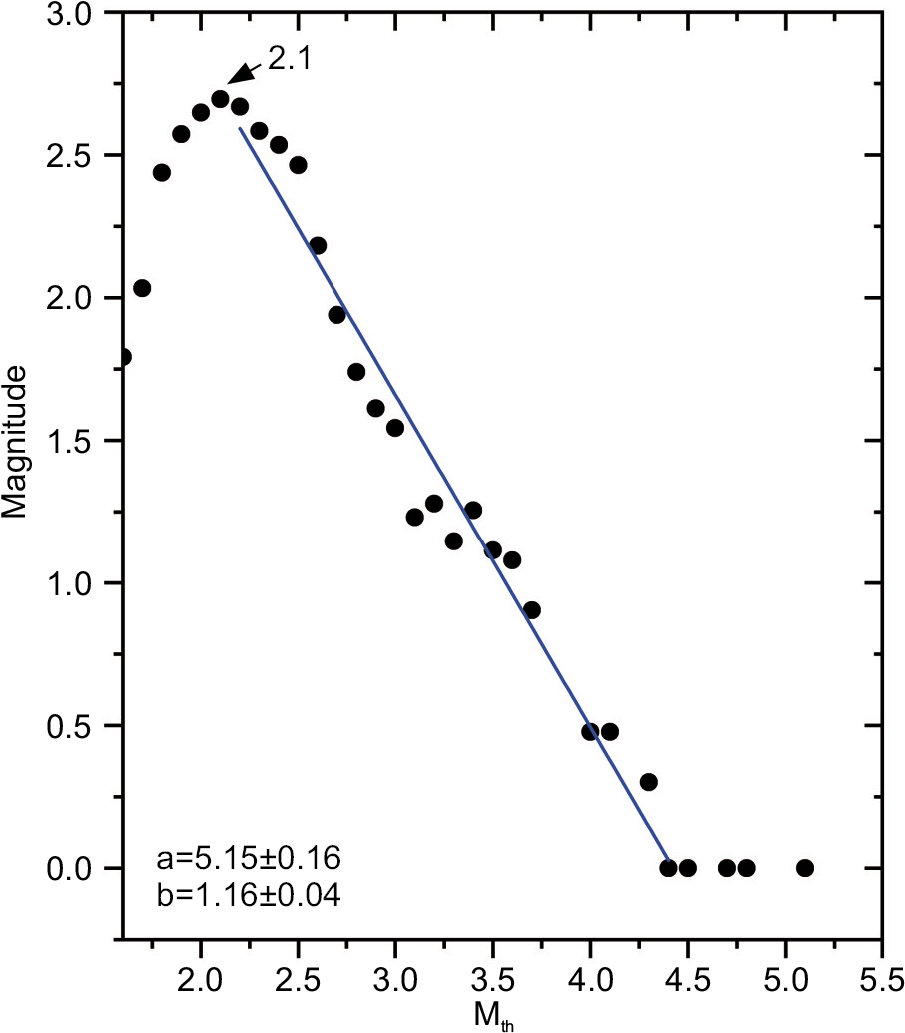
Fig. 9. Linear regression analyses representing seismic swarm data of the Alboran Ridge – Central Rif, fitted to a Gutenberg – Richter relationship.
Рис. 9. Анализ линейных регрессий, представляющий данные о роевой сейсмичности зоны Альборанского хребта – Центрального рифа, согласно закону Гутенберга-Рихтера.
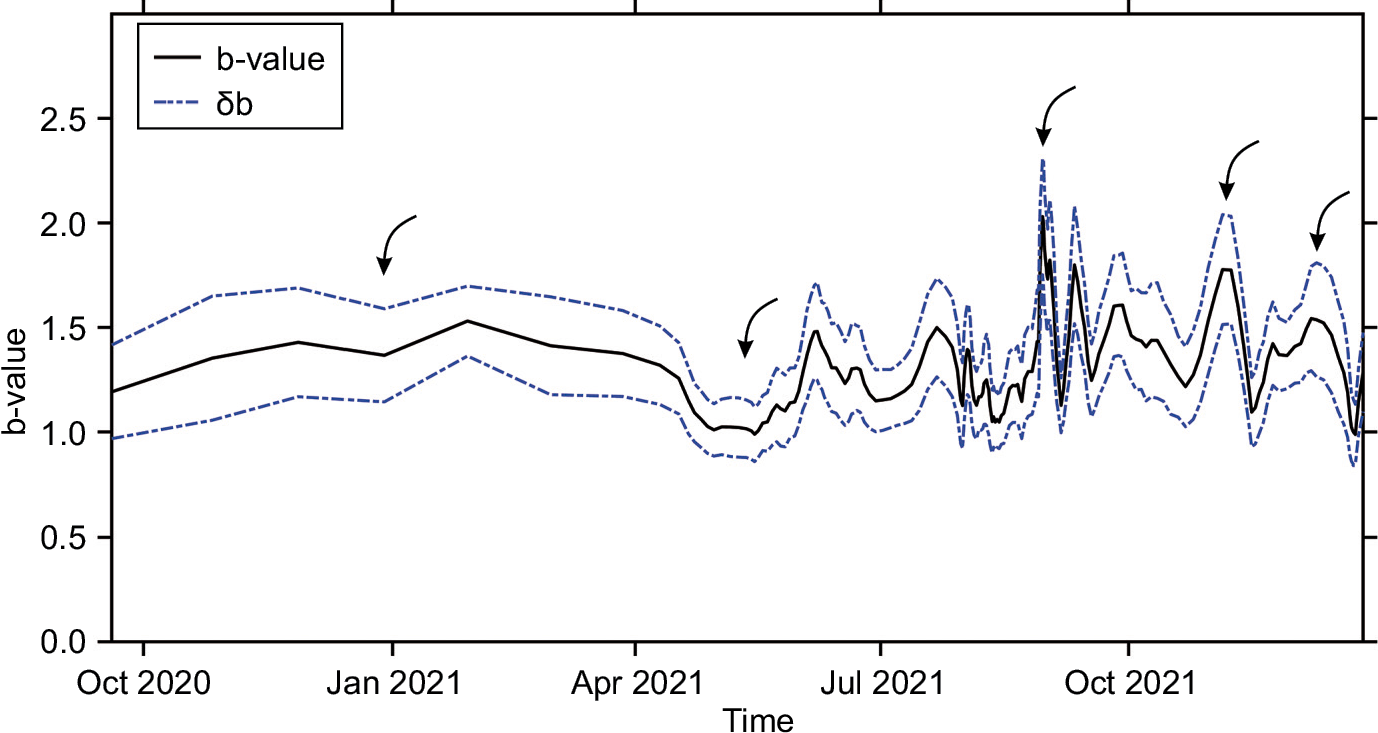
Fig. 10. Temporal evolution of the b-value within the seismic swarm sequence of the Alboran Ridge – Central Rif. The dotted blue line indicates b±δb.
Рис. 10. Эволюция значения b в рамках роевой последовательности землетрясений зоны Альборанского хребта – Центрального рифа. Синяя пунктирная линия обозначает b±δb.
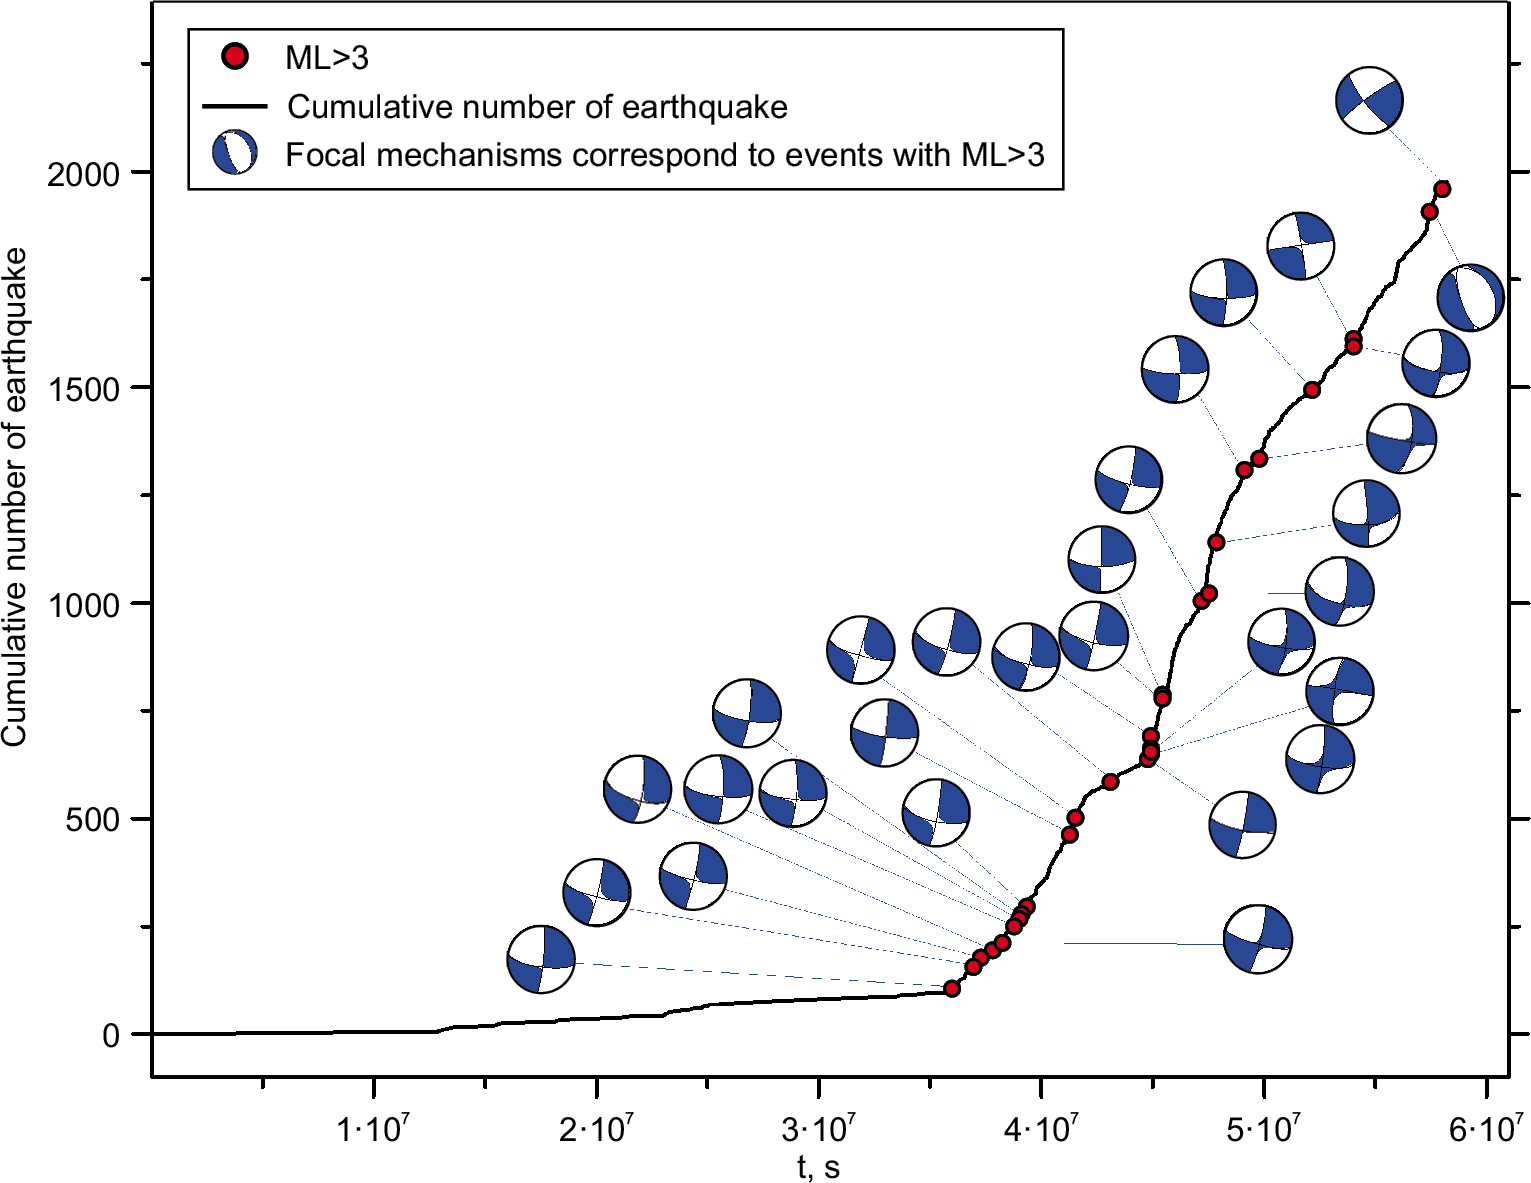
Fig. 11. Temporal variation of earthquake focal mechanisms and cumulative number of earthquakes (ML>3) showing alternating strike-slip and strike-slip with normal components.
Рис. 11. Временные изменения механизмов очагов землетрясений и суммарного количества землетрясений (ML>3), указывающие на чередование сдвигов и сдвигов со сбросовой компонентой смещений.
This study investigates the spatial distribution of seismic events in the Alboran Sea during 2020 and 2021, revealing a heterogeneous pattern with distinct clusters of heightened seismic activity concentrated in key seismogenic zones: the Alboran Ridge – Central Rif (AR – CR), Granada Basin (GB), and the Gulf of Cadiz (GCN). Magnitudes recorded range between 1.5 to 5.1. A seismicity-based approach is employed to pinpoint these clusters, utilizing two parameters: earthquake kernel density and seismic moment kernel density. The analysis identifies two seismic clusters: one situated north of Al Hoceima, specifically in the southern segment of the AIFS, and another in the Granada Basin. Furthermore, it reveals that these clusters exhibit substantial energy release, particularly in the southern part of the AIFS, with values reaching up to 1.6·1014 J/km–2·year–1. 3D seismic modeling conducted in the region spanning from the central Rif to the Betic zone indicates that the predominant seismic activity occurs at shallow depths, typically less than 40 kilometers, while fewer earthquakes are observed at intermediate depths, ranging between 40 and 200 kilometers. The concentration of seismic events in northern Morocco exhibits a depth-oriented eastward pattern, prompting speculation regarding the presence of adjacent geological structures, potentially linked to the AIFS system.
The main seismic event within the seismic swarm had a magnitude of 5.1 and was centered at the southern edge of the AIFS. Analysis of the focal mechanism of this event reveals a left-lateral slip stress regime, with a dominant nodal plane orientation of 14°/82°/–13° (strike/slip/rake). Examining the sequence of seismic activity in the southern Alboran Basin, a b-value close to 1, as derived from the Gutenberg – Richter law, suggests a slip-dominated regime. Further investigation into the variation of the b-value over time exposes distinct stress regimes: an initial decrease in stress with a b-value approximating one, succeeded by a notable rise in the b-value indicating an extensional regime, likely attributed to fracture opening. Subsequently, these regimes alternate. The focal mechanism data reveal a sequence of seismic events dominated by strike-slip faulting, with occasional evidence of an extensional component. The temporal variation of focal mechanisms throughout the seismic swarm shows a shift between strike-slip and strike-slip with normal components, suggesting a transtensional regime. This type of faulting suggests both lateral motion and some degree of extensional force, which aligns with certain rises in the b-value, as these could correspond to stress release events associated with opening fractures or fault segments, although the timing does not perfectly match b-value fluctuations. Together, these findings highlight a complex tectonic environment marked by strike-slip and transtensional forces, supporting the ongoing southern development of the AIFS, as suggested by several researchers [Buforn et al., 2017; Gràcia et al., 2019].
The applied approach proposed by [Sharon et al., 2020] has been used to map and localize the seismic swarm. While this approach has demonstrated success, it remains insufficient to fully comprehend this intricate phenomenon. Thus, for a comprehensive analysis of the seismic swarm sequence, it is highly advisable to employ fractal theory [Mandelbrot, 1989] to quantify both the spatial and temporal clustering of the earthquakes.
1. Aki K., 1965. Maximum Likelihood Estimate of b in the Formula LogN=a–bM and Its Confidence Limits. Bulletin of Earthquake Research 43, 237–239.
2. Aoki Y., Segall P., Kato T., Cervelli P., Shimada S., 1999. Imaging Magma Transport During the 1997 Seismic Swarm off the Izu Peninsula, Japan. Science 286 (5441), 927–930. https://doi.org/10.1126/science.286.5441.927.
3. Bezada M.J., Humphreys E.D., Toomey D.R., Harnafi M., Dávila J.M., Gallart J., 2013. Evidence for Slab Rollback in Westernmost Mediterranean from Improved Upper Mantle Imaging. Earth and Planetary Science Letters 368, 51–60. https://doi.org/10.1016/j.epsl.2013.02.024.
4. Buforn E., Pro C., Cesca S., Udías A., del Fresno C., 2011. The 2010 Granada, Spain, Deep Earthquake. Bulletin of the Seismological Society of America 101 (5), 2418–2430. https://doi.org/10.1785/0120110022.
5. Buforn E., Pro C., Sanz de Galdeano C., Cantavella J.V., Cesca S., Caldeira B., Udías A., Mattesini M., 2017. The 2016 South Alboran Earthquake (Mw=6.4): A Reactivation of the Ibero-Maghrebian Region? Tectonophysics 712–713, 704–715. https://doi.org/10.1016/j.tecto.2017.06.033.
6. Buforn E., Sanz de Galdeano C., Udías A., 1995. Seismotectonics of the Ibero-Maghrebian Region. Tectonophysics 248 (3–4), 247–261. https://doi.org/10.1016/0040-1951(94)00276-F.
7. Cherkaoui T. E., El Hassani A., 2012. Seismicity and Seismic Hazard in Morocco 1901–2010. Bulletin de l’Institut Scientifique, Section Sciences de La Terre 34, 45–55.
8. Chung W.-Y., Kanamori H., 1976. Source Process and Tectonic Implications of the Spanish Deep-Focus Earthquake of March 29, 1954. Physics of the Earth and Planetary Interiors 13 (2), 85–96. https://doi.org/10.1016/0031-9201(76)90073-X.
9. D’Acremont E., Lafuerza S., Rabaute A., Lafosse M., Jollivet Castelot M., Gorini C., Alonso B., Ercilla G. et al., 2022. Distribution and Origin of Submarine Landslides in the Active Margin of the Southern Alboran Sea (Western Mediterranean Sea). Marine Geology 445, 106739. https://doi.org/10.1016/j.margeo.2022.106739.
10. Deif A., Al Kubaisy H., Abu El-Nader I.F., El-Hussain I., Al-Shijbi Y., Mohamed A.M.E., 2023. Characterization of Seismic Source Zones in the Gulf of Aden Region. Pure and Applied Geophysics 180, 91–110 https://doi.org/10.1007/s00024-022-03219-1.
11. DeMets C., Iaffaldano G., Merkouriev S., 2015. High-Resolution Neogene and Quaternary Estimates of Nubia-Eurasia-North America Plate Motion. Geophysical Journal International 203 (1), 416–427. https://doi.org/10.1093/gji/ggv277.
12. De Rubeis V., Dimitriu P., Papadimitriou E., Tosi P., 1993. Recurrent Patterns in the Spatial Behaviour of Italian Seismicity Revealed by the Fractal Approach. Geophysical Research Letters 20 (18), 1911–1914. https://doi.org/10.1029/93GL01889.
13. El Alami S.O., Tadili B.A., Cherkaoui T.E., Medina F., Ramdani M., Brahim L.A., Harnafi M., 1998. The Al Hoceima Earthquake of May 26, 1994 and Its Aftershocks: A Seismotectonic Study. Annals of Geophysics 41 (4). https://doi.org/10.4401/ag-3801.
14. Ercilla G., Vázquez J.-T., Alonso B., Bárcenas P., Casas D., d’Acremont E., Estrada F., Fernández-Salas L.M. et al., 2021. Seafloor Morphology and Processes in the Alboran Sea. In: J.C. Báez, J.T. Vázquez, J.A. Camiñas, M. Malouli Idrissi (Eds), Alboran Sea – Ecosystems and Marine Resources. Springer, Cham, p. 157–205. https://doi.org/10.1007/978-3-030-65516-7_6.
15. Gràcia E., Grevemeyer I., Bartolomé R., Perea H., Martínez-Loriente S., Gómez de la Peña L., Villaseñor A., Klinger Y. et al., 2019. Earthquake Crisis Unveils the Growth of an Incipient Continental Fault System. Nature Communications 10 (1), 3482. https://doi.org/10.1038/s41467-019-11064-5.
16. Grob M., van der Baan M., 2011. Statistical Analysis of Microseismic Event Locations and Magnitudes, and Their Geomechanical Implications. SEG Technical Program Expanded Abstracts 30 (1), 4424. https://doi.org/10.1190/1.3627502.
17. Gutenberg B., Richter C.F., 1944. Frequency of Earthquakes in California. Bulletin of the Seismological Society of America 34 (4), 185–188. https://doi.org/10.1785/bssa0340040185.
18. Gutscher M.-A., Malod J., Rehault J.-P., Contrucci I., Klingelhoefer F., Mendes-Victor L., Spakman W., 2002. Evidence for Active Subduction Beneath Gibraltar. Geology 30 (12), 1071–1074. https://doi.org/10.1130/0091-7613(2002)030<1071:EFASBG>2.0.CO;2.
19. Hainzl S., 2003. Self-Organization of Earthquake Swarms. Journal of Geodynamics 35 (1–2), 157–172. https://doi.org/10.1016/S0264-3707(02)00060-1.
20. Hamdache M., Peláez J.A., Gospodinov D., Henares J., Galindo-Zaldívar J., Sanz de Galdeano C., Ranguelov B., 2022. Stochastic Modeling of the Al Hoceima (Morocco) Aftershock Sequences of 1994, 2004 and 2016. Applied Sciences 12 (17), 8744. https://doi.org/10.3390/app12178744.
21. Hanks T.C., Kanamori H., 1979. A Moment Magnitude Scale. Journal of Geophysical Research: Solid Earth 84 (B5), 2348–2350. https://doi.org/10.1029/JB084iB05p02348.
22. Hayashi Y., Morita Y., 2003. An Image of a Magma Intrusion Process Inferred from Precise Hypocentral Migrations of the Earthquake Swarm East of the Izu Peninsula. Geophysical Journal International 153 (1), 159–174. https://doi.org/10.1046/j.1365-246X.2003.01892.x.
23. Jolivet L., Augier R., Faccenna C., Negro F., Rimmele G., Agard P., Robin C., Rossetti F., Crespo-Blanc A., 2008. Subduction, Convergence and the Mode of Backarc Extension in the Mediterranean Region. Bulletin de La Societe Geologique de France 179 (6), 525–550. https://doi.org/10.2113/gssgfbull.179.6.525.
24. Lonergan L., White N., 1997. Origin of the Betic-Rif Mountain Belt. Tectonics 16 (3), 504–522. https://doi.org/10.1029/96TC03937.
25. Lopes A.E.V., Assumpção M., Do Nascimento A.F., Ferreira J.M., Menezes E.A.S., Barbosa J.R., 2010. Intraplate Earthquake Swarm in Belo Jardim, NE Brazil: Reactivation of a Major Neoproterozoic Shear Zone (Pernambuco Lineament). Geophysical Journal International 180 (3), 1303–1312. https://doi.org/10.1111/j.1365-246X.2009.04485.x.
26. López-Sánchez C., Buforn E., Cesca S., Lozano L., Sanz de Galdeano C., Mattesini M., Udías A., Cantavella J.V., 2022. Intermediate-Depth Earthquakes in Southern Spain and Alboran Sea. Tectonophysics 825, 229238. https://doi.org/10.1016/j.tecto.2022.229238.
27. Lozano L., Cantavella J.V., Gaite B., Ruiz-Barajas S., Antón R., Barco J., 2022. Seismic Analysis of the 2020–2021 Santa Fe Seismic Sequence in the Granada Basin, Spain: Relocations and Focal Mechanisms. Seismological Research Letters 93 (6). https://doi.org/10.1785/0220220097.
28. Madarieta-Txurruka A., González-Castillo L., Peláez J.A., Catalán M., Henares J., Gil A.J., Lamas-Fernández F., Galindo-Zaldívar J., 2022. The Role of Faults as Barriers in Confined Seismic Sequences: 2021 Seismicity in the Granada Basin (Betic Cordillera). Tectonics 41 (9), e2022TC007481. https://doi.org/10.1029/2022TC007481.
29. Mandelbrot B.B., 1989. Multifractal Measures, Especially for the Geophysicist. Pure and Applied Geophysics 131, 5–42. https://doi.org/10.1007/BF00874478.
30. Medina F., 2015. Coulomb Stress Perturbations Related to the Al Hoceima (Morocco) Earthquakes of 1994 and 2004. Open Journal of Earthquake Research 4 (1), 37–54. https://doi.org/10.4236/ojer.2015.41004.
31. Medina F., Cherkaoui T.-E., 2017. The South-Western Alboran Earthquake Sequence of January-March 2016 and Its Associated Coulomb Stress Changes. Open Journal of Earthquake Research 6 (1), 35–54. https://doi.org/10.4236/ojer.2017.61002.
32. Morales J., Serrano I., Vidai F., Torcal F., 1997. The Depth of the Earthquake Activity in the Central Betics (Southern Spain). Geophysical Research Letters 24 (24), 3289–3292. https://doi.org/10.1029/97GL03306.
33. Peláez J.A., Chourak M., Tadili B.A., Aït Brahim L., Hamdache M., López Casado C., Martínez Solares J.M., 2007. A Catalog of Main Moroccan Earthquakes from 1045 to 2005. Seismological Research Letters 78 (6), 614–621. https://doi.org/10.1785/gssrl.78.6.614.
34. Peláez J.A., Hamdache M., Henares J., 2015. The 2012–2013 Seismic Swarm in the Eastern Guadalquivir Basin (S Spain). Procedia Earth and Planetary Science 15, 66–72. https://doi.org/10.1016/j.proeps.2015.08.018.
35. Royden L.H., 1993. Evolution of Retreating Subduction Boundaries Formed During Continental Collision. Tectonics 12 (3), 629–638. https://doi.org/10.1029/92TC02641.
36. Santos-Bueno N., Fernández-García C., Stich D., Mancilla F.d.L., Martín R., Molina-Aguilera A., Morales J., 2019. Focal Mechanisms for Subcrustal Earthquakes Beneath the Gibraltar Arc. Geophysical Research Letters 46 (5), 2534–2543. https://doi.org/10.1029/2018GL081587.
37. Schorlemmer D., Wiemer S., Wyss M., 2005. Variations in Earthquake-Size Distribution Across Different Stress Regimes. Nature 437, 539–542. https://doi.org/10.1038/nature04094.
38. Sharon M., Sagy A., Kurzon I., Marco S., Rosensaft M., 2020. Assessment of Seismic Sources and Capable Faults Through Hierarchic Tectonic Criteria: Implications for Seismic Hazard in the Levant. Natural Hazards and Earth System Sciences 20 (1), 125–148. https://doi.org/10.5194/nhess-20-125-2020.
39. Shi Y., Bolt B.A., 1982. The Standard Error of the Magnitude-Frequency b Value. Bulletin of the Seismological Society of America 72 (5), 1677–1687. https://doi.org/10.1785/bssa0720051677.
40. Shimamoto T., 1993. The Mechanics of Earthquakes and Faulting. Journal of Structural Geology 15 (6), 810–811. https://doi.org/10.1016/0191-8141(93)90067-k.
41. Spakman W., Wortel R., 2004. A Tomographic View on Western Mediterranean Geodynamics. In: W. Cavazza, F. Roure, W. Spakman, G.M. Stampfli, P.A. Ziegler (Eds), The TRANSMED Atlas. The Mediterranean Region from Crust to Mantle. Springer, Berlin, Heidelberg, p. 31–52. https://doi.org/10.1007/978-3-642-18919-7_2.
42. Stich D., Martín R., Morales J., López-Comino J.Á., Mancilla F.d.L., 2020. Slip Partitioning in the 2016 Alboran Sea Earthquake Sequence (Western Mediterranean). Frontiers in Earth Science 8, 587356. https://doi.org/10.3389/feart.2020.587356.
43. Sykes L.R., 1970. Earthquake Swarms and Sea-Floor Spreading. Journal of Geophysical Research 75 (32), 6598–6611. https://doi.org/10.1029/jb075i032p06598.
44. Telesca L., Rouai M., Cherkaoui T.E., 2009. Time-Clustering Behavior in the Sequence of the Aftershocks of the Al-Hoceima (Morocco) 24 February 2004 Earthquake. Natural Hazards and Earth System Science 9 (6), 2063–2066. https://doi.org/10.5194/nhess-9-2063-2009.
45. Tryggvason E., 1973. Seismicity, Earthquake Swarms, and Plate Boundaries in the Iceland Region. Bulletin of the Seismological Society of America 63 (4), 1327–1348. DOI:10.1785/BSSA0630041327.
46. Vergés J., Fernàndez M., 2012. Tethys-Atlantic Interaction Along the Iberia-Africa Plate Boundary: The Betic-Rif Orogenic System. Tectonophysics 579, 144–172. https://doi.org/10.1016/j.tecto.2012.08.032.
47. Wiemer S., 2001. A Software Package to Analyze Seismicity: ZMAP. Seismological Research Letters 72 (3), 373–382. https://doi.org/10.1785/gssrl.72.3.373.
Meknès 50000, Morocco
Meknès 50000, Morocco
Meknès 50000, Morocco
Meknès 50000, Morocco
Bouhali K., Rouai M., Dekayir A., Essaied A. THE SOUTH ALBORAN BASIN SEISMIC SWARM IN 2020-2021 AND ITS POSSIBLE RELATION TO THE SOUTHERN DEVELOPMENT OF THE AL-IDRISSI FAULT SYSTEM. Geodynamics & Tectonophysics. 2025;16(1):0804. https://doi.org/10.5800/GT-2025-16-1-0804. EDN: yrhysl


Editor-in-Chief
Sklyarov E.V.664033, Irkutsk, Lermontova St., 128,
IEC SB RAS Institute of the Earth's crust
E-mail.: gt@crust.irk.ru
tel.: 8 3952 425422
Processing of personal data


