


Contents
Scroll to:
https://doi.org/10.5800/GT-2025-16-1-0812
EDN: dkqfqo
Scroll to:
The study deals with the analysis of the evolution of seismicity and inner crustal movements in Taiwan over the past 10 years. The primary data sources included time series generated from permanent GPS observations, the earthquake catalog, and the location of the main tectonic structures. Horizontal displacement vectors of GPS stations were determined for each day, relative to the initial epoch. An inner reference system was used in the absence of general area motion defined in the global coordinate system. An animation video was made for synoptic analysis of the evolution of internally generated seismic and tectonic motions. It is shown that the majority of strong M≥6 earthquakes occurred within the boundaries of the inner crustal movement deficit zones or thereon. This allows us to consider such highstrength crustal areas as prognostic signs of earthquakes. They are revealed by GPS observations over several years and destroyed by strong seismic events, as well as by large groups of moderate and weak earthquakes. By 2024, on the island there was formed an east-to-west elongated high-strength zone. It connects the place of convergence of the Ryukyu and Manila trenches with the insular land. It can be assumed that this area marks a zone of high seismic-generating stresses, which is important to take into account in further assessment of seismic hazard.
Kaftan V.I., Melnikov A.Yu., Dokukin P.A. EVOLUTION OF INNER CRUSTAL DISPLACEMENT DEFICIT ACCORDING TO THE GPS DATA IN CONNECTION WITH SEISMICITY IN THE PERIOD OF 2014–2024 AND THE MW=7.4 HUALIEN EARTHQUAKE, TAIWAN. Geodynamics & Tectonophysics. 2025;16(1):0812. https://doi.org/10.5800/GT-2025-16-1-0812. EDN: dkqfqo
The Island of Taiwan is located in the area of complex tectonic setting where the Eurasian and the Philippine global tectonic plates interact with each other. It marks the collision zone of the wedge-shaped protrusion of the Philippine Plate, with its northern edge submerging under the Eurasian Plate and its western edge simultaneously creeping thereon. This serves as a mountain building mechanism therein and as a mechanism of size enlargement of the island as a whole [Malavieille et al., 2019; Sun et al., 2015]. The rate of convergence of the Philippine and Eurasian plates in this area is rather high: reaching ~7–9 cm per year [Yu et al., 1997; Sella et al., 2002].
The highest seismic activity in the region is characteristic of the subduction zone of the Philippine Plate, formed by the Ryukyu Trench and the underwater tectonic landforms next to it. A 8.0-magnitude underwater mega-earthquake occurred there in 1920. On land, the highest seismic activity occurs in the Longitudinal Valley Fault Zone running parallel to the eastern coast of the island. It was precisely the area of junction between the Ryukyu Trench and the northern end of the Longitudinal Valley near the City of Hualien that experienced a MW=7.4 earthquake – one of the most destructive earthquakes in recent decades – in April 2024. This event claimed more than a thousand lives. The analysis of the 2024 Hualien earthquake consequences in terms of damage to buildings and engineering structures, socio-economic consequences and sustainable development strategies is presented in [Kanwal, 2024]. The scale of landslide processes caused by this strongest event is considered in [Chang et al., 2024]. Coseismic movements and crustal deformations induced by the 2024 Hualien earthquake are considered in [Tang et al., 2024].
Today it is believed that the lack of displacement on either side of a seismogenic tectonic fault (slip deficit) indicates the accumulation of elastic stresses, the release of which leads to an earthquake. GPS monitoring of active faults is sometimes not detailed or thorough enough due to the insufficient density of observation stations. But it allows us to identify some of the least mobile areas well in advance of a seismic event, usually in its future epicenter. These are areas the inner crustal displacement deficit [Gvishiani et al., 2020].
This is an insufficiency (small value) of the module of the earth’s surface displacement vector, determined in the internal reference system [Kaftan, Tatarinov, 2021]. Its critical (minimum) value is usually close to the accuracy of determination (coordinate difference) of displacements ~1 cm. The internal reference system for displacements is a reference system which excludes any external movement. The vectors of internal displacements are determined in relation to the center of their statistical distribution. This reveals the mutual movements that contribute to the occurrence of seismogenic stresses and destruction.
Such areas were retrospectively identified many times in connection with strong earthquakes in different regions of the world. For example, in the case of the Ridgecrest earthquake, California, USA (2019, M7.1) [Kaftan, 2021а], such a low-mobility zone covered an area stretching along the contact boundary between the Pacific and North American plates. Prior to the Kumamoto earthquake, Japan (2016, M7.3) [Kaftan et al., 2022], and Van earthquake, Turkey (2011, M7.2) [Kaftan et al., 2021], there were found quasi-circular areas of minimum horizontal displacements. Several strong New Zealand earthquakes of 2010–2016 occurred in concentrated minimum displacement zones and adjacent areas [Kaftan et al., 2024a]. Before the devastating M7.5–7.8 Karamanmaraş earthquakes of 2023, Turkey, the area of displacement deficit covered the epicentral zones of the main shocks and aftershocks [Dokukin et al., 2023a].
These results, along with the aforementioned catastrophic seismic event of 2024, served as a reason for the study of the evolution of the inner crustal displacement deficit region in in the Island of Taiwan, as a continuation of the general study cycle based on the science of how the displacement deficit is related to strong earthquakes.
The objectives of this study were the GPS data acquisition and preparation, estimating and plotting the distribution of the accumulated inner crustal displacements in Taiwan, visualizing the kinematics of the seismic deformation process, and studying the spatiotemporal coordination between the crustal movements and seismicity.
The main objective of the study was to assess the possibility of predicting the places for future strong seismic events based on the long-term GPS observation results.
There was performed a time series analysis of coordinates of permanent GPS stations obtained from the web resource of the Nevada Geodetic Laboratory (http://geodesy.unr.edu/index.php). This involved the final mathematical processing results which provide subcentimeter accuracy of coordinate determination from daily observations. Use has been made of GIPSY OASIS II software from the Jet Propulsion Laboratory (JPL). The data processing strategy lies in the use of Precise Point Positioning (PPP) as a processing mode with JPL precise satellite ephemerides, clock corrections, and other characteristics [Blewit et al., 2018].
For the purposes of deformation analysis, there was deployed a network of GPS stations presented in Fig. 1 and 2. The total number of selected stations was 96. Fig. 1, 2 also show the main tectonic structures and epicenters of the strongest earthquakes that occurred from 2014 to 2024.
The analysis used the data on tectonic faults obtained from the website (https://blogs.openquake.org/hazard/global-active-fault-viewer/) and publications [Galgana et al., 2007; Lemenkova, 2021; Malavieille et al., 2019].
The M>2.5 earthquake catalog was obtained from the National Earthquake Information Center (NEIC) website (https://earthquake.usgs.gov/earthquakes/search/).
The strongest seismic events during the study period are presented in Table 1.
According to statistics, 3927 earthquakes with M>6 occurred on Earth from 1992 to 2013. This averaged 178.5 earthquakes per year [Poygina et al., 2020]. For about a decade, the Taiwan region experienced 19 strong M>6.0 earthquakes (measured qualitatively on Richter scale) and 173 moderate seismic events including destructive ones. This indicates a high level of seismic activity therein. A similar situation took place in New Zealand from 2010 to 2016, when there occurred 11 strong earthquakes with M>6 [Kaftan et al., 2024a].
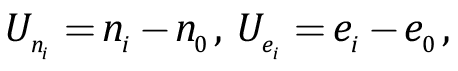
To identify places of minimal displacements, we calculated the horizontal displacements Un and Ue of GPS stations as the difference between the horizontal coordinates n and e in the Universal Transvers Mercator – UTM cartographic projection – for each observation date relative to the initial epoch T0:
 (1)
(1)
where index i denotes the current measurement epoch. In this way we obtain the station displacements in the standard global coordinate reference system ITRF14. These displacements demonstrate mainly the movements of global tectonic plates. This makes it difficult to assess the movements associated with local deformation sources. To reduce this effect, it is useful to represent the displacements in a local (internal) coordinate reference system. Seismic rupture and accumulation of elastic energy in the earthquake source are caused by local processes, so it would be reasonable to disregard the unidirectional global movements of the studied area.
Geodetic studies to obtain inner coordinate reference systems, uninfluenced by external factors, are presented in [Grafarend, Schaffrin, 1974; Welsch, 1979].
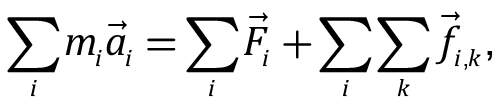
The total number of GPS sites of the local control network is represented by a mechanical system. According to the theorem of classical mechanics concerning the motion of the center of mass (inertia), the acceleration of the center of inertia does not depend on internal force interactions. The acceleration a of a set of material points n of a mechanical system is represented by the formula:
 (2)
(2)
where mi – mass of a material point,  – vector of an external force,
  – vector of force of internal pairwise point interaction, i, k – current point indexes.
The vectors of external forces therewith are applied to the center of inertia of the mechanical system. The general motion of the mechanical system in the coordinate reference system is determined by the sum of external forces and does not depend on the forces of internal interaction of the elements of the mechanical system. By Newton’s third law, the sum of the internal interaction forces (the second term of formula (2)) is equal to zero. Consequently, the sum of the mutual velocities of all pairs of material points of the system is also zero. This condition is met by the average of all motion velocity vectors in the global coordinate reference system after subtructing the vector of general motion of the mechanical system.
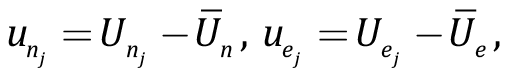
In our case, inner displacements (movements) can easily be obtained by subtracting the average value Ū from each displacement Uj defined in the global reference system. Thus, we obtain a reference frame for inner displacements (or displacement rates) according to the no net rotation/translation principle.
 (3)
(3)
where index j is the ordinal number of the GPS site.
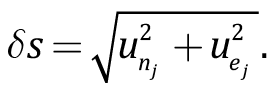
This approach allows us to detect more or less mobile sections of the earth’s crust which we associate with places of low or high strength within the study area. This is done through analyzing the distribution of the modulus of the inner displacement vector (3):
 (4)
(4)
These characteristics were calculated based on the accumulated displacements for each station at each moment of recording. When the GPS station temporarily stopped recording for technical reasons, the displacement values for these intervals were obtained using Hermite spline interpolation. These values served as a basis for the digital and then for the graphical modeling of spatial distribution of displacements.
Let us try to quantify the proposed characteristic. Note that it is an analogue of the already well-known concept of slip deficit and/or slow fault slip in seismotectonics. This characteristic can be responsible for the behavior of a certain fault only if it is sufficiently covered by the GPS observation network. In most cases, nationally standardized network permanent GPS stations are spaced approximately 8–10 km or more apart. Therefore, our characteristic does not provide a thorough control over the behavior of a certain fault, but describes a small (insufficient in relation to the average) level of movement in a large area of the observation network coverage.
We base our assessment on the accuracy of continuous GPS-based positioning. The manufacturers of geodetic GPS receivers claim that the standard error measurement is σ=3+Da, where a is the coefficient of accuracy decreasing with the increase in distance D. At a distance of approximately 8–10 km from each other, a plausible estimate would be σ=mn,e=~5 mm. Note that the accuracy of satellite measurements does not remain constant due to the influence of many external factors. According to the Gaussian error theory, the standard error of measurement difference for each coordinate would be 7 mm.
The final characteristic (4) is based on the formula for the standard two-measurement function error:
 (5)
(5)
Partial derivatives of function (4) with respect to each of the arguments
represent cosA and sinA, where A is the azimuth of the horizontal displacement vector, respectively.
Assuming equal performance of determination of displacement in each coordinate, the final formula for the standard error takes the form  , yielding 𝑚𝛿𝑆=10 mm.
To ensure that a random error falls within a given interval with a probability of 99.73 %, there was applied the three sigma rule, as a result of which the interval δS<30 mm was obtaied for the minimum modulus of the vector (deficit) of displacements.
This estimate was made for single coordinate difference and is conditional. Taking into account higher movement rates, the accumulated displacement deficit will be comprised of larger values close to each other.
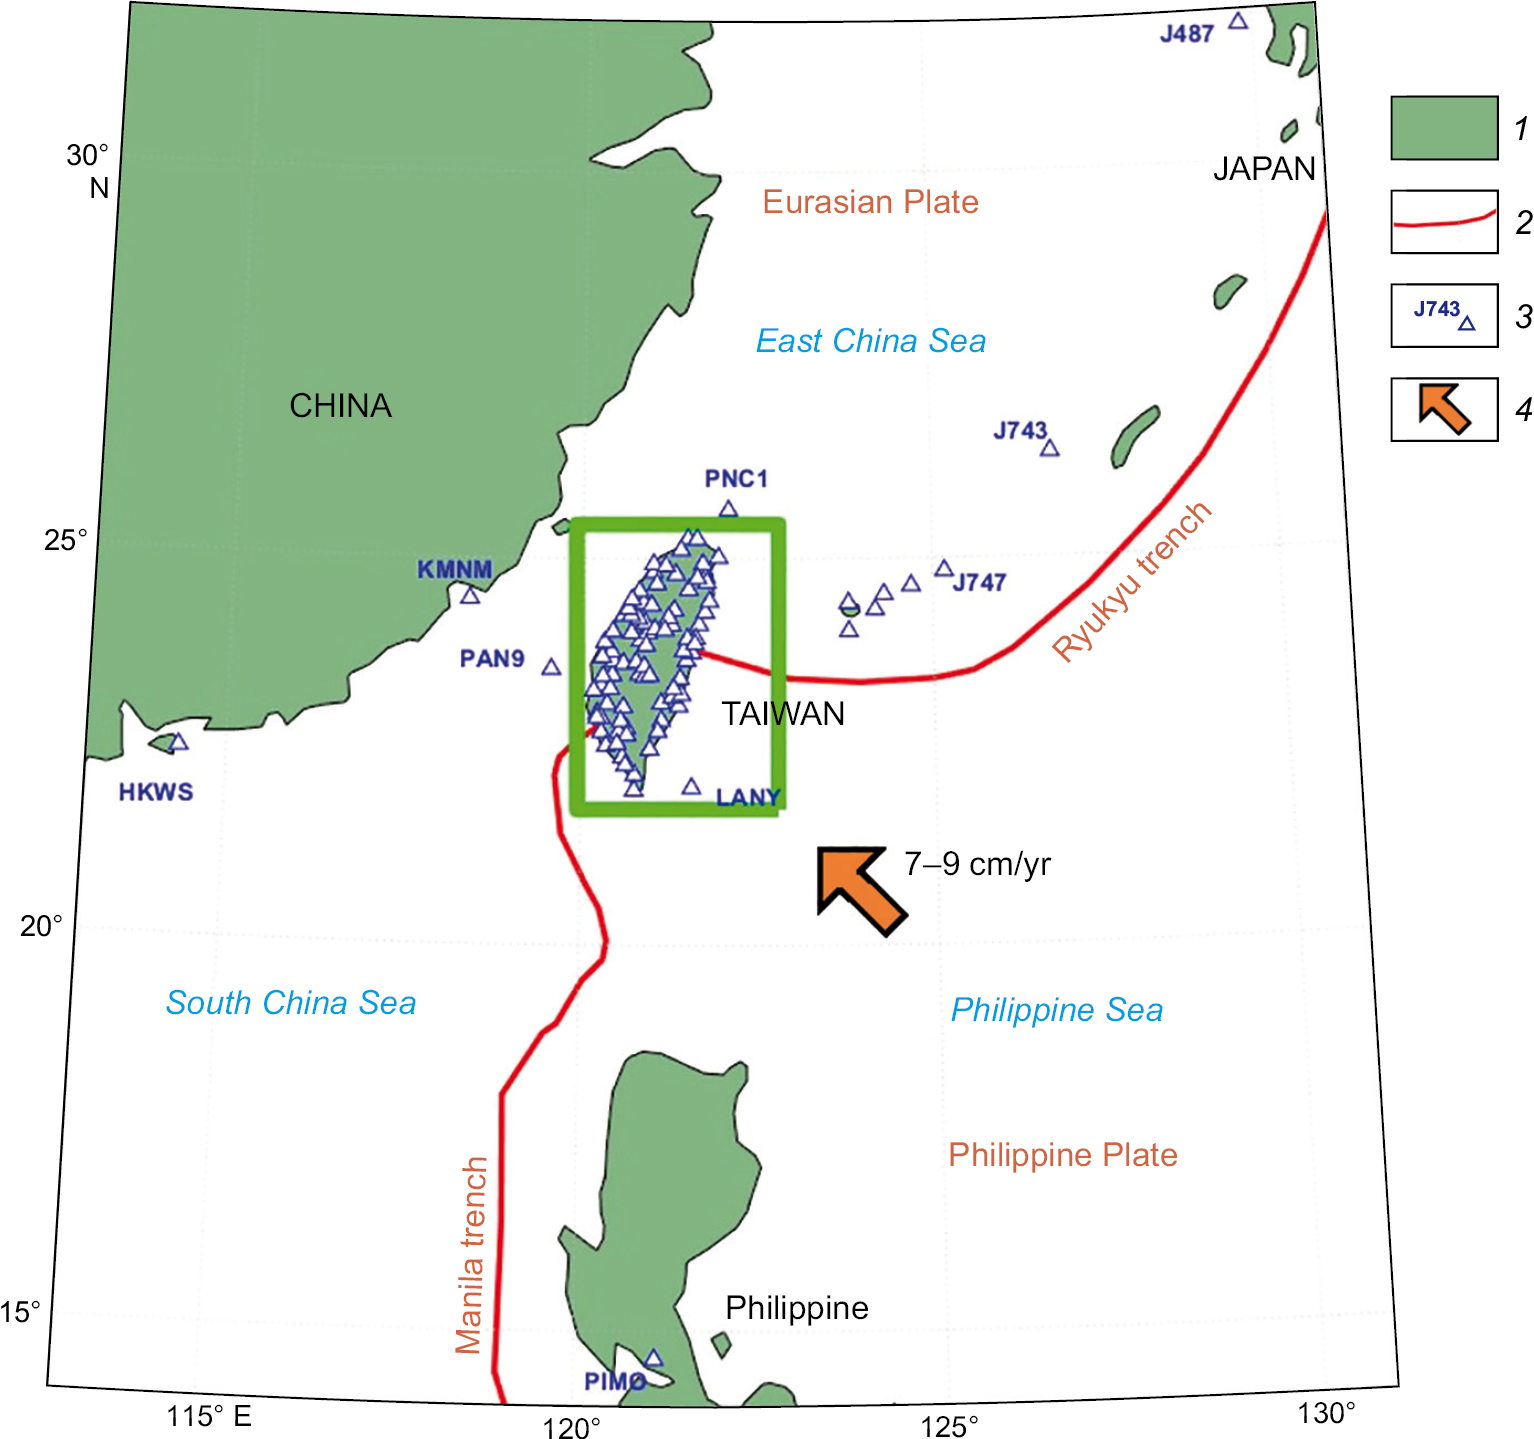
Fig. 1. Territorial location of the study region, GPS network and main tectonic elements (after [Galgana et al., 2007; Lemenkova, 2021]).
1 – onland area; 2 – deep-sea trenches; 3 – GPS stations; 4 – direction of movement of the Philippine plate. The green rectangle highlights the main GPS network, shown in Fig. 2.
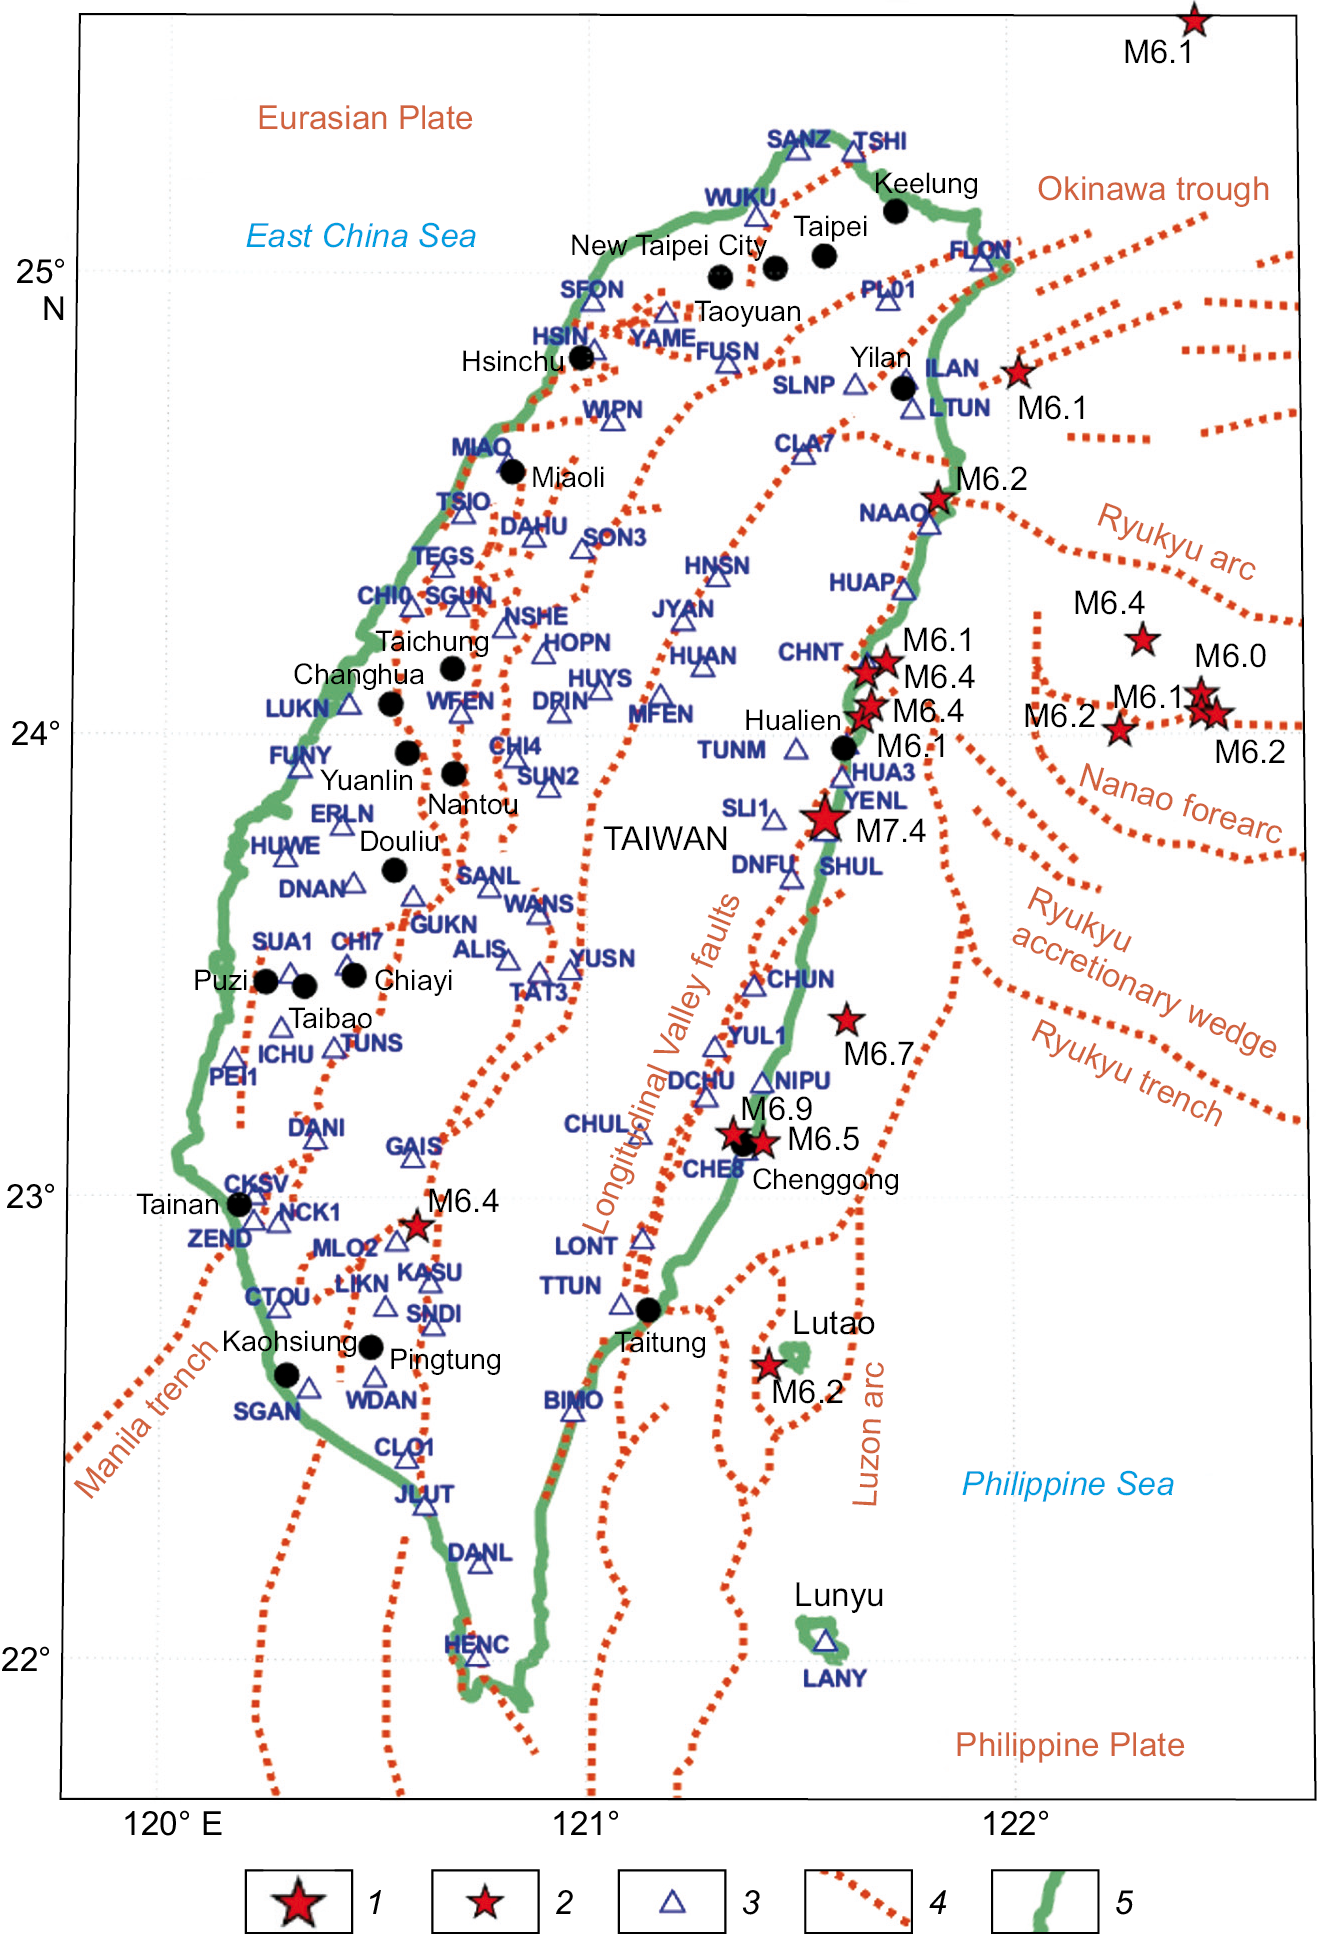
Fig. 2. GPS network on the insular territory, main tectonic dislocations, strong earthquakes with magnitudes: 1 – M≥7; 2 – 7>M≥6; 3 – GPS stations; 4 – tectonic dislocations; 5 – coastline.
Table 1. Strongest earthquakes (М>6) of the study area from 2014 to 2024
No | Date, time | City/Place | Latitude, degree | Longitude, degree | Depth, m | Magnitude |
1 | 2014-12-10 21:03:39.260 | 77 km NE of Jiufen | 25.5403 | 122.4503 | 256 | 6.1 |
2 | 2015-02-13 20:06:32.330 | Philippine Sea | 22.6374 | 121.427 | 30 | 6.2 |
3 | 2015-04-20 01:42:58.380 | Yilan | 24.2026 | 122.3158 | 29 | 6.4 |
4 | 2015-04-20 12:00:00.070 | Philippine Sea | 24.0851 | 122.453 | 29 | 6.0 |
5 | 2015-04-20 11:45:13.440 | Philippine Sea | 24.0471 | 122.4532 | 29 | 6.1 |
6 | 2016-02-05 19:57:27.380 | Tainan, Kaohsiung | 22.9375 | 120.6014 | 23 | 6.4 |
7 | 2016-05-31 05:23:47.310 | Philippine Sea | 25.5615 | 122.5458 | 246.4 | 6.4 |
8 | 2018-02-04 13:56:41.950 | Hualien | 24.1572 | 121.7078 | 12 | 6.1 |
9 | 2018-02-06 15:50:43.320 | Hualien | 24.1338 | 121.6586 | 17 | 6.4 |
10 | 2019-04-18 05:01:06.493 | Hualien | 24.0374 | 121.6501 | 20 | 6.1 |
11 | 2020-12-10 13:19:58.682 | Philippine Sea | 24.7818 | 122.0243 | 71 | 6.1 |
12 | 2021-10-24 05:11:34.230 | Yilan | 24.5108 | 121.8314 | 69 | 6.2 |
13 | 2022-01-03 09:46:35.767 | Hualien/Philippine Sea | 24.0079 | 122.2592 | 19 | 6.2 |
14 | 2022-03-22 17:41:38.584 | Taitung | 23.3839 | 121.6118 | 24 | 6.7 |
15 | 2022-05-09 06:23:02.067 | Philippine Sea | 24.0406 | 122.4888 | 21 | 6.2 |
16 | 2022-09-17 13:41:17.890 | Taitung | 23.1191 | 121.4138 | 10 | 6.5 |
17 | 2022-09-18 06:44:13.846 | Taitung | 23.138 | 121.3439 | 10 | 6.9 |
18 | 2024-04-02 23:58:11.228 | Hualien | 23.819 | 121.5616 | 34.75 | 7.4 |
19 | 2024-04-03 00:11:25.327 | Hualien | 24.0639 | 121.6717 | 12.564 | 6.4 |
Using the described method, there were obtained the frames of displacement deficit fields, combined into synoptic animation. Use has been made of digital information on the spatial position of tectonic faults and epicenters of M>2.5 earthquakes.
The study of evolution of spatiotemporal changes in the movements and deformations of the earth’s crust with the use of kinematic animation models shows behaviorial similarity of meteorological and hydrological processes with the crustal processes acceleratively represented in vision. The earth’s surface experiences the occurrence of wave and vortex processes, collisions and multidirectional movements of deformation fronts, similar to changes in the atmosphere and hydrosphere and reflective of deep-seated displacements. Therefore, at the initial stages of the study, we resort to synoptic analysis, expanding it to study of the behavior of geosphere, highly dynamic despite of being solid [Kaftan, 2021b; Dokukin et al., 2023a, 2023b].
Thus was created a video animation [Kaftan et al., 2024b], allowing for a synoptic analysis of the behavior of the inner displacement deficit and seismic activity due to the location of the tectonic elements of the region. Visual observations of the accumulation of displacement vector modules show the areas of high and low strength in the earth’s crust.
The key frames of the video animation are shown in Fig. 3, 4, 5, 6, 7. They depict the state of inner displacement deficit areas before and immediately after the strongest seismic shocks. Note that the area of displacement deficit takes several years to form, depending on the inner displacement accumulation rate. It is detected in the territory covered by GPS stations. Therefore, we cannot use this characteristic to analyze earthquakes in the sea. In this regard, Fig. 3 is not representative.
In Fig. 3 we can see that the brown area covers the entire territory of the island. Nevertheless, in the vicinity of the future strong March 22, 2022 earthquake (see Fig. 6, d) is a weakened zone, continuously degrading with the occurrence of moderate and weak seismicity therein.
By 2018, the area of inner displacement/movement deficit was concentrated in the central part of the island with two offsets branching towards the cities of Hualien and Chenggong (see Fig. 4). The northern branch coincided with the epicenters of a pair (doublet) of future Hualien earthquakes (M6.1 and M6.4) of February 4 and 6, 2018. The second event of this pair destroyed the displacement deficit area that gave rise to the formation of the zone of decompation of the Earth’s crust of the Hualien region (see Fig. 4, d). More than a year later, this branch of the movement deficit continued its destruction due to another (M6.1) earthquake of April 18, 2019 in the Hualien region (see Fig. 6, b). By the end of 2020, strong events continued to migrate northwards into the Philippine Sea – into the subduction zone lying between the Ryukyu Arc and Okinawa Trough structures. Information obtained on the magnitude of inner displacements therein is not very reliable, since the associated isolines were derived through interpolation. However, they show a relatively dense zone of slow movements.
The earthquake of October 24, 2021 (M6.2) did not demonstrate decompaction of the crustal surface in the epicentral area (see Fig. 6, b). This may be due to a relatively large hypocentral depth of 69 km. The next earthquake of January 3, 2022 occurred in the subduction zone in the Philippine Sea (see Fig. 6, c, d). The earthquake of March 22, 2020 M6.7 occurred near the coast and in the transition zone from fast to slow movements of the earth’s crust (see Fig. 6, d). The lack of expansion of the zone of rapid movements is possibly due to the fact that the earthquake did not significantly affect the coast.
A pair of that time strongest earthquakes (M6.5 and M6.9) occurred at the end of the southeastern branch of the displacement deficit area (Fig. 7, a, b) on September 17–18, 2022. These events considerably damaged the consolidated Earth’s crust (Fig. 7, b) in the southern part of the Longitudinal Valley fault zone. The hypocenters located at a depth of 10 km indicated the impact of the earthquakes on the near-surface zone of the earth’s crust.
The April 2, 2024 M7.4 Hualien earthquake, the strongest and deadliest in the past decade, occurred in the northern branch of the zone of minimal inner displacements. It did not show decompation of this region near its epicenter (Fig. 7, d). Its hypocentral depth was ~40 km. This is three times deeper than the hypocenters of the previous events in 2022, which caused the most significant destruction of the displacement deficit zone. The next day, a strong M6.4 aftershock occurred approximately 30 km to the north at a depth of 13 km. This event manifested itself by changing the configuration of the inner displacement deficit zone (Fig. 7, d). It should be noted that the absence of significant manifestations on the daytime surface after a strong seismic event is typical, for example, of the November 13, 2016 M7.8 Kaikoura earthquake (New Zealand) [Kaftan et al., 2024a].
Two weeks after the strongest earthquake of April 2024, there formed a small inner displacement area which is of interest in terms of identifying the zone of accumulation of the greatest stresses and strengthening of the earth’s crust (Fig. 8). It is interesting to consider its location in connection with manifestations of seismic and tectonic processes in the region. The first thing that catches the eye is that the eastern end of this area coincides with the zone of the highest seismicity during the study period. The strongest (M7.4) event of April 2024 did not significantly disrupt this zone of small displacements, which is evident from the epicentral proximity to the boundary of the minimum displacement area.
It is interesting that the vast majority of strong and moderate seismic events are concentrated there. Tectonically, the Ryukyu Trench centerline therein is connected with the insular coastline, which should prevent the subduction of the Philippine Plate under the Eurasian Plate [Malavieille et al., 2019] in the Ryukyu Trench and contribute to the rapid increase of seismogenic stresses in that place. A similar situation occurs at the western boundary of the displacement deficit zone. In this area, the Manila Trench line is connected with the coastline of the Island of Taiwan. In contrast to the eastern boundary of minimal displacement area, the continental crust of the Eurasian tectonic plate therein subducts under the oceanic crust of the Philippine Plate [Malavieille et al., 2019] in the Manila Trench. The island territory is an obstacle to the advance of the continental plate. This should also contribute to the accumulation of seismogenic stresses there and to their subsequent release due to strong earthquakes. Apparently, the entire SW-NE extended area of inner displacement deficit marks the zone of critical crustal stresses, generated by the collision of the Philippine and Eurasian tectonic plates.

Fig. 3. Formation and destruction of the displacement deficit area due to the earthquakes of February – April 2015 (M6.2) (а, b) and February 5, 2016 (M6.0–6.4) (c, d).
1–4 – earthquake epicenters: 1 – M≥7, 2 – 7>M≥6, 3 – 6>M≥5, 4 – 5>M≥2.5; 5 – GPS points; 6 – coastline; 7–10 – lines of the fault zones (after [Styron, Pagani, 2020]): 7 – normal fault, 8 – strike-slip fault, 9 – reverse fault, reverse-slip, 10 – oceanic faults; 11 – future epicenter locations.
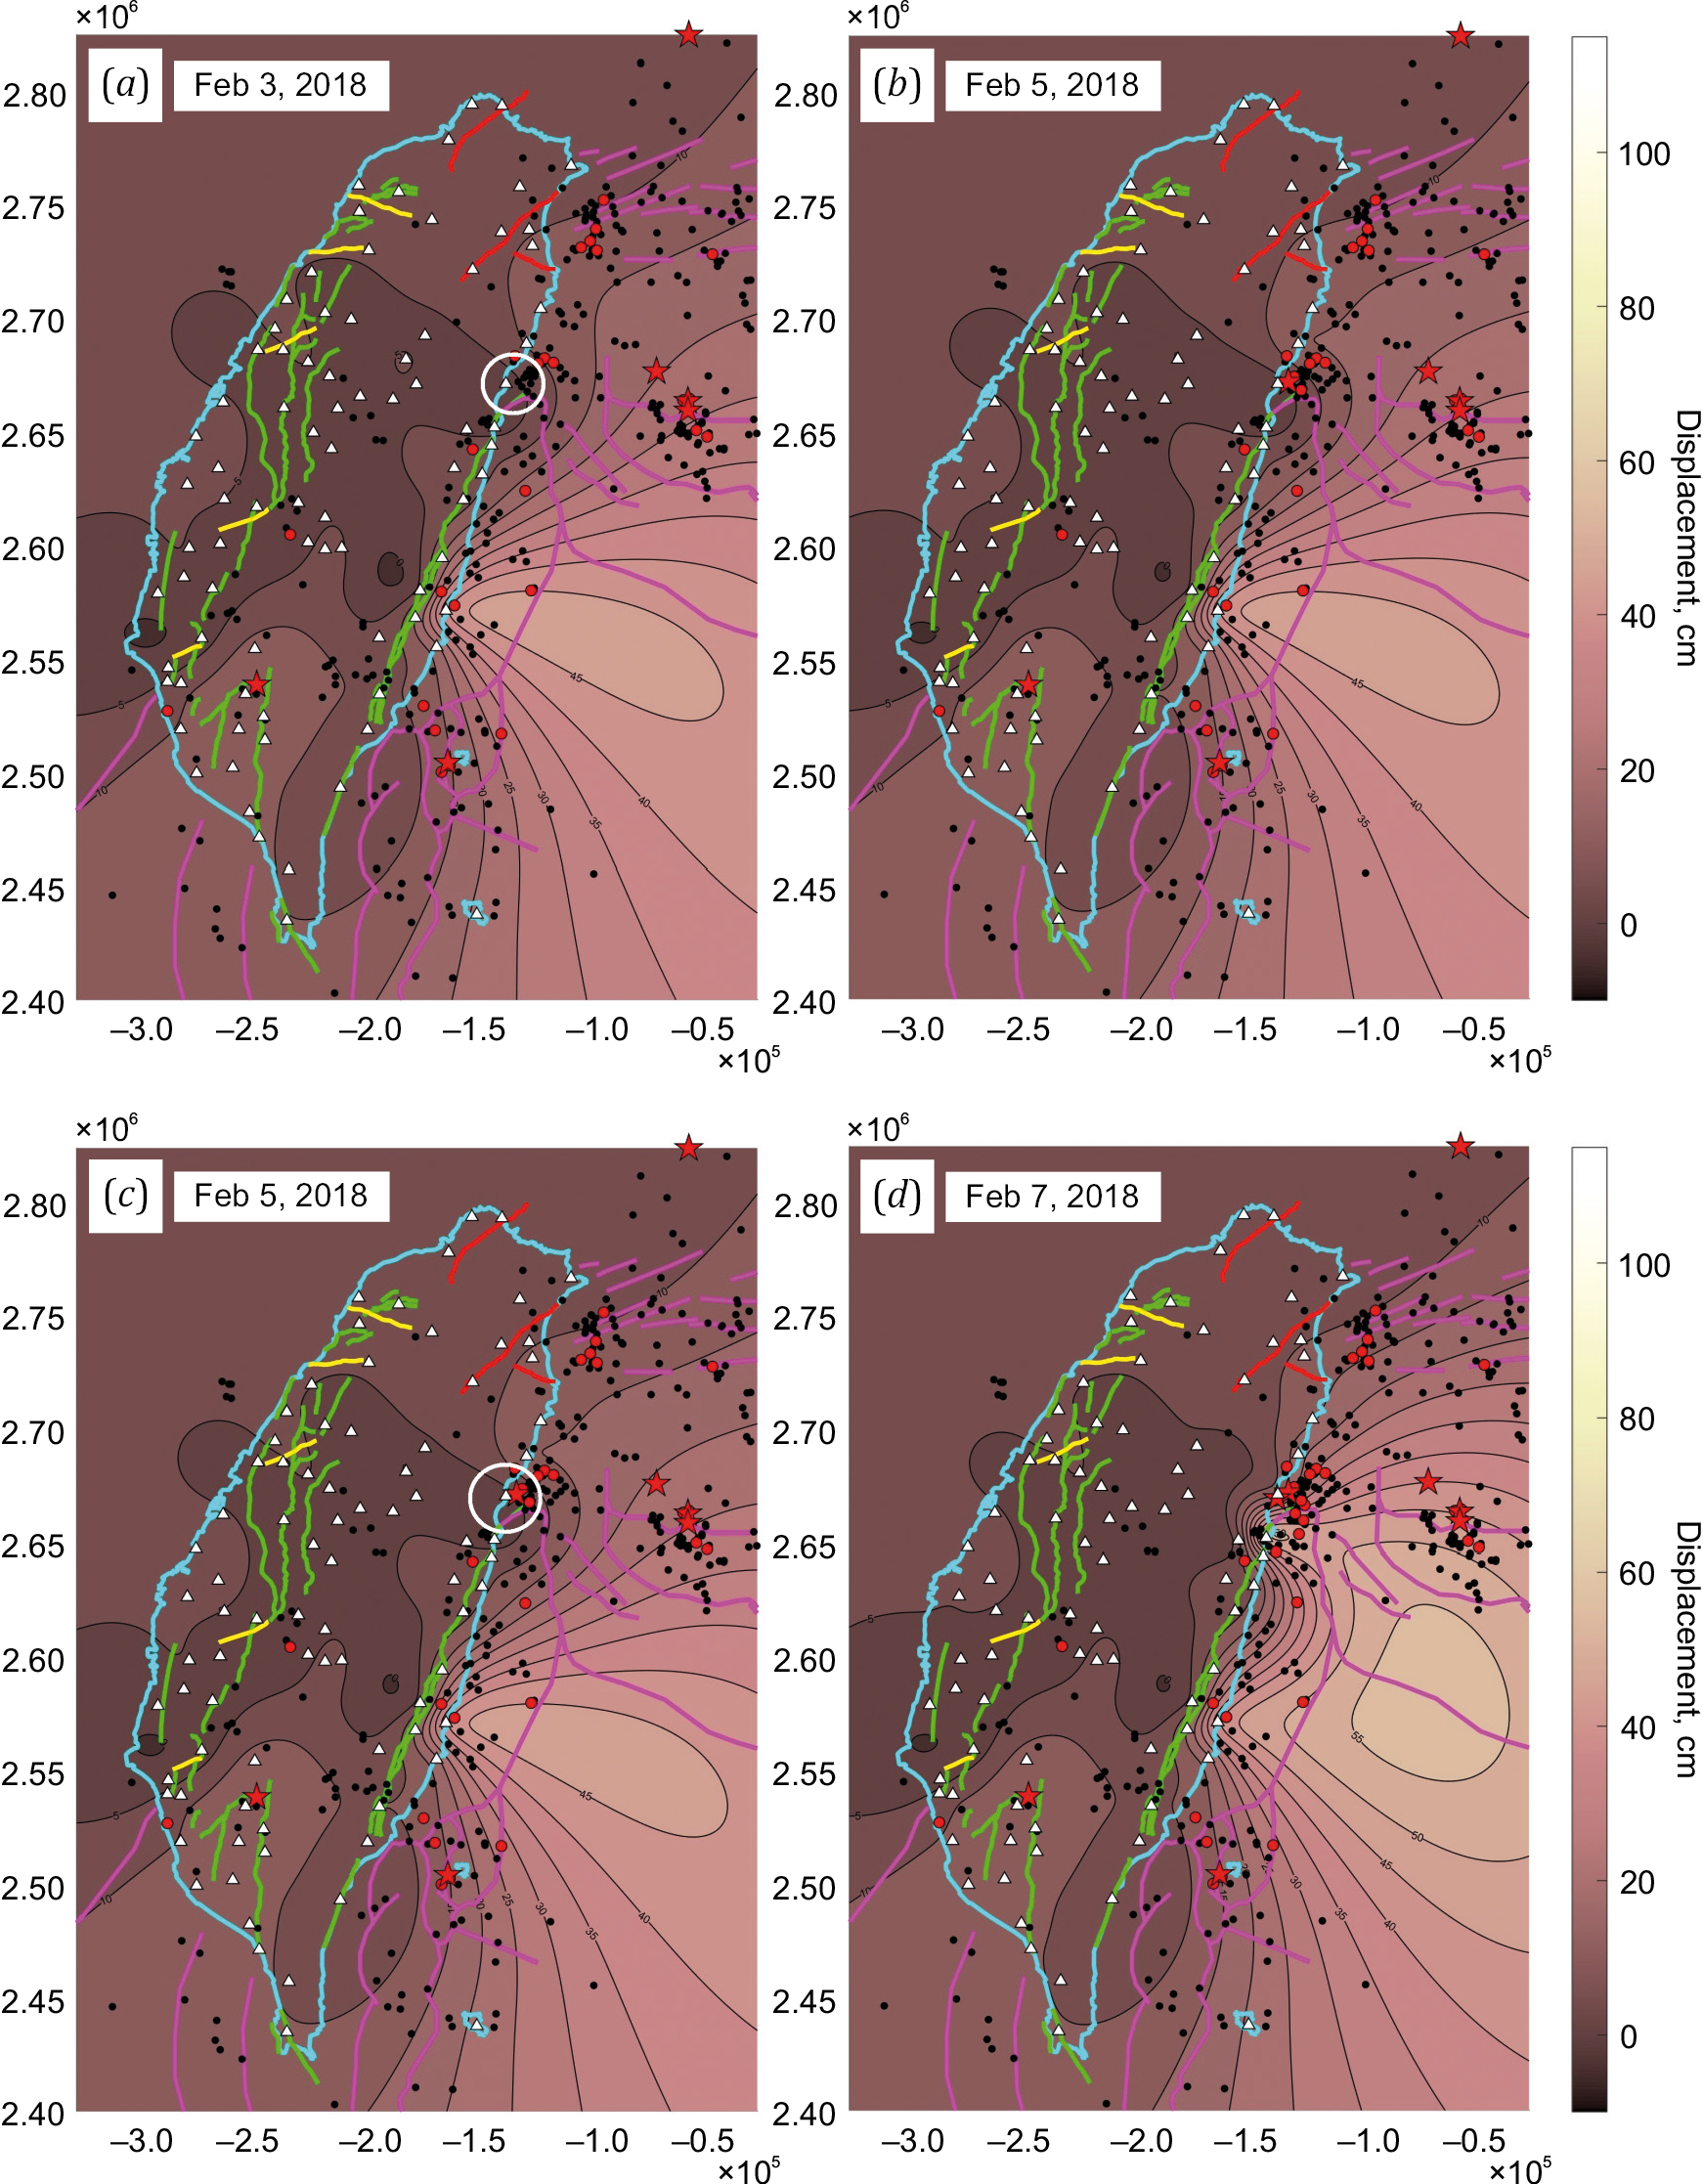
Fig. 4. Formation and destruction of the displacement deficit region in connection with the earthquakes of February 4, 2018 (M6.1) (а, b) and February 6, 2018 (M6.4) (c, d). See Fig. 3 for a common legend.
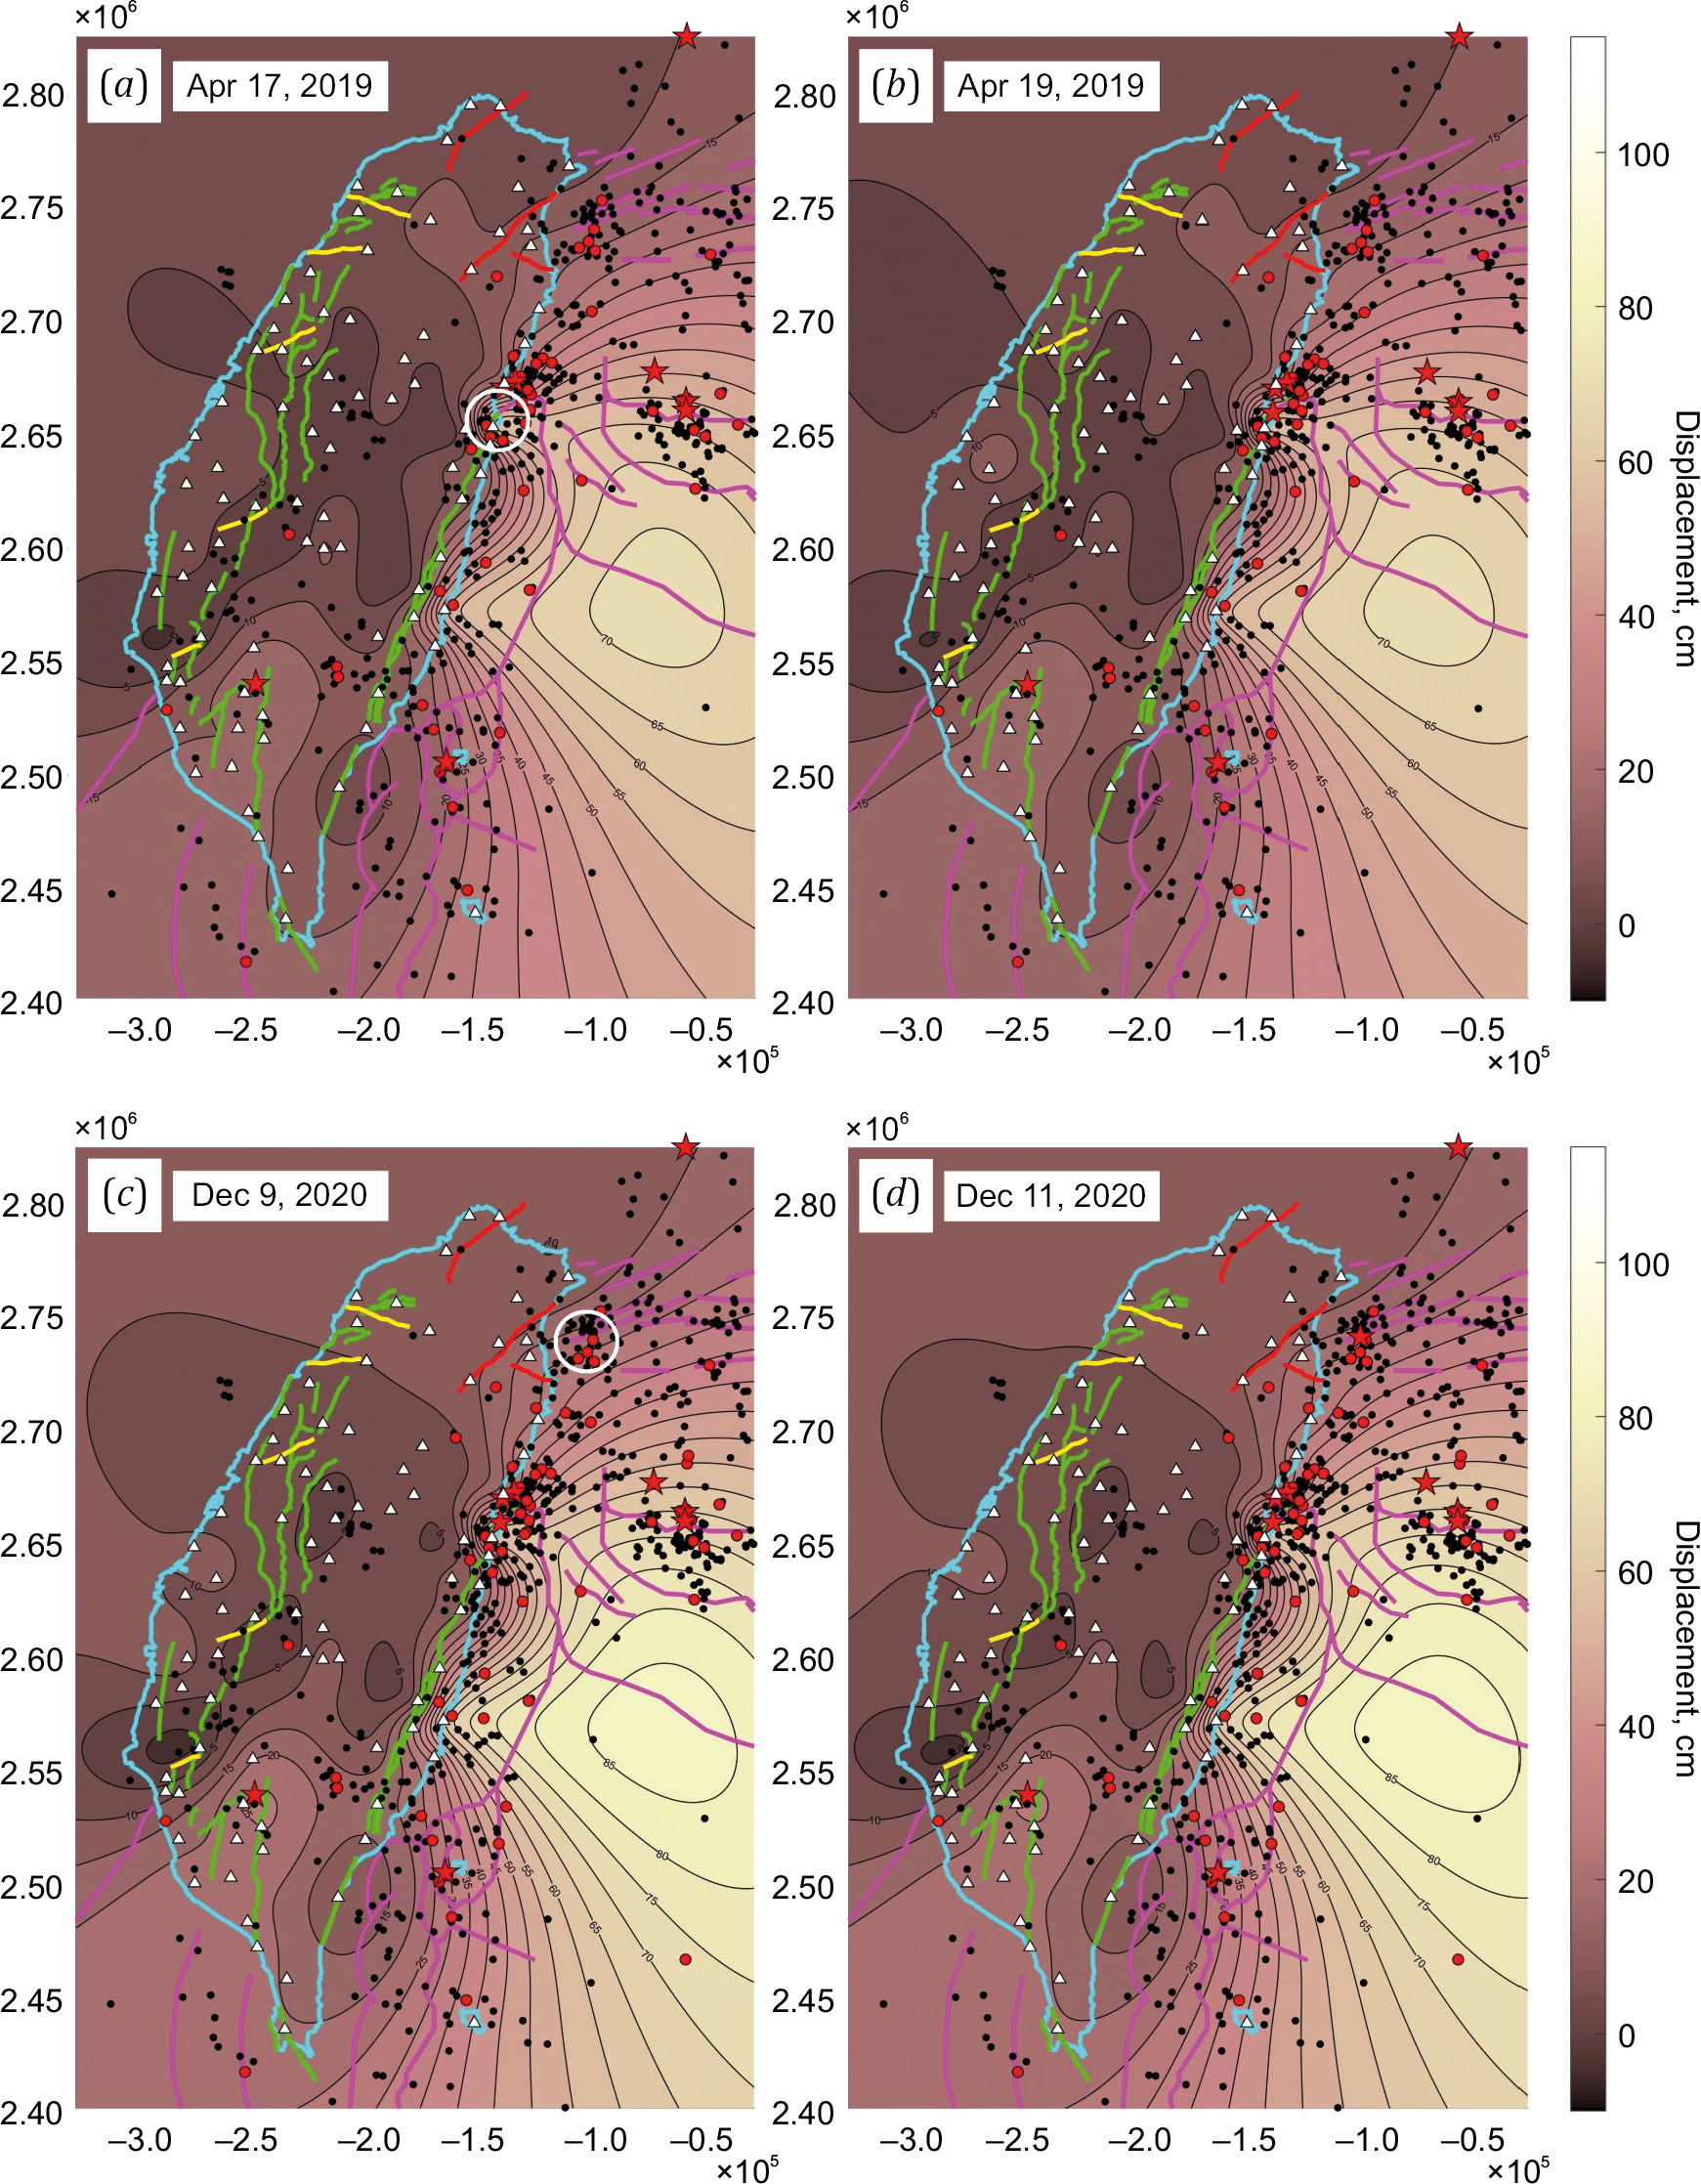
Fig. 5. Formation and destruction of the displacement deficit region in connection with the earthquakes of April 18, 2019 (M6.1) (а, b) and December 10, 2020 (M6.1) (c, d). See Fig. 3 for a common legend.
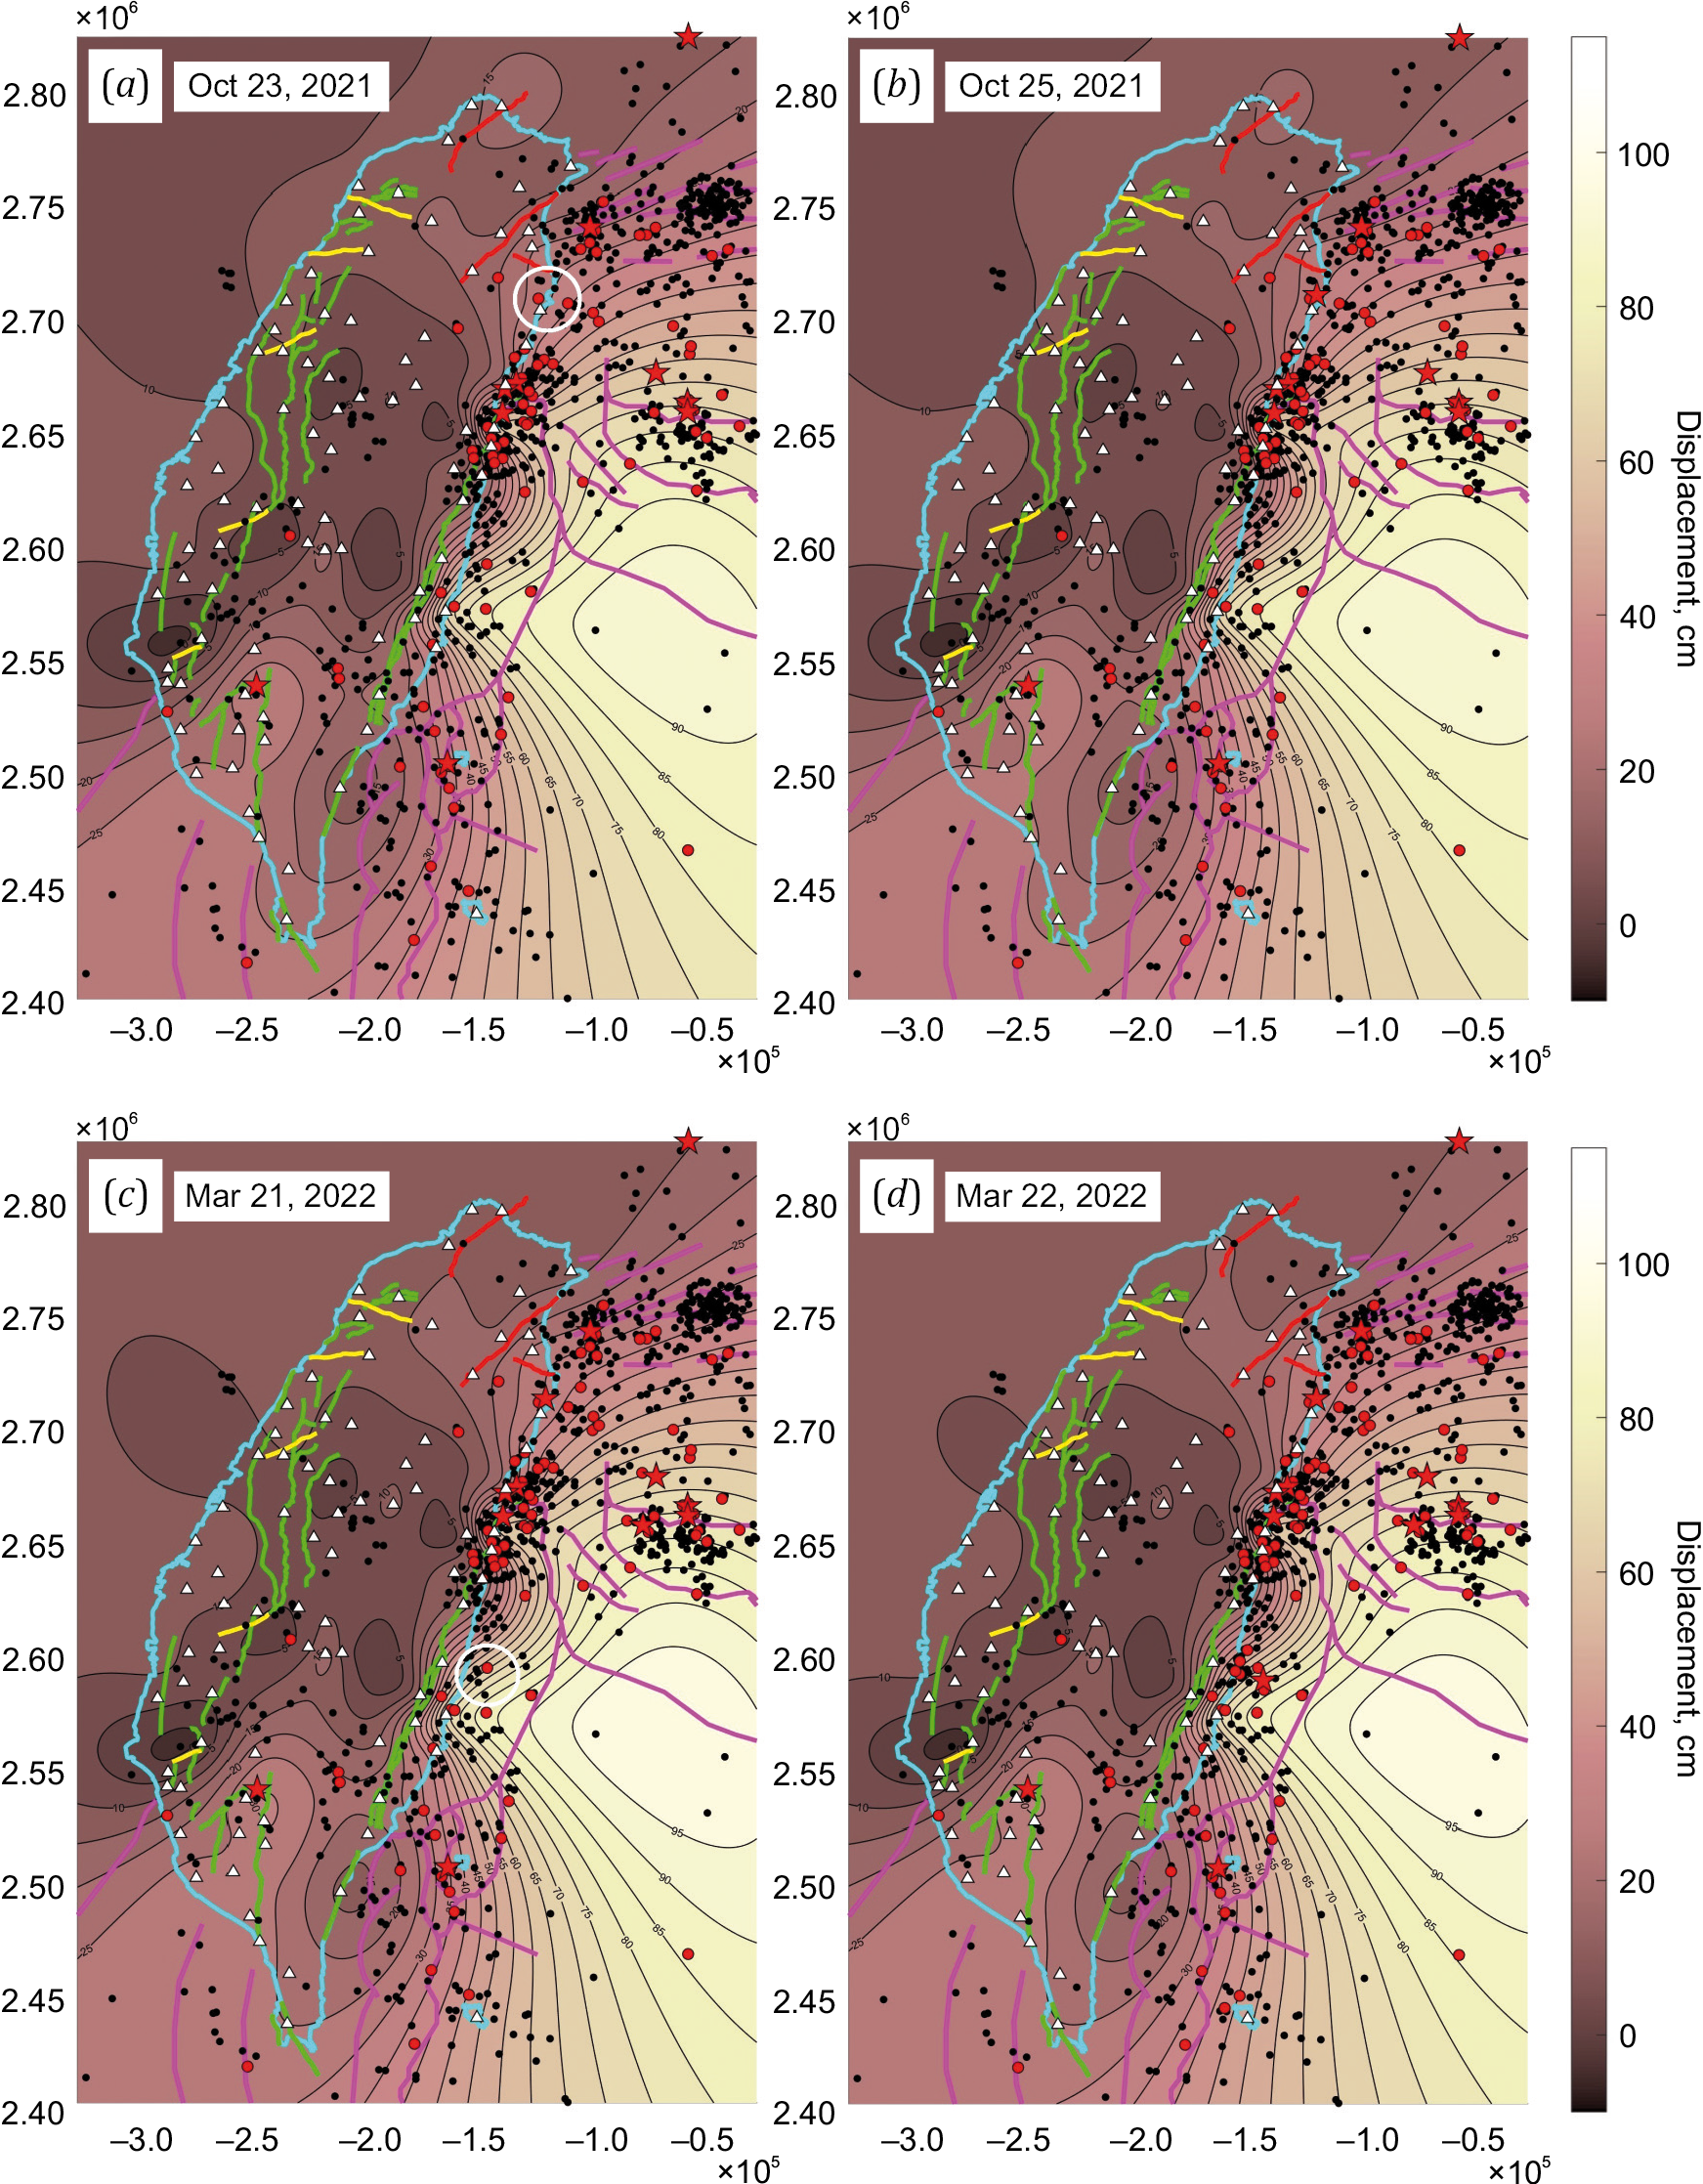
Fig. 6. Formation and destruction of the displacement deficit region in connection with the earthquakes of October 24, 2021 (M6.2) (a, b) and March 22, 2020 (M6.7) (c, d). See Fig. 3 for a common legend.
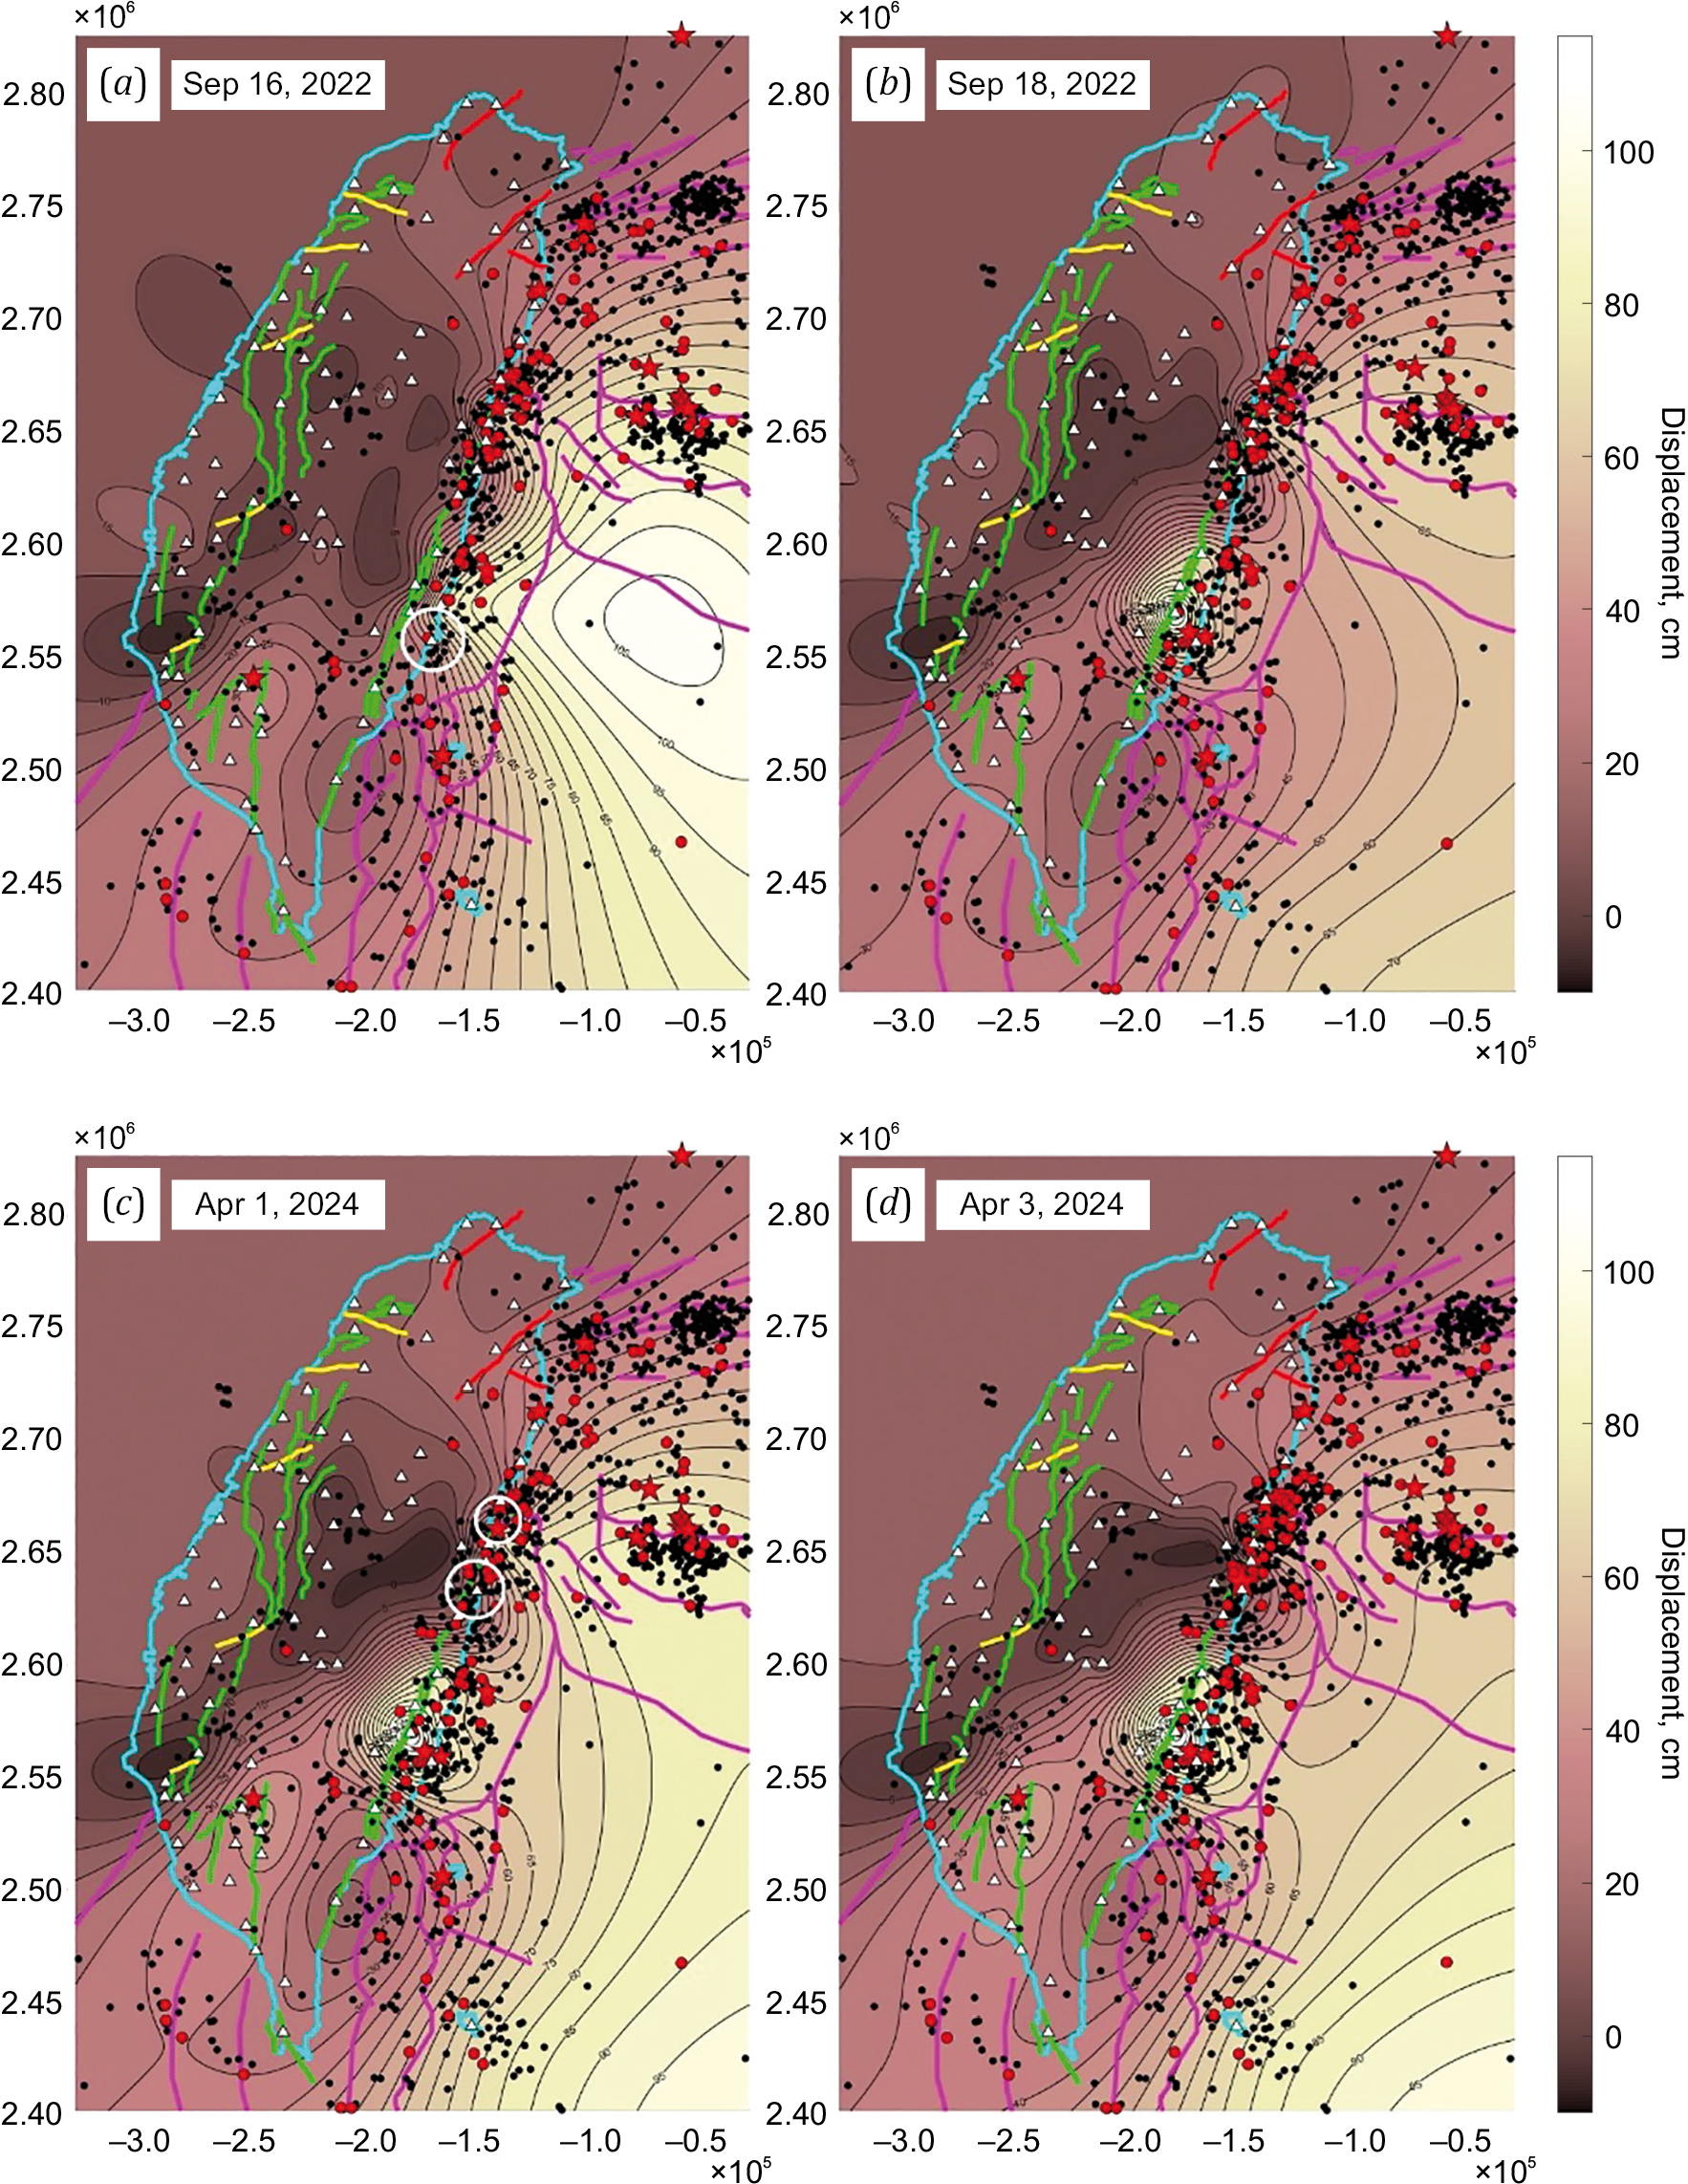
Fig. 7. Formation and destruction of the displacement deficit region in connection with doublets of September 17–18, 2022 (M6.5 and M6.9) (a, b) and April 2–3, 2024 (M7.4 and M6 .4) (c, d). See Fig. 3 for a common legend.
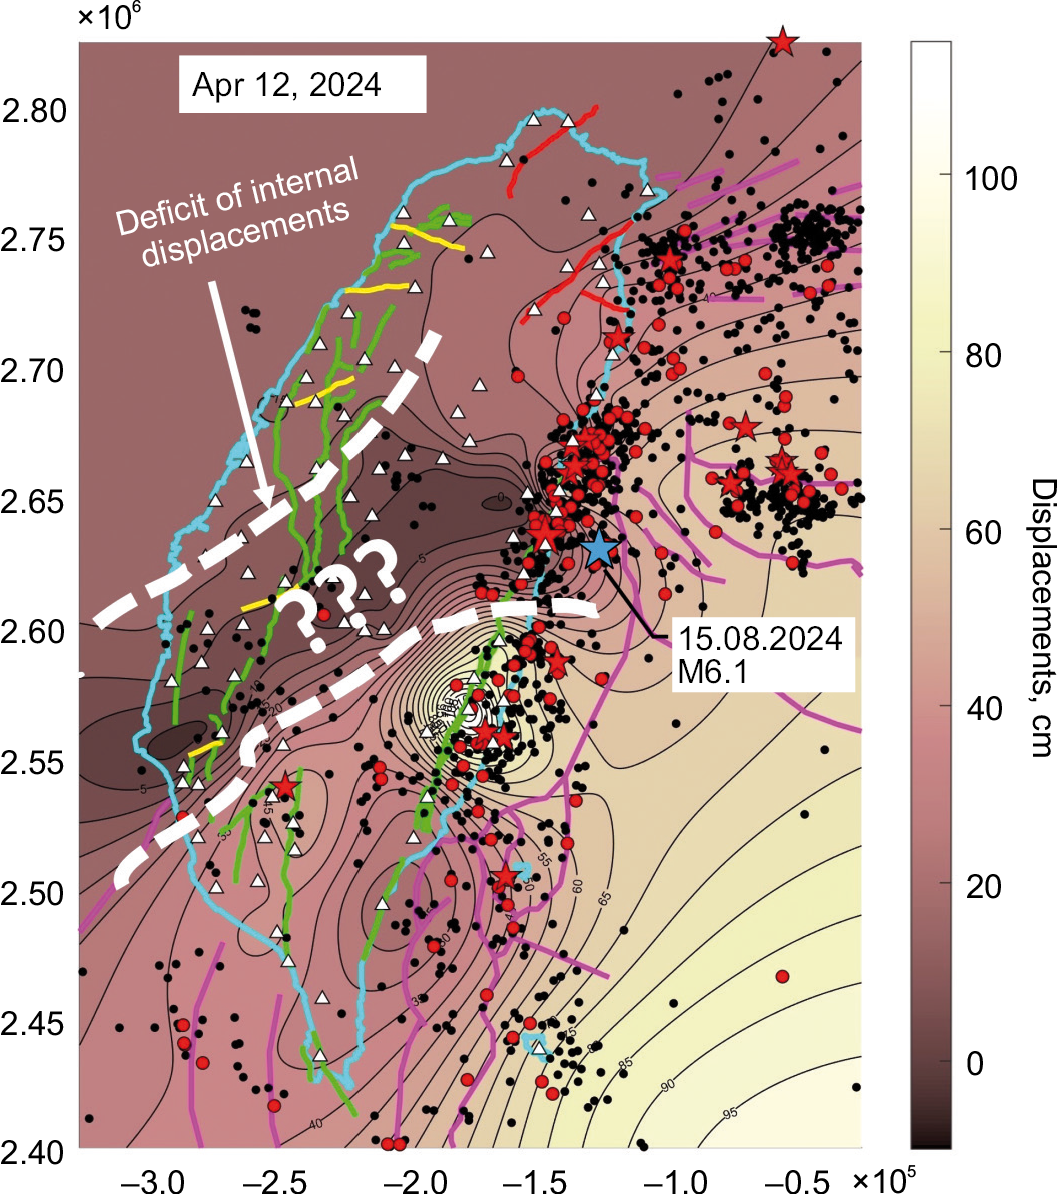
Fig. 8. The zone of inner displacement deficit, accumulated over a decade.
The area is limited by white dashed lines. See Fig. 3 for a common legend. The blue star marks a new strong M6.1 earthquake, which occurred in the northeastern part of the area of accumulated displacement deficit after the article had already been submitted to the journal.
The Island of Taiwan and its surroundings is a territory of high seismic activity. This is facilitated by high mobility of the Earth’s crust at the interaction interface between the Eurasian and the Philippine global tectonic plates.
The geodynamic characteristic named the inner movement (displacement) deficit was formed in the central part of the island. Its spatiotemporal evolution demonstrated the existence of the high-strength crustal zones, which are associated with many strong earthquakes of 2014–2024. Most of the earthquakes, since the formation of the inner displacement deficit area, occurred in slow-to-fast movement transition zones. Such were strong earthquakes of 2016–2024. This indicates that strong earthquakes are generated in high-strength (high-consolidation) crustal zones. These zones mark the places of occurrence of future strong earthquakes. They undergo decomposition after seismic events. The identified patterns are reminiscent of the concept of seismic gaps (lulls) in subduction zones, where the strongest earthquakes subsequently occur in a certain key sequence, alternately covering the entire seismic zone [Fedotov et al., 2007].
It is of interest that, in accordance with the inner movement deficit zone configuration, in the study region there are areas of high concentration of strong earthquakes, the main of which are the Philippine maritime zone and two areas on the east coast of the island. The first lies in tectonically active zone of subduction of the Philippine Sea plate under the Eurasian plate. The other two relate to seismic activity of the Longitudinal Value fault zone. The northern center of seismic activity in this zone is located near the city of Hualien. This place is the junction zone of the Ryukyu Trench with the foot of the mountain belt of Taiwan, marked by the Longitudinal Value fault zone due to the collision of the continental and oceanic global lithospheric plates. It has the highest concentration of strong earthquakes in the region.
Approximately one hundred kilometers south of this tectonic node is another area of concentration of strong seismic events near the city of Chenggong. Distribution pattern of inner movement deficit in Fig. 7, d, shows a significant seismogenic stress release therein. By the time the research was completed, the displacements accumulated there over 10 years were more than 1 meter.
The final configuration of the inner displacement deficit area is a fairly narrow stripe elongated diagonally along the strike of the eastern coast of Taiwan from the point of collision of the Philippine Sea plate with the island territory to the point of subduction of the Eurasian continental plate under the island crust along the Manila Trench.
Thus, our study implies that future strong seismic events may occur within this diagonal stripe, both in the Hualien area and on the southwest coast of Taiwan near Tainan City. This has already been confirmed for the Hualien area during the peer-review process (Fig. 8). The central part of the accumulated displacement deficit concentration zone had already experienced a moderate M5.1 seismic event on November 22, 2017. It did not reduce the displacement deficit in the center of the anomalous zone. Note that earthquakes of such strength do not lead to geodetically observable significant surface displacements [Melnikov, Golikov, 2017].
We recommend the interested researchers to study the video animation [Kaftan et al., 2024b].
1. Blewitt G., Hammond W.C., Kreemer C., 2018. Harnessing the GPS Data Explosion for Interdisciplinary Science. Eos, 99. https://doi.org/10.1029/2018EO104623.
2. Chang J.-M., Chao W.-A., Yang Ch.-M., Huang M.-W., 2024. Coseismic and Subsequent Landslides of the 2024 Hualien Earthquake (M7.2) on April 3 in Taiwan. Landslides 21, 2591–2595. https://doi.org/10.1007/s10346-024-02312-x.
3. Dokukin P., Güvenaltin M.A., Kaftan V., Toker M., 2023а. Synoptic Analysis of Crustal Deformation of the Strongest Earthquakes in Eastern Anatolia (Turkey) 2009–2023. In: Modern Methods of Seismic Hazard Assessment and Earthquakes Prediction. Proceedings of the III All-Russian Scientific Conference with International Participation (October 25–26, 2023). IEPT RAS, Moscow, p. 285–289.
4. Dokukin P.A., Güvenaltin M.A., Kaftan V., Toker M., 2023b. Co- and Pre-seismic Crustal Deformations Related to Large Earthquakes Between Years of 2009 and 2023 Using Continuous CORS-TR GNSS Observations in the Anatolian Diagonal (Turkey). Russian Journal of Earth Sciences 23 (5), ES5005. https://doi.org/10.2205/2023es000877.
5. Fedotov S.A., Solomatin A.V., Chernyshev S.D., 2007. A Long-Term Earthquake Forecast for the Kuril-Kamchatka Island Arc for the Period 2006–2011 and a Successful Forecast of the MS=8.2 Middle Kuril Earthquake of November 15, 2006. Journal of Volcanology and Seismology 1 (3), 143–163. https://doi.org/10.1134/S0742046307030013.
6. Galgana G., Hamburger M., McCaffrey R., Corpuz E., Chen Q., 2007. Analysis of Crustal Deformation in Luzon, Philippines Using Geodetic Observations and Earthquake Focal Mechanisms. Tectonophysics 432 (1–4), 63–87. https://doi.org/10.1016/j.tecto.2006.12.001.
7. Grafarend E., Schaffrin B., 1974. Unbiased Free Net Adjustment. Survey Review 22 (171), 200–218. https://doi.org/10.1179/sre.1974.22.171.200.
8. Gvishiani A.D., Tatarinov V.N., Kaftan V.I., Manevich A.I., Dzeboev B.A., Losev I.V., 2020. The Velocities of Modern Horisontal Movements of Earth Crust in the South Sector of Yenisei Ridge According to GNSS Observations. Doklady Earth Sciences 493, 544–547. https://doi.org/10.1134/S1028334X20070077.
9. Kaftan V.I., 2021a. An Analysis of Ground Movements and Deformations from 13-Year GPS Observations Before and During the July 2019 Ridgecrest, USA Earthquakes. Journal of Volcanology and Seismology 15, 97–106. https://doi.org/10.1134/S0742046321010115.
10. Kaftan V.I., 2021b. Crustal Weather and Strong Earthquakes. Deficit of Modern Movements and Deformation Waves from GNSS Observations. In: Modern Methods of Seismic Hazard Assessment and Earthquake Prediction. Proceedings of the II All-Russian Scientific Conference with International Participation (September 29–30, 2021). IEPT RAS, Moscow, p. 54–55 (in Russian).
11. Kaftan V.I., Dokukin P.A., Manevich A.I., Tatarinov V.N., Shevchuk R.V., 2024a. Deformation Interaction of Strong Earthquakes of 2010–2016 in the Zone of Influence of the Hikuranga Superplume (New Zealand) According to GPS Observations. Geodynamics & Tectonophysics 15 (1), 0735 (in Russian). https://doi.org/10.5800/GT-2024-15-1-0735.
12. Kaftan V.I., Kaftan I., Gök E., 2021. Crustal Movements and Deformations in Eastern Turkey in Connection with the Van Earthquake (October 23, 2011, Mw=7.2): Study from GPS Data. Izvestia, Physics of the Solid Earth 57, 30–44. https://doi.org/10.1134/S1069351321030071.
13. Kaftan V.I., Melnikov A.Yu., Dokukin P.A., 2024b. Evolution of Crustal Inner Displacement Deficit in Connection with Strongest Taiwan’s Earthquakes Migration According to GPS Data from 2014 to 2024. ESDB Repository, GCRAS, Moscow. https://doi.org/10.2205/ESDB-Taiwan-quake-2014-2024.
14. Kaftan V.I., Tatarinov V.N., 2021. An Analysis of Possibilities of GNSS Local Strain Monitoring Networks in Earthquake-Prone Areas. Journal of Volcanology and Seismology 15, 379–386. https://doi.org/10.1134/S074204632106004X.
15. Kaftan V.I., Tatarinov V.N., Shevchuk R.V., 2022. Long-Term Changes in Crustal Movements and Deformations Before and During the 2016 Kumamoto Earthquake Sequence. Geodynamics & Tectonophysics 13 (1), 0570 (in Russian)]. https://doi.org/10.5800/GT-2022-13-1-0570.
16. Kanwal M., 2024. Assessing the Impact of the 2024 Hualien Earthquake in Taiwan (April 6, 2024). Available from: https://ssrn.com/abstract=4786199 (Last Accessed May 15, 2024).
17. Lemenkova P., 2021. Using GMT for 2D and 3D Modeling of the Ryukyu Trench Topography, Pacific Ocean. Miscellanea Geographica 25 (4) 213–225. https://doi.org/10.2478/mgrsd-2020-0038.
18. Malavieille J., Dominguez S., Lu C.-Y., Chen C.-T., Konstantinovskaya E., 2019. Deformation Partitioning in Mountain Belts: Insights from Analogue Modelling Experiments and the Taiwan Collisional Orogen. Geological Magazine 158 (1), 84–103. https://doi.org/10.1017/S0016756819000645.
19. Melnikov A.Yu., Golikov V.D., 2017. Analysis of the Geodetic Network Points Displacements Due to the Brawley Swarm Earthquake M5.3, 2012.08.26 According to GPS Observations. Geodesy and Cartography 78 (11), 22–28 (in Russian). https://doi.org/10.22389/0016-7126-2017-929-11-22-28.
20. Poygina S.G., Petrova N.V., Boldyreva N.V., 2020. Global Earthquakes. Earthquakes of the Northern Eurasia 23, 235–243 (in Russian). https://doi.org/10.35540/1818-6254.2020.23.23.
21. Sella G.F., Dixon T.H., Mao A., 2002. REVEL: A Model for Recent Plate Velocities from Space Geodesy. Journal of Geophysical Research: Solid Earth 107 (В4), 11-1–11-30. https://doi.org/10.1029/2000JB000033.
22. Styron R., Pagani M., 2020. The GEM Global Active Faults Database. Earthquake Spectra 36 (1), 160–180. https://doi.org/10.1177/8755293020944182.
23. Sun Y., Liu M., Dong S., Zhang H., Sci Y., 2015. Active Tectonics in Taiwan: Insights from a 3-D Viscous Finite Element Model. Earthquake Science 28, 353–363. https://doi.org/10.1007/s11589-015-0137-9.
24. Tang X., Guo R., Li L., Xu Y., Xu J., Zheng Y., Sun H., 2024. Earthquake Interactions in Eastern Taiwan: Insight from the 2024 MW7.3 Hualien Earthquake. Seismological Research Letters 96 (1), 9–18. https://doi.org/10.1785/0220240230.
25. Welsch W., 1979. A Review of the Adjustment of Free Networks. Survey Review 25 (194), 167–180. https://doi.org/10.1179/sre.1979.25.194.167.
26. Yu S.-B., Chen H.-Y., Kuo L.-Ch., 1997. Velocity Field of GPS Stations in the Taiwan Area. Tectonophysics 274 (1–3), 41–59. https://doi.org/10.1016/S0040-1951(96)00297-1.
3 Molodezhnaya St, Moscow 119296
6 Miklukho-Maklay St, Moscow 117198
6 Miklukho-Maklay St, Moscow 117198
Kaftan V.I., Melnikov A.Yu., Dokukin P.A. EVOLUTION OF INNER CRUSTAL DISPLACEMENT DEFICIT ACCORDING TO THE GPS DATA IN CONNECTION WITH SEISMICITY IN THE PERIOD OF 2014–2024 AND THE MW=7.4 HUALIEN EARTHQUAKE, TAIWAN. Geodynamics & Tectonophysics. 2025;16(1):0812. https://doi.org/10.5800/GT-2025-16-1-0812. EDN: dkqfqo


Editor-in-Chief
Sklyarov E.V.664033, Irkutsk, Lermontova St., 128,
IEC SB RAS Institute of the Earth's crust
E-mail.: gt@crust.irk.ru
tel.: 8 3952 425422
Processing of personal data


