


Contents
Scroll to:
https://doi.org/10.5800/GT-2024-15-1-0743
EDN: YJRTTA
Scroll to:
The paper deals with the study of seismicity and the crustal stress-strain state of Turkey whose tectonics is caused by relative movements of the African, Aegean, Arabian, Anatolian, Black Sea and Eurasian plates. Seismotectonic deformations (STD) were calculated using the approaches proposed by Yu.V. Riznichenko and S.L. Yunga. The distribution of seismicity, average annual STD rate (STD intensity), seismogenic rupture concentration parameter and the Tsallis parameter was plotted from the earthquake catalog data analysis (more than 300000 events for 1900–2022). The representative part includes the events with М≥2.5. The distribution of the above-mentioned parameters was calculated for a 0–40 km layer wherein most of the earthquakes are located. Deep-focus earthquakes occur at a depth to 170 km. The maximum annual number of earthquakes (more than 90) was recorded in Balikesir Province. Seismicity and STD intensity analysis was made on the periods of 1997–2009 and 2010–2022 for the western and eastern parts of Turkey and for the destructive February 6, 2023 earthquake area. The number of earthquakes recorded in the western part of Turkey (75 %) largely exceeds that recorded in the eastern part (25 %). In the period 2010–2022, there was an increase in the number of earthquakes in the eastern part of Turkey relative to the period 1997–2009, which made up 38 % of the total number of earthquakes. The studies of STD direction are based on the earthquake focal mechanism data (807 events for 1976–2023). STD intensity in the February 6, 2023 earthquake area, with regard to the February 6, 2023 earthquakes, is 1.34⋅10–6 year–1, and the background intensity for the entire period of observation (1900–2022) is –10–10 year–1. The STD maps show the diversity of deformation settings in the study area. Turkey is largely dominated by the horizontal shear mode (eastern and central parts). The extension mode manifests itself in the southwestern part. The western part of Turkey and the southern part of the East Anatolian fault zone are characterized by transtension mode. The Lake Van area is characterized by transpression mode. The shortening axis direction changes from sublatitudinal in the west of Turkey to submeridional in the east. STD tensors served as a base for plotting the distributions of the Lode – Nadai coefficient με and the vertical component. Based on the seismic and GNSS data, a comparison was made between the shortening and elongation axes directions.
Sycheva N.А. SEISMICITY AND CRUSTAL SEISMOTECTONIC DEFORMATIONS OF THE ANATOLIAN PLATE (TURKEY). Geodynamics & Tectonophysics. 2024;15(1):0743. https://doi.org/10.5800/GT-2024-15-1-0743. EDN: YJRTTA
Turkey is a country known for its unique geography uniting the continents and cultures. It also unites the Eurasian, African and Arabian tectonic plates through the Anatolian plate [Bommer et al., 2002] located therein. As a result of the interaction between the Anatolian plate and all surrounding plates, there forms an active tectonic region which covers most of the territory of Turkey.
Kinematics of Anatolia (Fig. 1, а) and the immediate environment has attracted interest from many researchers due to tectonic diversity involving solid body rotation, collision and subduction of the continental plate, large strike-slip and thrust faults, compression and extension [Barka, Kadinsky-Cade, 1988; Sengör et al.,1985].
Anatolia is bounded by the North Anatolian Fault Zone (NAFZ) on the north, the East Anatolian Fault Zone (EAFZ) on the east, and the Hellenic and Cyprus arcs on the south where the Arabian, African and Eurasian plates converge. The EAFZ delineates the boundary between the Arabian and Anatolian plates and represents a 600 km long SE-trending fault zone between Karliova (a locality in Bingöl Province of Turkey) in the north and Kahramanmaraş (a province and a city of Turkey) in the south [Arpat, Saraglu, 1972; Westaway, 1994; McKenzie, 1972]. It is often considered as a continuation of the fault system in the north of the Dead Sea where the subduction of the African plate beneath the Anatolian plate and differential movement of the Arabian plate relative to the African plate are the major trigger mechanisms. In parallel with the NAFZ, the EAFZ is one of the most active transform fault systems in Turkey.
Neotectonics of Turkey is characterized by three major elements [Bozkurt, 2001]:
Besides, an important role is played by the central Dead Sea fault zone.
The EAFZ is the second largest fault system in Turkey after the NAFZ. Unlike the NAFZ, which was associated with 11 large earthquakes over the last ∼75 years, the EAFZ was rather quiet during the same period of time, though the historical records show that the EAFZ can produce large earthquakes [Ambraseys, 1989]. The displacement rates along the EAFZ were neither studied in detail nor adequately assessed in terms of quantity when determining seismic risk [Gunes, 2015]. Perhaps, it is due to rather low seismicity and low slip rate along the EAFZ relative to NAFZ [Aktug et al., 2016].
Turkey experienced several large (M>7.0) instrumental-period earthquakes on the NAFZ and EAFZ. The largest among them was the August 17, 1999 Mw=7.4 earthquake in Kocaeli (a province centered in Izmit city), and the last before the events of 2023 – the October 23, 2011, Mw=7.2 earthquake in Van [Erdik et al., 2012].
The most powerful earthquakes of the EAFZ are Bingöl (a city in Turkey) (22.05.1971, Mw=6.6) and Sürgü (Sürgü fault in Malatya Province, Turkey) (05.05.1986, Mw=6.1). The data on large historical pre-instrumental earthquakes which occurred from 1503 to 1975 along the EAFZ are presented in [Ambraseys, 1989]. Among them are the earthquakes with M=7.1 (1874) and M=6.7 (1875) near Lake Hazar, and the earthquake with M=7.4 (1513) near Gul Bashi (Fig. 1, b).

Fig. 1. Interaction of plates on the territory of Turkey and in its environment (а)
[Işik et al., 2021] and map of earthquakes (more than 500 events)
that occurred in Turkey in 2023 (b).
Asterisks stand for the epicenters of historical earthquakes (red) [Ambraseys, 1989]
and the February 6, 2023 earthquakes with МW=7.8 and МW=7.5 (blue).
Blue lines are seismic gaps on the EAFZ (East Anatolian Fault Zone) [Aktug et al., 2016]:
Palu-Sincik and Çelikhan-Türkoğlu segments (named after the cities of Turkey).
Gray lines are local and regional faults [Bachmanov et al., 2017].
Dash-dotted lines are state borders.
The EAFZ is largely a strike-slip fault system with observable extensional basins including those of Lake Gul Bashi and Lake Hazar [Bozkurt, 2001]. There are different opinions about the beginning of the uplift of the Eastern Anatolian plateau. As reported in [Dewey et al., 1986; Sengör, Kidd, 1979], it began about 13 Ma ago, immediately after the Arabian and Anatolian plates had collided. According to the assumption made in [Robertson, 2000], the collision began as early as the Lower Miocene (16–23 Ma ago). The collision time ranges from 65 Ma [Berberian, King, 1981] to 40 Ma [Hempton, 1987], and from 16–23 Ma [Robertson, 2000] to 5 Ma [Philip et al., 1989]. In accordance with the seismic data, the crustal thickening as a result of the collision reaches ~45 km [Sandvol et al., 2003; Zor et al., 2003]; there is also the crustal thinning from 44 km in the north to 36 km in the south. The average crustal thickness along the EAFZ was estimated at 36 km [Gök et al., 2007].
The time of commencement of shift along the EAFZ is still under discussion, ranging from 1.8 to 12 Ma ago [Arpat, Saraglu, 1972; Hempton, 1987; Lybéris et al., 1992; Yürür, Chorowicz, 1998]. The comparison between geological displacement estimates and present-day GPS slip rate in [Reilinger et al., 1997] allowed assigning the time of commencement of shift to the Pliocene (4–5 Ma ago). The age estimates for certain fault segments vary from 3–5 Ma to the Late Eocene [Jaffey, Robertson, 2001; Westaway, Arger, 2001; Allen et al., 2004].
Many studies consider also the EAFZ segmentation [Barka, Kadinsky-Cade, 1988; Saroglu et al., 1992; Hempton et al., 1981; and others]. The last classifications of the EAFZ segment geometry divide it into 11 [Herece, 2008] and 7 [Duman, Emre, 2013] segments. The 7-segment geometry [Duman, Emre, 2013] seems to be the most complete and improved model to date.
There are distinguished not only geological times of the Arabia-Anatolia collision but also the estimates of the cumulative geological displacement along the EAFZ: 15–22 km [Hempton, 1985], 22–27 km [Arpat, Saraglu, 1972], 22 km [Dewey et al., 1986] and 27–33 km [Allen et al., 2004]. The geological data imply the displacement rate of 6–10 mm/yr, based on a 35–40 km displacement [Westaway, Arger, 1996]. The Lake Hazar basin is often used for estimating the cumulative displacement. The cumulative geological displacement along the Lake Hazar basin is estimated at 9 to 27 km [Arpat, Saraglu, 1972].
A complex geological setting and relatively low seismicity do not make it possible to determine precisely the periods of quiescence or earthquake recurrence intervals on the EAFZ. The slip rate estimates, based on the total cumulative amounts of seismic moments, vary from 29 to 70 mm/yr [Jackson, McKenzie, 1984, 1988; Taymaz et al., 1991].
In [Aktug et al., 2016], the displacement rates along the EAFZ were determined using geodetic observations with high spatial resolution. It was noted that the left-lateral slip rate along the EAFZ differs significantly between the segments north and south of Türkoğlu (Fig. 1, b): remaining almost constant in the north (∼10 mm/year), it abruptly decreases to 4.5 mm/yr in the south. The seismic data show two well-known seismic gaps on the EAFZ [Aktug et al., 2016]: Palu-Sincik and Çelikhan-Türkoğlu segments (blue-lined in Fig. 1, b). The determination of variations in the displacement rates along these segments of the EAFZ plays a decisive role in seismic potential assessment. In [Aktuq et al., 2016] it is established that the largest left-lateral slip rate was found to be 10.5±0.6 mm/yr on the Palu-Sincik segment. Since the most recent earthquake on this segment occurred in 1875, it has a slip deficit of 1.5 m and has the potential of producing an earthquake of Mw7.4, if the whole segment ruptured in one event. In [Aktug et al., 2016], it was stated that the highest left-lateral slip rate is 10.5±0.6 mm/yr on the Palu-Sincik segment. The latest earthquake occurred there in 1875, making it possible to derive a 1.5 m displacement deficit and the probability of occurrence an event of intensity 7.4 [Aktug et al., 2016]. The second seismic fault is on the Çelikhan-Türkoğlu segment which shows the left-lateral slip rate of 10.3±0.7 mm/year. The latest earthquake occurred there in 1513 (Fig. 1, b); it has 5.2 m of displacement deficit. As noted in [Aktug et al., 2016], even if it is assumed that the 1893 earthquake (M=7.1) occurred within the Çelikhan-Gul Bashi segment, the Çelikhan-Türkoğlu segment still has a very high Mw=7.7 earthquake potential. In essence, in [Aktug et al., 2016] a prediction was made concerning the place of the earthquake occurrence and the earthquake intensity.
On February 6, 2023, at 01:17, the junction area between the Levant active left-lateral strike-slip fault zone (the Dead Sea Transform – DST) and the East Anatolian active left-lateral strike-slip fault zone (Şehitkamil District of Gaziantep Province) experienced the Mw=7.8 East Anatolian earthquake, the largest of the past 73 years not only in Turkey but also in the Mediterranean area and Middle East as a whole. An earthquake with Mw=7.5 occurred on the same day, at 10:25, somewhat further north, on the Çardak active fault zone (Ekinözü District of Kahramanmaraş Province) [USGS…, 2023]. In accordance with [Global CMT Catalog, 2023], this was an Mw=7.7 earthquake. The earthquake locations are marked by blue asterisks in Fig. 1, b [USGS…, 2023]. After the earthquakes, there were recorded several thousands of aftershocks, the largest of which had a magnitude of 6.7 Mw [USGS…, 2023] (6.8 Mw after [Global CMT Catalog, 2023]) (Fig. 1, b). The February 6, 2023 earthquakes generated new research interest in this region.
This study is aimed at performing seismic analysis and estimating the stress-strain state based on the STD method. The paper presents the results of seismic analysis for different time periods; different STD parameter maps; and the comparison with Global Navigation Satellite System (GNSS).
Estimation of the stress-strain state of the study area involved the STD method [Lukk, Yunga, 1979; Riznichenko, 1985; Yunga, 1990; and others] which is still actively used today [Lukk, Shevchenko, 2019; Lukk et al., 2015; and others]. The paper also considers the seismogenic rupture concentration parameter KCP, introduced in [Sobolev, Zavyalov, 1980; Zavyalov, 2006].
The concept of non-extensive statistical physics is based on the notion of Tsallis entropy Sq [Tsallis, 1988], which is a generalization of Boltzmann-Gibbs entropy and is often used in description of complex dynamic systems demonstrating the memory effects, scale invariance, fractality, and long-range correlations. Non-extensive statistical physics is actively used in various fields of knowledge; its use in seismology is described in [Sotolongo-Costa, Posadas, 2004; Telesca, Chen, 2010; Vallianatos et al., 2014; Chelidze et al., 2018; and others]. In the opinion of many authors, the Tsallis parameter, q, can be used to measure stability of an active tectonic zone [Telesca, Chen, 2010; Vallianatos et al., 2014; Chelidze et al., 2018; and others]. An abrupt increase in q parameter indicates the intensification of interaction between the fault blocks and their fragments and is related to the deviation from their equilibrium state [Chelidze et al., 2018].
Earthquake catalog. The assessment of qualitative distribution of seismic events, Tsallis parameter q, seismogenic rupture parameter KCP and STD intensity was based on the catalog of earthquakes (more than 300000), obtained from the BOUN KOERI Regional Earthquake-Tsunami Monitoring Center [B.U. KOERI-RTMC…, 2023]. The earthquake epicenters are shown by gray dots in Fig. 2, I. The map, as well as the maps below, depicts the local and regional faults obtained from the database [Bachmanov et al., 2017]. Seismic events are grouped along the fault zones. Fig. 2, II, shows the epicenters of large earthquakes: dark-red asterisks indicate the historical events occurred prior to 1900, red asterisks denote large earthquakes occurred from 1900 to the present, pink asterisks – the earthquakes from [Ambraseys, 1989], and blue asterisks – the February 6, 2023 earthquakes with Mw=7.8 and 7.5 [USGS…, 2023] (here and in the figures below). On the right side of Fig. 2, II there is a list of earthquakes that occurred in Turkey prior to 1900 (24 events marked by dark-red asterisks), with the number, date and magnitude of an event.

Fig. 2. Earthquake epicenters (I) from the catalog [B.U. KOERI-RTMC…, 2023]
and epicenters of strong earthquakes (II). See explanations in the text.
On the right are some quantitative distributions:
(a) – by magnitude, (b) – by years, (c) – by depth.
In the right part of Fig. 2, I there are some statistical characteristics from the earthquake catalog: largely weak events with 1.5≤М≤3 (Fig. 2, Iа), which occurred from 1900 to 2022. Fig. 2, Ib shows a histogram of earthquake distributions by year since 1970. Prior to that period the catalog includes several events per year. Most of the earthquakes occur at depths to 40 km (Fig. 2, Ic). In some areas the earthquakes occur at depths to 170 km. Fig. 3 shows integral projections of earthquakes on a vertical plane which allow visualizing a more detailed distribution of events by depth. There were performed two profiles: west-east and north-south. Red on the map indicates the epicenters of earthquakes occurred at a depth of 50 to 170 km. Most of these earthquakes are located in the western part of Turkey (Izmir Province, below Mugla and Antalya provinces, in the Mediterranean Sea). The vertical projections exhibit earthquake clusters at depths of 10 and 30–33 km. This may be due to difficulties in determining earthquake depths and constraining them to 10 km or to the Moho depth (30–33 km).

Fig. 3. Some characteristics of the earthquake catalog – the epicenters of earthquakes
and their projections on a vertical plane in the north-south and west-east directions.
Events with a depth of >50 km are indicated in red.
In Fig. 4 shows the frequency graph (Fig. 4, a) and the cumulative Gutenberg–Richter distributions (Fig. 4, b). Using the cumulative distribution, an equation for the linear part was obtained (marked with a green line on the graph; approximation was performed using polynomials using the least squares method). The regression equation is shown in the figure on the right. According to the results obtained, earthquakes with M≥2.5 are representative in the catalog.

Fig. 4. Recurrence plot (a) and Gutenberg-Richter [Gutenberg, Richter, 1944] distribution (b)
of earthquakes from the catalog [B.U. KOERI-RTMC…, 2023].
Seismotectonic deformations were calculated using the Focal Mechanism Catalog (FMC) compiled from three sources: CMT data [Global CMT Catalog, 2023], GEOFON data (https://geofon.gfz-potsdam.de/), and KOERI [B.U. KOERI-RTMC…, 2023]. The first source includes the seismic moment tensors for 554 earthquakes (1976–2023), and the second and the third – the nodal plane parameters for 334 (2011–2023) and 327 (2015–2023) earthquakes, respectively.
The final catalog was compiled based on the CMT earthquakes [Global CMT Catalog, 2023]. Each subsequent source was compared to the first and added thereto after it had been pruned of the duplicates.
Fig. 5 shows the FMC focal mechanisms. The color of the mechanism corresponds to the type of motion in the earthquake source (inset of Fig. 5). The type of motion is determined from the location of the principal stress axes which are characterized by a strike azimuth and a plunge angle.

Fig. 5. Earthquake focal mechanisms.
Fig. 6, a shows some statistical characteristics of the FMC, containing principally the events with 4≤М≤5.5 (Fig 6, а, at the top) which occurred from 1976 to 2023 (Fig. 6, а, in the center). The most representative data are those obtained over the last decade. The maximum number of events occurred at a depth of 10 km (Fig. 6, а, in the bottom).
The FMC also involved the projection of earthquakes on a vertical plane along two cross-sections (Fig. 6, b); the earthquake location color therewith depends on the type of motion (which corresponds to the legend in Fig. 6, b). The projections make it possible to mark the depths of occurrence of earthquakes with any type of source motion. In the eastern part of Turkey this is a horizontal shear, with normal faults and reverse faults occurring at depths to 35 km. In the western part of the Turkey this is also a horizontal shear, with normal faults occurring at depths to ~40 km; the maximum depth of occurrence of reverse faults is 60 km. The deep-focus earthquakes are characterized by incision patterns and reverse slips.

Fig. 6. Some characteristics of the catalog of focal mechanisms.
(a) – quantitative distribution of earthquakes by magnitude, time and depth;
(b) – earthquake epicenters and their projections onto the vertical plane
in the north–south and west–east directions.
High seismicity and large earthquakes (see Fig. 2) are indicative of active geodynamic processes occurring in Turkey. The assessment of some of their characteristics involved plotting areal distributions of seismic activity (an annual number of earthquakes per an area unit), STD intensity IƩ, seismogenic rupture parameter KСР, and Tsallis parameter q.
The above-mentioned parameters of the study area were calculated for each cell of size 1×1°, shift 1°. The calculation was made with regard to representative datasets in the catalog.
Fig. 7 shows an annual earthquake number for the study area. The maximum number corresponds to the cells with the coordinates of 27.5° E and 39.5° N and 29.5° E and 39.5° N (Balikesir Province, western Turkey). According to [List…, 2023], there occurred 9 earthquakes with М≥6, including the November 18, 1919 Ayvalık earthquake with M=7 [List…, 2023]. The cells where occur more than 20 earthquakes per year are shown in dark green. A high seismicity level is typical of the western part of Turkey. This territory exhibits a dense grid of faults, most of which, according to [Emre et al., 2013], are active. High seismicity is also typical of the NAFZ and the EAFZ.
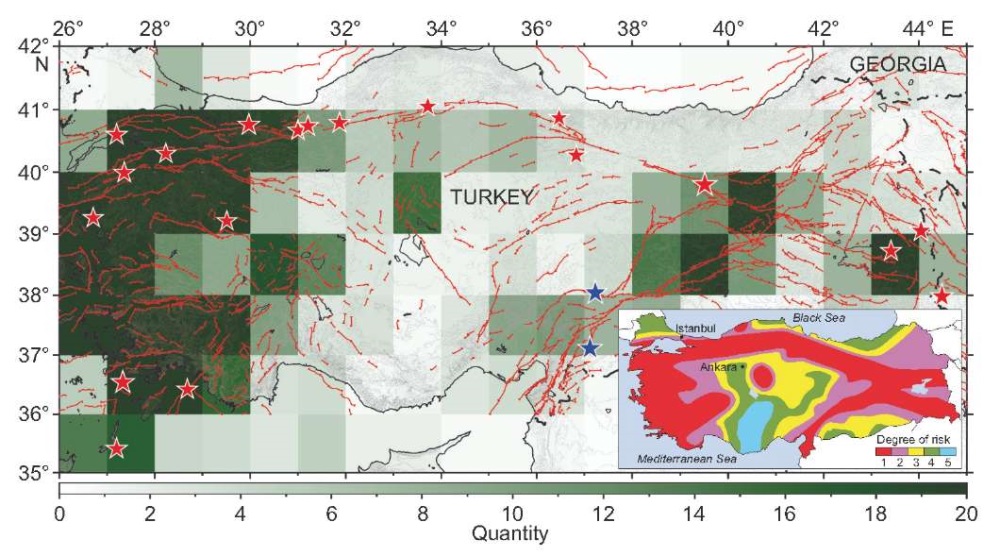
Fig. 7. Distribution of the annual numbers of earthquakes
according to the earthquake catalog.
Asterisks indicate the epicenters of earthquakes;
red stands for the events with М≥7.
The inset shows the seismic risk map for Turkey.
The inset on Fig. 7 shows the seismic risk map for Turkey [Gunes, 2015]. The high seismicity area follows the shape of the high risk area (red on the inset). The asterisks on the map indicate the epicenters of М≥7 earthquakes from the earthquake catalog (1900–2022), located largely in western Turkey and along the NAFZ. In spite of high seismicity along the EAFZ (see Fig. 2, II), that area did not experience the М≥7 earthquakes in accordance with the earthquake catalog (1900–2022); Fig. 1, b, shows pre-instrumental historical earthquakes [Ambraseys, 1989]; Fig. 2, II shows the M≥6earthquakes from [List…, 2023] which occurred in its northern part. The earthquakes occurred on February 6, 2023 in the southern part of the EAFZ are the only events of such magnitude.
The February 6, 2023 earthquakes emphasize the importance of seismic hazard assessment for the western and eastern parts of Turkey in the coming decades. The quantitative seismic analysis was made for two areas: western (35–42° N, 26–35° E) and eastern (35–42° N, 35–45° E) parts of Turkey separated by the 35th meridian. In the eastern part, a special consideration is being given to the February 6, 2023 earthquake area (35–39° N, 36–39° E). The boundaries of the areas considered are shown in turquoise in Fig. 8. The quantitative analysis was made for two periods of time: 2010–2022 (13 years) and 1997–2009 (13 years). For each of the areas, there were calculated the following characteristics: the number of earthquakes for the whole period, the annual number of earthquakes in the cell (1×1°), and the number of earthquakes with M<4 and with М≥4. The above-mentioned characteristics were calculated both from the entire catalog and its representative part. The numbers of earthquakes with M<3 and with М≥3 was calculated from the entire catalog, because it includes small-magnitude earthquakes. The obtained results are presented in Table 1.

Fig. 8. Distribution of the annual number of earthquakes for two periods of time.
Triangles mark the locations of seismic stations:
on the left – 101 stations; on the right – 249 stations.
Table 1. Some quantitative characteristics of seismicity for certain zones of Turkey
during two periods of time, 1997–2009 and 2010–2022
|
All earthquakes in the catalog |
||||||||||
|
1997–2009 |
2010–2022 |
|||||||||
|
N |
Annual N |
Cell |
М<3 |
M≥3 |
N |
Annual N |
Cell |
М<3 |
M≥3 |
|
|
1 |
43936 |
3379 |
62.57 |
27588 |
16343 |
172337 |
13256 |
245.4 |
160659 |
11678 |
|
2 |
14515 |
1116 |
18.66 |
6554 |
7961 |
62739 |
4826 |
80.43 |
55928 |
6811 |
|
3 |
4028 |
309 |
25.75 |
2091 |
1937 |
18644 |
1434 |
119.5 |
17353 |
1291 |
|
Representative part of the catalog (М≥2.5) |
||||||||||
|
Total |
Annual N |
Cell |
М<4 |
M≥4 |
Всего |
Annual N |
Cell |
М<4 |
M≥4 |
|
|
1 |
40776 |
3136 |
51.15 |
40259 |
517 |
35891 |
2760 |
46.25 |
35002 |
889 |
|
2 |
13849 |
1065 |
15.0 |
13451 |
398 |
21816 |
1678 |
22.12 |
21007 |
739 |
|
3 |
3694 |
284 |
23.67 |
3594 |
100 |
4579 |
352 |
27.25 |
4438 |
141 |
Note. 1 –western part of Turkey (35–42° N, 26–35° E);
2 – eastern part of Turkey (35–42° N, 35–45° E);
3 – small eastern area (35–39° N, 36–39° E).
The tabulated data include the following.
Entire catalog, period 1997–2009:
Period 2010–2022:
Representative part of the catalog, period 1997–2009:
Period 2010–2022:
In parallel with the number of earthquakes for the areas considered, there were calculated the histograms of annual distribution of earthquakes for the above-mentioned periods. The obtained results are presented in Fig. 9. All three areas show a significant increase in the number of earthquakes for the period 2010–2022 as compared to the period 1997–2009. Such an increase in the number of earthquakes can be due to both the change in the geodynamic regime and the increase in the number of seismic stations which enhanced the recording capabilities of the network. The left part of Fig. 8, a, shows the location of 111 network stations which were installed in the study area from 2000 to 2009 [Global CMT Catalog, 2023]. The right part of Fig. 8, b shows the location of the stations which had already been in operation or were installed in the study area from 2010 to 2020. The second period is characterized by a significant increase in the number of seismic stations in the westernmost part of Turkey. Station density in the central and eastern parts increased insignificantly. This suggests that a large increase in the number of earthquakes for the period 2010–2022 as compared with the period 1997–2009 can also relate to the change in the geodynamic setting.
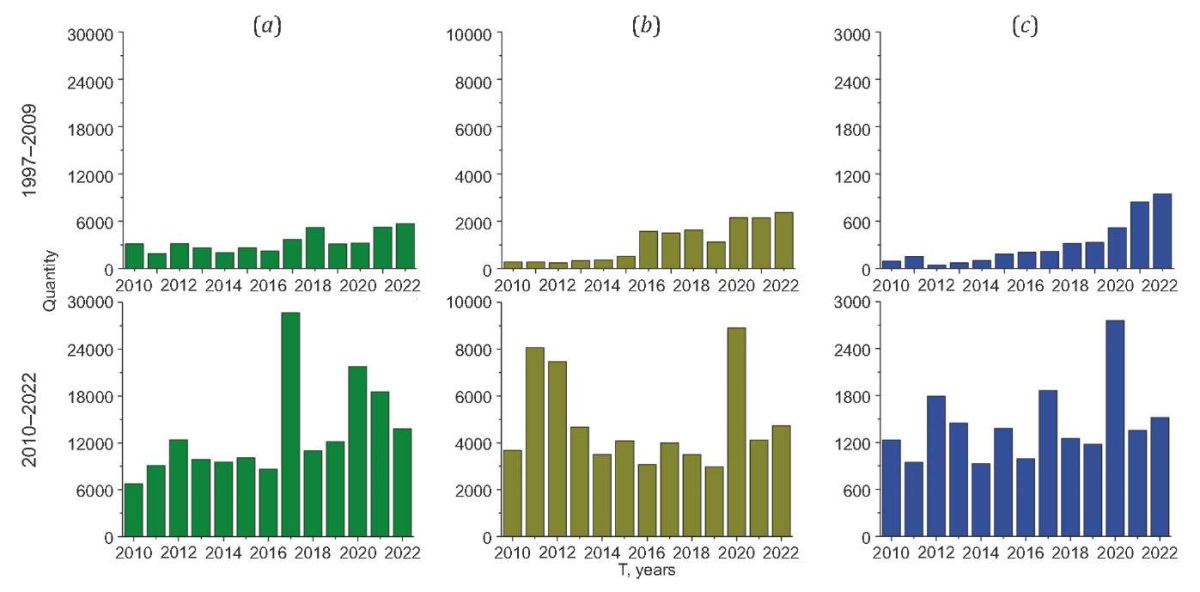
Fig. 9. Annual distribution of the number of earthquakes for two periods of time.
(a) – Western Turkey; (b) – Eastern Turkey;
(c) – small eastern area which experienced Mw=7.8
and Mw=7.5 earthquakes on February 6, 2023.
The Tsallis parameter q=1.52, calculated for the whole catalog, is in agreement with the values obtained for other seismoactive regions [Silva et al., 2006; Telesca, Chen, 2010; and others]. Moreover, all q-values obtained for different seismoactive regions of the world are q≈1.5–1.7, which testifies to the universality of this constant [Posadas, Sotolongo-Costa, 2023]. The areal distribution of this parameter makes it possible to estimate the stability of an active tectonic zone and its constituent areas (Fig. 10, b). In spite of high seismicity in the considerable part of the territory of Turkey, the Tsallis parameter is inhomogeneous. The minimum value is q=0.95, the maximum value is q=1.63. Most of the areas which experienced М≥7 earthquakes (red asterisks) are characterized by the Tsallis parameter value q≥1.56 that implies their state instability, a continuing process of seismic activity, and seismogenerating zones not yet returned to relative equilibrium states. Noteworthy is the area of forthcoming earthquakes on February 6, 2023. The Tsallis parameter for this area is q=1.4 (lower than that q=1.52 for the whole catalog). Such q-value is only observed for an aseismic part of the Anatolian plate. In terms of the EAFZ, the Tsallis parameter for the area located higher than that of the forthcoming earthquakes, is q>1.5, thus also characterizing it as seismically active (the place of occurrence of earthquakes with М>6, see Fig. 2, II) and experiencing stress discharge. A lower q parameter value in the area of forthcoming earthquakes may imply the absence of active discharge and stress accumulation related to the northwestward movement of the Arabian plate (see Fig. 1, а). As noted in [Aktug et al., 2016], this part has a very high seismic potential.

Fig. 10. Recurrence plot (a) drawn for the entire catalog (blue)
and its approximation (red). Areal distribution of the Tsallis parameter q (b).
Asterisks indicate the epicenters of earthquakes:
red – with M≥7, blue – with Mw=7.8 and Mw=7.5, occurred on February 6, 2023.
The STD intensity was calculated based on the FMC. The list of the events under analysis includes the earthquakes occurred on February 6, 2023 and their aftershocks (50 events in total). The distribution of the logarithm of STD intensity on the study area with or without regard to 2023 is shown in Fig. 11. The intensity values obtained for the entire catalog earthquakes and the STD intensity in the region in the February 6, 2023 earthquakes area are presented in Table 2. Prior to 2023, the maximum STD intensity value (6.8⋅10–7 year–1) falls within Kodzhaeli Province which experienced a catastrophic МW=7.6 earthquake (Fig. 11, а). After the February 6, 2023 earthquakes, the maximum STD intensity occurs in Gaziantep Province (Fig. 11, b, 1.34×10⁻⁶ year–1); prior to the earthquakes, the STD intensity therein was of the order of 10–9 year-1 (Table 2).

Fig. 11. The distribution of the logarithm of the STD intensity
calculated from the catalog of focal mechanisms
without taking into account the data for 2023 (a)
and taking into account the data for 2023 (b).
Table 2. STD intensity calculated from the FMC and from the earthquake catalog
|
Source |
Period |
year–1 |
||||
|
Min |
Max |
Mean. |
Median |
06.02.2023 |
||
|
FMC |
1976–2022 |
3.51⋅10–12 |
6.80⋅10–7 |
1.40⋅10–8 |
5.51⋅10–10 |
2.72⋅10–9 |
|
1976–2023 |
3.44⋅10–12 |
1.34⋅10–6 |
3.81⋅10–8 |
6.24⋅10–10 |
1.34⋅10–6 |
|
|
Earthquake Catalogue |
1900–2022 |
8.81⋅10–13 |
3.31⋅10–9 |
5.76⋅10–10 |
3.31⋅10–10 |
1.8⋅10–10 |
|
1997–2009 |
1.77⋅10–12 |
1.01⋅10–8 |
6.40⋅10–10 |
1.37⋅10–10 |
1.5⋅10–10 |
|
|
2010–2022 |
3.93⋅10–13 |
1.57⋅10–8 |
9.21⋅10–10 |
1.72⋅10–10 |
7.4⋅10–10 |
|
Note. 06.02.2023 marks a cell (with coordinates of the center 37.5° N, 37.5° E)
where the February 6, 2023 earthquakes occur.
The STD intensity is a quantitative characteristic. Knowing the earthquake magnitude, one may calculate the scalar seismic moment. The STD intensity is calculated by summing up the scalar seismic moments within each area according to [Lukk, Yunga, 1979]. This provides the possibility to calculate the STD intensity using the earthquake catalog data. The distribution of the "background" STD intensity for the two periods considered – 1997–2009 and 2020–2022, – calculated based on the analysis of 2.5≤М<6 seismic events from the earthquake catalog, is shown in Fig. 12.

Fig. 12. Distribution of the logarithm of STD intensity for two periods of time.
The background STD intensity in the February 6, 2023 earthquake area (Gaziantep Province) is 1.8⋅10–10 year–1 for the entire observation period, 1.5⋅10–10 year–1 for the period 1997–2009, and 7.4⋅10–10 year–1 for the last observation period (2010–2022). All these values are lower than the mean STD intensity in the study area for the same periods. It is only in the past decade that there was an insignificant, a half an order of magnitude increase in the STD intensity.
In [Sobolev, Zavyalov, 1980; Zavyalov, 2006], the seismogenic rupture concentration parameter, KCP, is used for earthquake prediction. The present paper involves this parameter for the reason that it can reflect two previous characteristics together, since it is calculated based on both the number of earthquakes per unit volume and a class (or a magnitude) of an earthquake. Fig. 13 shows the KCP distribution. Blue on the map corresponds to the low value of this parameter (see legend in Fig. 13) which is indicative of a high concentration of fractures (seismogenic ruptures).

Fig. 13. Distribution of the KСР parameter according to the data of the earthquake catalog.
The seismogenic rupture concentration parameter KСР has a cumulative nature and determines the instability condition. The lower its value, the higher is the deformation instability. The cell where the February earthquakes occurred has a higher KСР than the М≥7 earthquake areas and the northern part of the EAFZ – the place where large events occurred, – which may imply the absence of sufficient release of stress (seismic ruptures) therein.
In the STD calculations, the geostructural area is subdivided into elementary subareas with radius r=0.5 and the centers located in the nodes (nodal points) on the grid with a step of 0.5° (~50 km) that smoothes data. The area with radius r=0.5 can also be a potential large earthquake preparation zone (100-km diameter).
Fig. 14 shows the STD map. The orientation of rectangle and arrows on the horizontal surface gives an indication of the azimuthal direction of the axes of shortening and elongation, respectively. The mark color means STD mode (to the right of the map are STD modes according to the classification [Yunga, 1997]; listed below are the names of the deformation modes).

Fig. 14. STD map.
STD modes: TT – all-round compression,
TV – transitional mode from vertical shift to compression,
T – compression, TS – transpression, О – oblique,
S – horizontal shift, NS – transtension, N – tension,
NV – transitional mode from vertical shift to tension,
V – vertical shift, NN – all-round tension.
The territory of Turkey is characterized by different STD modes. In the western coastal part of Turkey, in the area of a semicircle (following the shape of the coast) there is the horizontal shear mode which changes to the transtension mode towards the east; the southwestern part is characterized by the extensional mode. In the central part of the Anatolian plate there lies a seismic zone, elongated from south to north, which is characterized by the horizontal shear mode. In the north, along the North Anatolian fault, there are local areas with the transtension and vertical shear to extension transition modes. The area including Lake Van and its immediate environment is characterized by the transpression mode. The southern part of the EAFZ is characterized by the transtension mode, and its central and northern parts – by the horizontal shear mode. The location of earthquakes, occurred since February 6, 2023, coincides with the northeastern margin of the area located in the southern part of the EAFZ which is characterized by the transtension mode. In the easternmost part of Turkey the shortening axes are directed towards the north. Along the EAFZ, the shortening axes are directed towards the north-northeast. In the northern part of Turkey, the shortening axes have northwestern orientation which changes to sublatitudinal in its western part.
To compare the results obtained by the STD calculation method, there are presented the results for the deformation velocity field calculations made in [Gülal et al., 2013] for the active Fethiye-Budur fault zone (FBFZ). The Southwestern Anatolia, including the FBFZ, is monitored by 44 GNSS stations, among which there are 16 permanent and 28 agitation stations. The measurements were made by combining 2003–2006 [Erdogan et al., 2009], 2009 and 2010 observation data. Fig. 15 shows the STD map (Fig. 15, a) and the horizontal deformation velocity field (Fig. 15, b) [Gülal et al., 2013]; blue color in both maps marks the direction of the elongation axis, red color – the direction of the shortening axis. A visual comparison shows good agreement between the elongation and shortening axes directions obtained from the seismic and GNSS data in the areas where the data are represented by two methods. The lack of the digital GNSS measurement data does not allow making a quantitative assessment of the data consistency.

Fig. 15. STD map (a) and horizontal strain rate (b)
calculated from velocity vectors in the Fethiye-Burdur Fault Zone (FBFZ)
after [Gülal et al., 2013].
To understand the kinematics of the Anatolian plate, in [Aktug et al., 2016] the calculation was made for the slip rate along the EAFZ. This study collected and analyzed new GNSS data which were then combined with the data from previously published research that has allowed compiling the most complete GNSS dataset for the EAFZ.
Fig. 16 shows the STD map and the velocity field obtained in [Aktug et al., 2016]. Red asterisks in Fig. 16, a indicate the epicenters of earthquakes which occurred on February 6, 2023 and localities mentioned in [Aktug et al., 2016] as hazardous. The GNSS-based velocities in the area of future earthquakes are lower than those observed northwards along the EAFZ; in accordance with the STD data, this area is characterized as transtensional whereas the EAFZ higher than the Sincik district is suggestive of the horizontal shear mode. The February earthquakes occurred during replacement of one deformation mode by another.

Fig. 16. STD map (a) and velocity field (b) for the EAFS after [Aktug et al., 2016].
The distribution of the Lode – Nadai coefficient is shown in Fig. 17, a. The legend shows that most of the territory of Turkey is characterized by the simple shift mode (–0.2≤με≤+0.2) and by the predominance of simple tension (–0.6<με<–0.2). The simple compression mode (0.6≤με≤1) is typical of two small areas, one of which is located near Lake Van, the other – in the western part of Tukey along the FBFZ. The area that experienced large February 6, 2023 earthquakes is characterized by the predominance of simple tension.
The vertical component, which is not visualized on the maps of the direction of STD, allows assessing changes in relief height. It is negative (subsidence value) or zero on the larger part of the study area, except for a small locality in the Lake Van surroundings (eastern part of Turkey) (Fig. 17, b). The February 6, 2023 earthquake area (red asterisks) undergoes a period of tectonic subsidence.
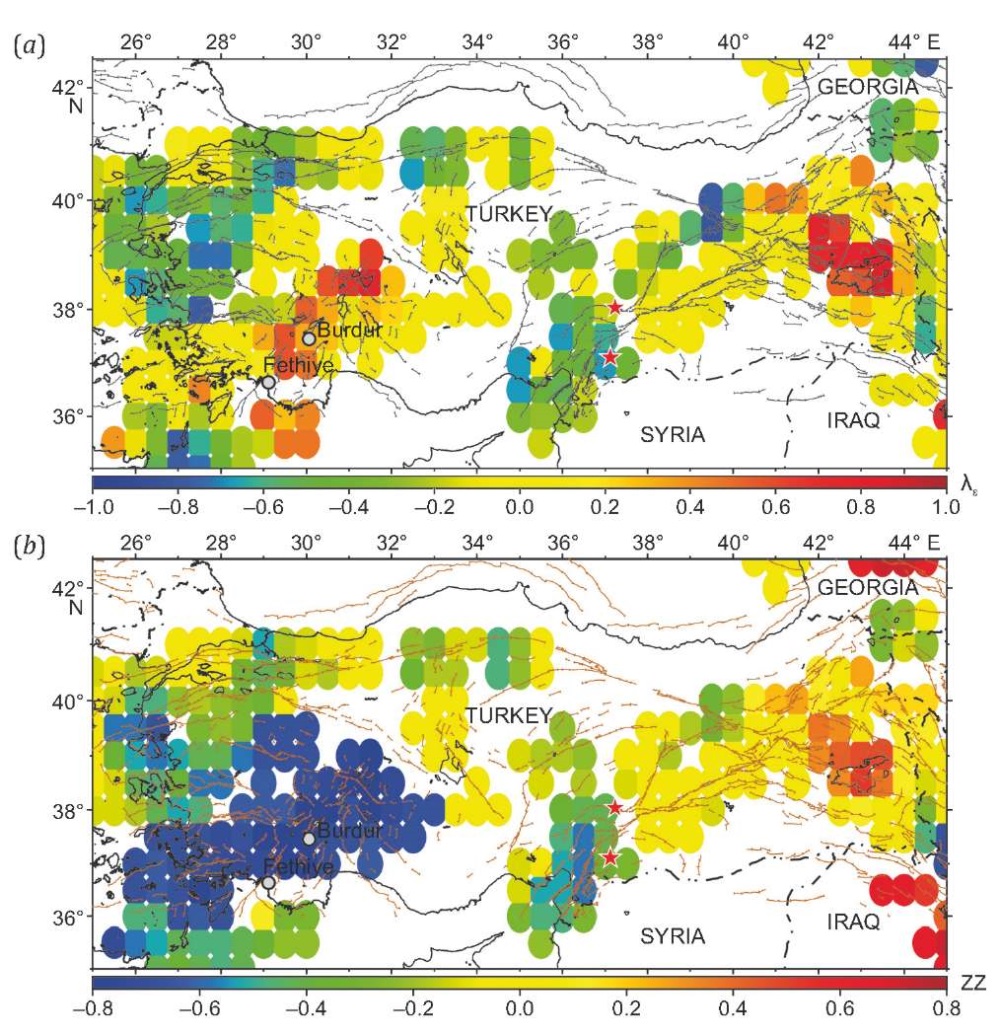
Fig. 17. Distribution of Lode – Nadai coefficient με (а)
and vertical component ZZ of the average strain tensors (b).
Relationship between the Lode – Nadai coefficient and the STD regime:
0.6<me≤1.0, red – simple compression;
0.2<me≤0.6, orange – predominance of simple compression;
–0.2<me≤+0.2, yellow – simple shift;
–0.6≤me<–0.2, green – predominance of simple tension;
–1.0≤me<–0.6, blue – simple tension.
Using the seismic and earthquake focal mechanism data, the analysis was made on seismicity and stress-strain state of the earth’s crust of Turkey. According to the cumulated Gutenberg–Richer distribution, the representative events in the catalog are those with M≥2.5. Величина b-value составляет 0.87. b-value is 0.87. The integral projections on a vertical plane showed that the earthquakes in the study area occur at depths of 0–170 km, the seismogenic layer thickness can be 0 to 40 km, and deep-focus earthquakes occur near Izmir Province (access to the Aegean Sea) and in the Mediterranean coastal areas bordering Mugla and Antalya provinces. The maximum annual number of earthquakes falls within Balikesir Province (western part of Turkey). During the period from 1997 to 2009, 75 % of earthquakes occurred in the western part of Turkey and 25% of them occurred in the eastern part, respectively. During the period from 2010 to 2022, the number of earthquakes in the eastern part increased up to 38 %.
The Tsallis parameter, q=1.52, is in agreement with the values obtained for other seismoactive regions. For the February 6, 2023 earthquake area, the value of this parameter was q=1.4 (lower than that for the entire catalog and seismoactive regions) which implies the absence of stress discharge therein prior to destructive events of February 6, 2023. The value of the KСР parameter for the area of subsequent earthquakes on February 6, 2023 is higher than that for the М≥7 earthquake areas and for the northern part of the EAFZ – the area of large events, – which also indicates the absence of an adequate discharge of stress (seismic ruptures) in this part of the EAFZ. The mean background STD intensity on the territory of Turkey over the entire observation period (1900–2022) is 5.8⋅10–10 year–1; the STD intensity in the area of forthcoming earthquakes of February 6, 2023 is half order of magnitude lower making 1.8⋅10–10 year–1. For the period from 1997 to 2009, the STD intensity in this area is 1.5⋅10–10 year–1 (lower than that for the entire period); for the period from 2010 to 2022 – 7.4⋅10–10 year–1 (half order of magnitude higher than that for the previous period). The STD intensity in the February 6, 2023 earthquake area, with regard to the February 6, 2023 earthquakes, is 1.34⋅10–6 year–1. Based on the STD mode classification, the STD map was drawn showing a variety of STD modes: horizontal shear (eastern and central parts of Turkey), transtension (southern part of the EAFZ and western coastal part of Turkey), extension (southwestern part of Turkey), transpression (Lake Van area location). The comparison of deformation models for the Fethiye-Budur fault by the STD method and GNSS data showed a good consistency between the elongation and shortening axes directions. A large part of the territory of Turkey is characterized by a simple shear mode; its western part undergoes predominantly simple extension deformation, the Lake Van location area – predominantly simple compression deformation. The western part of Turkey and the southern part of the EAFZ undergo the subsidence, the Lake Van area location undergoes rise.
The author has no conflicts of interest to declare. The author read and approved the final manuscript.
1. Aktug B., Ozener H., Dogru A., Sabuncu A., Turgut B., Halicioglu K., Yilmaz O., Havazli E., 2016. Slip Rates and Seismic Potential on the East Anatolian Fault System Using an Improved GPS Velocity Field. Journal of Geodynamics 94–95, 1–12. https://doi.org/10.1016/j.jog.2016.01.001.
2. Allen M., Jackson J., Walker R., 2004. Late Cenozoic Reorganization of the Arabia-Eurasia Collision and the Comparison of Short-Term and Long-Term Deformation Rates. Tectonics 23 (2), TC2008. https://doi.org/10.1029/2003TC001530.
3. Ambraseys N.N., 1989. Temporary Seismic Quiescence: SE Turkey. Geophysical Journal International 96 (2), 311–331. https://doi.org/10.1111/j.1365-246X.1989.tb04453.x.
4. Arpat E., Saraglu F., 1972. The East Anatolian Fault System: Thoughts on its Development. Bulletin of the Mineral Research and Exploration 78, 33–39.
5. Bachmanov D.M., Kozhurin A.I., Trifonov V.G., 2017. The Active Faults of Eurasia Database. Geodynamics & Tectonophysics 8 (4), 711–736 (in Russian). https://doi.org/10.5800/GT-2017-8-4-0314.
6. Barka A.A., Kadinsky-Cade K., 1988. Strike-Slip Fault Geometry in Turkey and Its Influence on Earthquake Activity. Tectonophysics 7 (3), 663–684. https://doi.org/10.1029/TC007i003p00663.
7. Berberian M., King G.C.P., 1981. Towards a Paleogeography and Tectonic Evolution of Iran. Canadian Journal of Earth Sciences 18 (2), 210–265. https://doi.org/10.1139/e81-019.
8. Bommer J., Spence R., Erdik M., Tabuchi S., Aydinoglu N., Booth E., del Re D., Peterken O., 2002. Development of an Earthquake Loss Model for Turkish Catastrophe Insurance. Journal of Seismology 6, 431–446. https://doi.org/10.1023/A:1020095711419.
9. Bozkurt E., 2001. Neotectonics of Turkey – A Synthesis. Geodynamica Acta 14 (1–3), 3–30. https://doi.org/10.1080/09853111.2001.11432432.
10. B.U. KOERI-RTMC Earthquake Catalog, 2023. Available from: http://www.koeri.boun.edu.tr/sismo/2/moment-tensor-solutions (Last Accessed March 12, 2023).
11. Chelidze T., Vallianatos F., Telesca L. (Ed.), 2018. Complexity of Seismic Time Series: Measurement and Application. Elsevier, 548 p. https://doi.org/10.1016/C2016-0-04546-1.
12. Dewey J.F., Hempton M.R., Kidd W.S.F., Saroglu F., Sengör A.M.C., 1986. Shortening of Continental Lithosphere: The Neotectonics of Eastern Anatolia – A Young Collision Zone. Geological Society of London Special Publication19, 1–36. https://doi.org/10.1144/GSL.SP.1986.019.01.01.
13. Duman T.Y., Emre Ö., 2013. The East Anatolian Fault: Geometry, Segmentation and Jog Characteristics. Geological Society of London Special Publication372, 495–529. https://doi.org/10.1144/SP372.14.
14. Emre Ö., Duman T.Y., Özalp S., Elmaci H., Olgun Ş., Şaroğlu F., 2013. Active Fault Map of Turkey with an Explanatory Text. 1:1250000 Scale. General Directorate of Mineral Research and Exploration, Ankara, 89 p.
15. Erdik M., Kamer Y., Demircioglu M., Sesetyan K., 2012. 23 October 2011 Van (Turkey) Earthquake. Natural Hazards 64 (1), 651–665. https://doi.org/10.1007/s11069-012-0263-9.
16. Erdogan S., Sahin M., Tiryakioglu I., Gulal E., Telli A.K., 2009. GPS Velocity and Strain Rate Fields in Southwest Anatolia from Repeated GPS Measurements. Sensors 9 (3), 2017–2034. https://doi.org/10.3390/s90302017.
17. Global CMT Catalog, 2023. Available from: https://www.globalcmt.org/CMTsearch.html (Last Accessed March 12, 2023).
18. Gök R., Pasyanos M.E., Zor E., 2007. Lithospheric Structure of the Continent – Continent Collision Zone: Eastern Turkey. Geophysical Journal International 169 (3), 1079–1088. https://doi.org/10.1111/j.1365-246X.2006.03288.x.
19. Gunes O., 2015. Turkey’s Grand Challenge: Disaster- Proof Building Inventory within 20 Years. Case Studies in Construction Materials 2, 18–34. https://doi.org/10.1016/j.cscm.2014.12.003.
20. Gutenberg B., Richter C.F., 1944. Frequency of Earthquakes in California. Bulletin of the Seismological Society of America 34 (4), 185–188. https://doi.org/10.1785/BSSA0340040185.
21. Gülal E., Tiryakioglu I., Erdogan S., Aykut N.O., Baybura T., Akpinar B., Telli A.K., Ata E. et al., 2013. Tectonic Activity Inferred from Velocity Field of GNSS Measurements in Southwest of Turkey. Acta Geodaetica et Geophysica 48, 109–121. https://doi.org/10.1007/s40328-012-0005-1.
22. Hempton M.R., 1985. Structure and Deformation History of the Bitlis Suture near Lake Hazar, Southeastern Turkey. GSA Bulletin 96 (2), 233–243. https://doi.org/10.1130/0016-7606(1985)96%3C233:SADHOT%3E2.0.CO;2.
23. Hempton M.R., 1987. Constraints on Arabian Plate Motion and Extensional History of the Red Sea. Tectonics 6 (6), 687–705. https://doi.org/10.1029/TC006i006p00687.
24. Hempton M.R., Dewey J.F., Saroglu F., 1981. The East Anatolian Transform Fault: Along Strike Variations in Geometry and Behavior. EOS Transactions American Geophysical Union 62, 393.
25. Herece E., 2008. Dogu Anadolu Fay (DAF) Atlas, General Directorate of Mineral Research and Exploration. Special Publications 13, 359.
26. Işik E., Ekinci Yu.L., Sayil N., Büyüksaraç A., Aydin M.C., 2021. Time-Dependent Model for Earthquake Occurrence and Effects of Design Spectra on Structural Performance: A Case Study from the North Anatolian Fault Zone. Turkish Journal of Earth Sciences 30 (2), 215–234. https://doi.org/10.3906/yer-2004-20.
27. Jackson J., McKenzie D.P., 1984. Active Tectonics of the Alpine-Himalayan Belt between Western Turkey and Pakistan. Geophysical Journal International 77 (1), 185–264. https://doi.org/10.1111/j.1365-246X.1984.tb01931.x.
28. Jackson J.A., McKenzie D.P., 1988. Rates of Active Deformation in the Aegean Sea and Surrounding Regions. Basin Research 1 (3), 121–128. https://doi.org/10.1111/j.1365-2117.1988.tb00009.x.
29. Jaffey N., Robertson A.H.F., 2001. New Sedimentological and Structural Data from the Ecemis Fault Zone, Southern Turkey: Implications for Its Timing and Offset and the Cenozoic Tectonic Escape of Anatolia. Journal of the Geological Society 158 (2), 367–378. https://doi.org/10.1144/jgs.158.2.367.
30. List of Earthquakes in Turkey, 2023. Wikipedia. URL: https://en.wikipedia.org/wiki/List_of_earthquakes_in_Turkey (Last Accessed April 3, 2023).
31. Lukk A.A., Shevchenko V.I., 2019. Seismicity, Tectonics, and GPS Geodynamics of the Caucasus. Izvestiya, Physics of the Solid Earth 55, 626–648. https://doi.org/10.1134/S1069351319040062.
32. Lukk A.A., Shevchenko V.I., Leonova V.G., 2015. Autonomous Geodynamics of the Pamir–Tien Shan Junction Zone from Seismology Data. Izvestiya, Physics of the Solid Earth 51, 859–877. https://doi.org/10.1134/S1069351315040060.
33. Lukk A.A., Yunga S.L., 1979. Seismotectonic Deformation of the Garm Region. Bulletin of the USSR Academy of Sciences. Physics of the Earth 10, 24–43 (in Russian)
34. Lybéris N., Yürür T., Chorowicz J., Kasapoglu E., Gündogdu N., 1992. The East Anatolian Fault: An Oblique Collisional Belt. Tectonophysics 204 (1–2), 1–15. https://doi.org/10.1016/0040-1951(92)90265-8.
35. McKenzie D.P., 1972. Active Tectonics of the Mediterranean Region. Geophysical Journal International 30 (2), 109–185. https://doi.org/10.1111/j.1365-246X.1972.tb02351.x.
36. Philip H., Cisternas A., Gvishiani A., Gorshkov A., 1989. The Caucasus: An Actualexample of the Initial Stages of a Continental Collision. Tectonophysics 161 (1–2), 1–21. https://doi.org/10.1016/0040-1951(89)90297-7.
37. Posadas A., Sotolongo-Costa O., 2023. Non-Extensive Entropy and Fragment–Asperity Interactionmodel for Earthquakes. Communications in Nonlinear Science and Numerical Simulation 117, 106906. https://doi.org/10.1016/j.cnsns.2022.106906.
38. Reilinger R.E., McClusky S., Oral M.B., King W., Toksöz M.N., 1997. Global Positioning, System Measurements of Present-Day Crustal Movements in the Arabian–Africa–Eurasia Plate Collision Zone. Journal of Geophysical Research: Solid Earth 102 (В5), 9983–9999. https://doi.org/10.1029/96JB03736.
39. Riznichenko Yu.V., 1985. Problems of Seismology. Nauka, Moscow, 408 p. (in Russian) [Ризниченко Ю.В. Проблемы сейсмологии. М.: Наука, 1985. 408 с.].
40. Robertson A.H.F., 2000. Mesozoic-Tertiary Tectonic Sedimentary Evolution of a South Tethyan Oceanic Basin and Its Margins in Southern Turkey. In: E. Bozkurt, J.A. Winchester, J.D.A. Piper (Eds), Tectonics and Magmatism in Turkey and the Surrounding Area. Geological Society of London Special Publication173, p. 97–138. https://doi.org/10.1144/gsl.sp.2000.173.01.05.
41. Sandvol E., Turkelli N., Barazangi M., 2003. The Eastern Turkey Seismic Experiment: The Study of a Young Continent–Continent Collision. Geophysical Research Letters 30 (24), 8038. https://doi.org/10.1029/2003GL018912.
42. Saroglu F., Emre Ö., Kus C.I., 1992. The East Anatolian Fault of Turkey. Annales Tectonicae 6, 125–199.
43. Sengör A., Görü N., Saroglu F., 1985. Strike-Slip Faulting and Related Basin Formation in Zones of Tectonic Escape: Turkey as a Case Study. In: K. Biddle, N. Christie-Blick (Eds), Strike-Slip Deformation, Basin Formation and Sedimentation. Vol. 37. SEPM Special Publication, p. 227–264. https://doi.org/10.2110/pec.85.37.0211.
44. Sengör A.M.C., Kidd W.S.F., 1979. Post-Collisional Tectonics of the Turkish-Iranian Plateau and a Comparison with Tibet. Tectonophysics. 55 (3–4), 361–376. https://doi.org/10.1016/0040-1951(79)90184-7.
45. Silva R., Franca G.S., Vilar C.S., Alcanis J.S., 2006. Nonextensive Models for Earthquakes. Physical Review E 73 (2), 026102. https://doi.org/10.1103/PhysRevE.73.026102.
46. Sobolev G.A., Zavyalov A.D., 1980. On Concentration Criterion for Seismogenic Ruptures. Doklady of the USSR Academy of Sciences 252 (1), 69–71 (in Russian)
47. Sotolongo-Costa O., Posadas A., 2004. Fragment-Asperity Interaction Model for Earthquakes. Physical Review Letters 92 (4), 048501. https://doi.org/10.1103/PhysRevLett.92.048501.
48. Taymaz T., Jackson J., McKenzie D.P., 1991. Active Tectonics of the North and Central Aegean Sea. Geophysical Journal International 106 (2), 433–490. https://doi.org/10.1111/j.1365-246X.1991.tb03906.x.
49. Telesca L., Chen C.-C., 2010. Nonextensive Analysis of Crustal Seismicity in Taiwan. Natural Hazards and Earth System Science 10 (6), 1293–1297. https://doi.org/10.5194/nhess-10-1293-2010.
50. Tsallis C., 1988. Possible Generalization of Boltzmann-Gibbs Statistics. Journal of Statistical Physics 52, 479–487. https://doi.org/10.1007/bf01016429.
51. USGS Search Earthquake Catalog, 2023. Available from: https://earthquake.usgs.gov/earthquakes/search/ (Last Accessed March 01, 2023).
52. Vallianatos F., Michas G., Papadakis G., 2014. Non-Extensive and Natural Time Analysis of Seismicity before the Mw 6.4, October 12, 2013 Earthquake in the South West Segment of the Hellenic Arc. Physica A: Statistical Mechanics and its Applications 414 (15), 163–173. https://doi.org/10.1016/j.physa.2014.07.038.
53. Westaway R., 1994. Present-Day Kinematics of the Middle East and Eastern Mediterranean. Journal of Geophysical Research: Solid Earth 99 (В6), 12071–12090. https://doi.org/10.1029/94JB00335.
54. Westaway R., Arger J., 1996. The Gölbas Basin, Southeastern Turkey: A Complex Discontinuity in a Major Strike-Slip Fault Zone. Journal of the Geological Society 153 (5), 729–743. https://doi.org/10.1144/gsjgs.153.5.0729.
55. Westaway R., Arger J., 2001. Kinematics of the Malatya-Ovacik Fault Zone. Geodinamica Acta 14 (1–3), 103–131. https://doi.org/10.1080/09853111.2001.11432438.
56. Yunga S.L., 1990. Methods and Results of Seismotectonic Deformation Studies. Nauka, Moscow, 191 p. (in Russian)
57. Yunga S.L., 1997. On the Classification of Seismic Moment Tensors on the Basis of Their Isometric Mapping onto a Sphere. Doklady Earth Sciences 352 (2), 253–255 (in Russian)
58. Yürür M.T., Chorowicz J., 1998. Recent Volcanism, Tectonics and Plate Kinematics near the Junction of the African, Arabian and Anatolian Plates in the Eastern Mediterranean. Journal of Volcanology and Geothermal Research 85 (1–4), 1–15. https://doi.org/10.1016/S0377-0273(98)00046-8.
59. Zavyalov A.D., 2006. Medium-Term Earthquake Forecast: Basics, Methodology, Implementation. Nauka, Moscow, 242 p. (in Russian)
60. Zor E., Sandvol E., Gürbüz C., Türkelli N., Seber D., Barazangi M., 2003. The Crustal Structure of the East Anatolian Plateau (Turkey) from Receiver Functions. Geophysical Research Letters 30 (24), 8044. https://doi.org/10.1029/2003GL018192.
10-1 Bolshaya Gruzinskaya St, Moscow 123242
Sycheva N.А. SEISMICITY AND CRUSTAL SEISMOTECTONIC DEFORMATIONS OF THE ANATOLIAN PLATE (TURKEY). Geodynamics & Tectonophysics. 2024;15(1):0743. https://doi.org/10.5800/GT-2024-15-1-0743. EDN: YJRTTA


Editor-in-Chief
Sklyarov E.V.664033, Irkutsk, Lermontova St., 128,
IEC SB RAS Institute of the Earth's crust
E-mail.: gt@crust.irk.ru
tel.: 8 3952 425422
Processing of personal data


