


Contents
Scroll to:
https://doi.org/10.5800/GT-2024-15-1-0735
EDN: IJXYVR
Scroll to:
Between 2010 and 2016, a series of 11 strong M>6 earthquakes occurred in New Zealand. In the area covering the epicentral zones of these seismic events, the spatiotemporal characteristics of movements and deformations of the Earth’s crust were obtained based on the processing of continuous satellite GPS observations at 64 points of the geodetic network. Using these data, we have studied the evolution of horizontal movements and deformations in order to reveal the possible relationship between the observed deformational and seismic processes. Analysis has been made on the total shear deformation, since the main tectonic structures of the region are faults with a shear mechanism of displacement of their sides. The presence of a giant mantle superplume in the area was the reason for the study of the behavior of horizontal dilatation deformation, and horizontal and vertical crustal motions. Based on the obtained digital deformation models, there were created kinematic visualizations, which are synoptic animations providing direct observations of the seismic deformation process and their heuristic analysis. The study revealed that a series of the strongest earthquakes may be interconnected by a long-term single deformation process, which is caused by the occurrence of an anomalous total shear deformation. The general maximum of shear deformation, dilatation deformation, and horizontal and vertical displacements are concentrated in the center of mantle superplume activity. Prior to strong seismic events, there occur zones of deficit (minimum) displacements of the Earth’s crust in the area of future epicenters, which is of research interest in terms of predicting their locations.
Kaftan V.I., Dokukin P.A., Manevich A.I., Tatarinov V.N., Shevchuk R.V. DEFORMATION INTERACTION OF STRONG EARTHQUAKES OF 2010–2016 IN THE ZONE OF INFLUENCE OF THE HIKURANGA SUPERPLUME (NEW ZEALAND) ACCORDING TO GPS OBSERVATIONS. Geodynamics & Tectonophysics. 2024;15(1):0735. https://doi.org/10.5800/GT-2024-15-1-0735. EDN: IJXYVR
The current century has seen an interesting event in evolution of the Earth’s seismic activity. Between 2010 and 2016, New Zealand experienced an unprecedented series of strong M>6 earthquakes, 11 of which occurred in the study area. Among those there were two strongest seismic events: the Kaikoura (M7.8, November 13, 2016) and Darfield (M7.1, September 03, 2010) earthquakes. It should be noted that the Kaikoura earthquake could rank as one of the mega-earthquakes in terms of magnitude on the qualitative Richter scale. Many earthquakes with M6 and higher magnitudes were induced by the strongest events. i.e. they were their aftershocks. The most notable recent seismic events were the Cook Strait earthquakes (M6.5, July-August 2013), as their epicentral zones after the strongest Kaikoura earthquake (2016) were exposed to displacements several times greater than their own coseismic displacements of 2013. Particularly important are two unexpected events: the M6.1 earthquake of April 24, 2015, preceding the Kaikoura earthquake and located on the Clarence fault, obviously unrelated to the seismic rupture of this strongest earthquake, and the earthquake of January 20, 2014, most (about 100 km) distant from the main event but located on the same fault to which the strongest earthquakes in the Cook Strait are confined. This may indicate a common genetic link between these events. In the period from 2008 to 2021, there occurred more than eight tens of earthquakes with 6≥M≥5.
Historical studies of seismic and geodynamic activity have mainly focused on three disparate series of strongest events. These are studies of crustal motions around the strongest Kaikoura earthquake (M7.8) [Shi et al., 2019; Wang et al., 2018; Ulrich et al., 2019], in connection with the 2010–2011 Canterbury earthquake series [Kaiser et al., 2012; Toraldo Serra et al., 2013; Ristau, 2010; Beavan et al., 2012], in the area of a series of strong events in the Cook Strait, July – August 2013 [Hamling et al., 2014]. The postseismic motions and deformations due to the Kaikoura earthquake are studied in detail in [Jiang et al., 2018].
The major objective of the present research was to study the evolution of crustal deformations in the area more extensive than that in other studies, covering the epicentral zones of all the above-mentioned strongest seismic events over a longer time interval to reveal a possible interrelation between the observed deformation processes.
A fragment of 64 points from New Zealand’s permanent GPS network was used to determine crustal movements and deformations (Fig. 1). The network is the result of collaboration between three state agencies: the Seismological Commission https://www.eqc.govt.nz/about-eqc/), the Institute of Geology and Nuclear Physics (https://www.gns.cri.nz/about-us/), and the Land Agency (https://www.linz.govt.nz/about-us). Continuously operating GPS stations function as part of the GeoNet complex network for geophysical observations. Observational data and metadata are available to users free of charge [GNS Science, 2019].
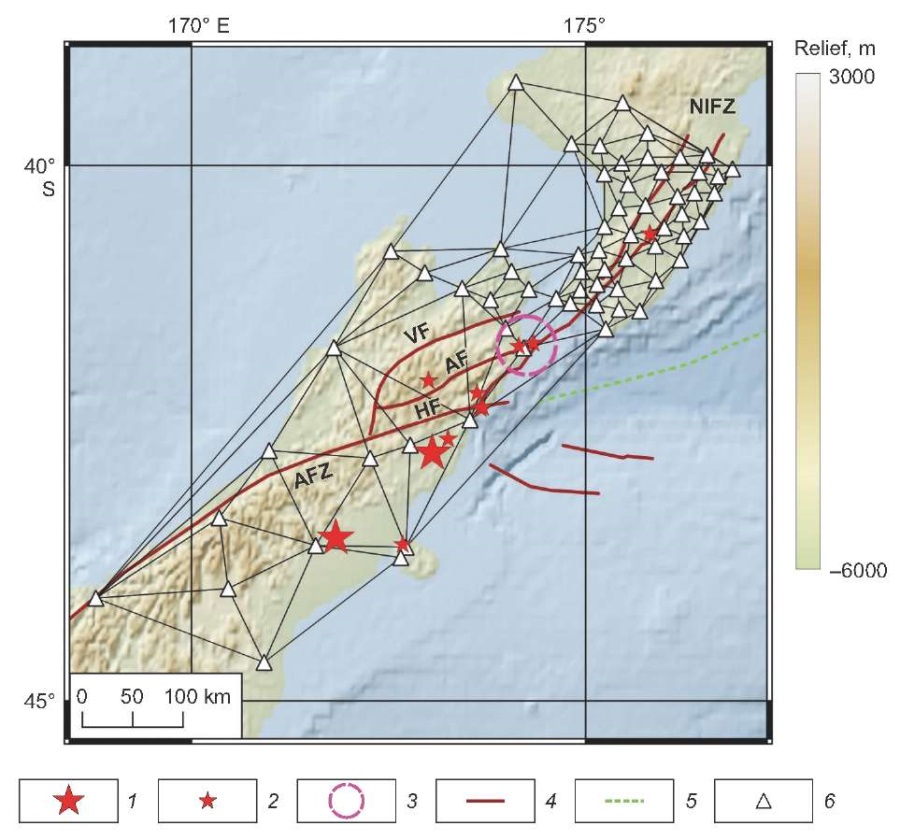
Fig. 1. GPS network used for analysis.
1 – strongest M>7 earthquakes;
2 – 7>M>6 earthquakes;
3 – Kaikoura triple junction zone (KTJ) [Shi et al., 2019];
4 – axial lines of the most significant fault zones;
5 – ocean trench of the Hikurangi subduction zone;
6 – sites of observation network. AFZ – Alpine fault zone, HF – Hopé fault,
AF – Avatere fault, VF – Wairau fault, NIFZ – North Island fault zone.
The Delaunay triangulation triangles were used to compute the horizontal deformations of the finite elements. Time series of daily point coordinate determinations were obtained from the Nevada Geodetic Laboratory archive [Blewitt et al., 2018].
The initial and final epochs of measurements are 01.01.2008 and 06.25.2021, respectively. The total number of days for determining the coordinates of points and deformation fields is 4925.
It should be noted that the network of continuous GNSS measurements is very heterogeneous in the density of observation points (Fig. 1). The North Island has a significantly larger number of those than the South Island. This circumstance reduces the spatial resolution of the motion and deformation fields for the South Island area.
The database from [Langridge et al., 2016] was used to determine the positions of the main fault zones.
Tectonically, the region is very interesting and unusual. The subduction zone, therein represented by the Hikurangi Trench, is connected with continental shear-type faults – the South Island Alpine fault (SIF) and its extension in the North Island fault system (NIFS). This area represents the Hikurangi triple junction (Fig. 2). The HF, AF and VF faults form the Marlborough fault system. The main source of tectonic movements therein is the convergence of the Pacific and Australian plates, causing subduction in the North Island area. The oceanic lithosphere of the Pacific Ocean is steeply dipping below the continental Australian plate at a very high rate of about 41 mm/yr. This area records the transition from the process of subduction to the mechanism of right-lateral shear along the strike of the axial zone of the tectonic plate boundary at a rate of about 37 mm/yr, as represented by the South Island Alpine fault and the North Island fault system. A series of sub-parallel faults in the north of the South Island represents the Marlborough fault zone extending into the Cook Strait waters, the tectonic characteristics of which demonstrate the transition from subduction to shear. The Kaikoura triple junction zone marks the southern end of the oceanic plateau, which, as suggested in [Shi et al., 2019], is migrating southward. This region represents the southern corner of the Hikurangi oceanic plateau, which is shifting southward and covering the recently discovered giant Hikurangi mantle superplume [Stern et al., 2020]. The latter circumstance suggests the local presence of a vertically ascending mantle flow that forms radial mantle subcrustal currents from the center to the periphery of the plume region. The thickness of the oceanic crust therein is estimated to 10 km [Shi et al., 2019].
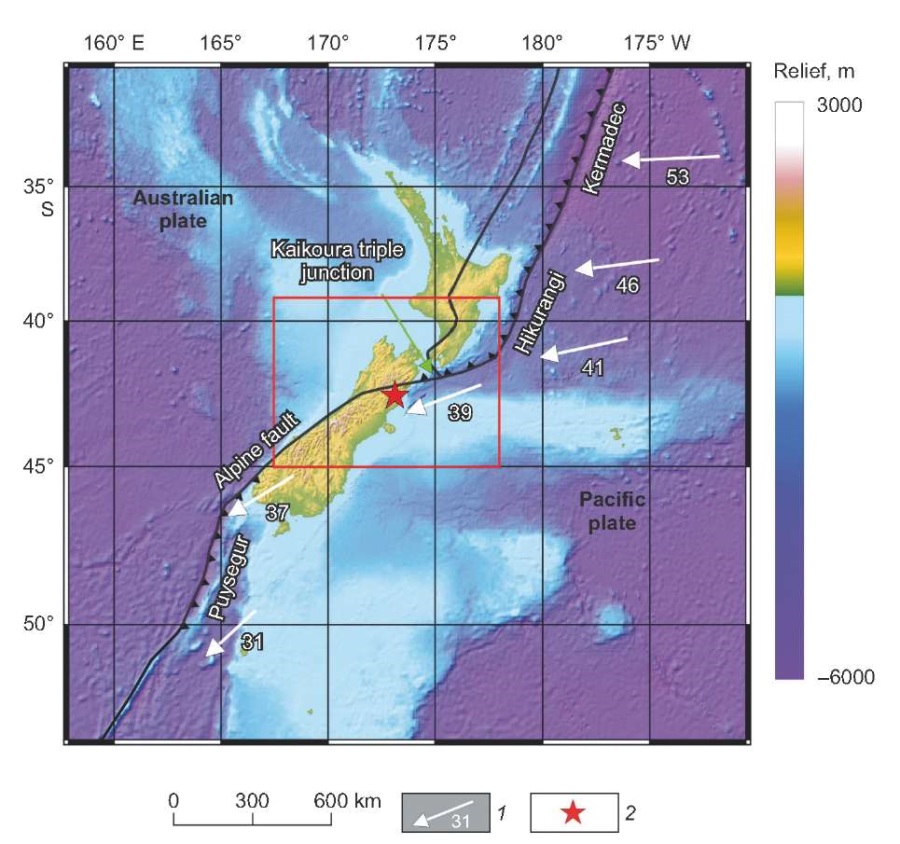
Fig. 2. Tectonic conditions in the Kaikoura triple junction zone.
1 – directions of horizontal plate motions;
2 – epicenter of the strongest Kaikoura earthquake.
The nature of tectonic interactions in the study region is summarized in [Shi et al., 2019]. The main elements of fault tectonics are shown in Fig. 2. It is important that the evolution of the present-day movements and deformations of the Earth’s surface in this region reflects its tectonic specificities.
Information on seismic activity of the region between 2008 and 2021 was obtained from the National Earthquake Information Center (NEIC) web resource (https://www.usgs.gov/programs/earthquake-hazards/national-earthquake-information-center-neic). The strongest earthquakes during the above-mentioned interval are presented in Table 1.
Table 1. The strongest earthquakes between 2010 and 2016
|
Earthquake name |
Date |
Time |
Geographic coordinates |
Depth (km) |
Мw |
|
|
Latitude |
Longitude |
|||||
|
Darfield |
03.09.2010 |
16:35:47.770 |
–43.5220 |
171.8300 |
12 |
7.1 |
|
Christchurch |
21.02.2011 |
23:51:42.350 |
–43.5830 |
172.6800 |
5.9 |
6.1 |
|
Seddon |
21.07.2013 |
05:09:31.450 |
–41.7040 |
174.3370 |
17 |
6.5 |
|
16.08.2013 |
02:31:05.750 |
–41.7340 |
174.1520 |
8.2 |
6.5 |
|
|
Eketāhuna |
20.01.2014 |
02:52:44.350 |
–40.6595 |
175.8144 |
28 |
6.1 |
|
24.04.2015 |
03:36:42.400 |
–42.0602 |
173.0066 |
48 |
6.1 |
|
|
Kaikoura |
13.11.2016 |
11:02:56.340 |
–42.7373 |
173.0540 |
15.11 |
7.8 |
|
13.11.2016 |
11:32:06.540 |
–42.3205 |
173.6694 |
10 |
6.5 |
|
|
13.11. 2016 |
11:52:45.010 |
–42.1762 |
173.6227 |
13.99 |
6.1 |
|
|
13.11.2016 |
13:31:25.660 |
–42.3093 |
173.6961 |
2.09 |
6.2 |
|
|
14.11.2016 |
00:34:22.610 |
–42.6058 |
173.2543 |
9 |
6.5 |
|
Today there are about twenty thousand permanent GNSS stations whose observations last for tens of years. Time series of precise (centimeter accuracy) coordinates of observation points derived from daily continuous observations are publicly available [Blewitt et al., 2018]. The time series coordinates of GNSS points are obtained by the Precise Point Positioning (PPP) strategy using high-precision products of the International GNSS Service with the ITRF 2014 global geodetic framework.
The changes in plan coordinates un and ue (n and e are north and east axes) were used to calculate the components of the horizontal deformation tensor:
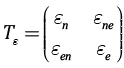 , whose elements are
  ,
,  and
and 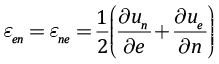 , where
 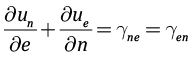 is a relative shear.
The strain tensor elements are partial derivatives of displacements un and ue along the coordinate axes n and e.
Due to the fact that observation networks and epicenters of strong earthquakes were located near active plate boundaries dominated by shearing along the earthquake-generating faults which extend up to the Earth’s surface, calculations and analysis were made on the total shear deformations 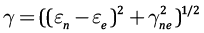 . The presence of a giant superplume in this region prompted the authors to study also the behavior of vertical crustal motions and dilatation deformation
 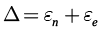 . The deformation components were calculated according to the method described in [Wu et al., 2006].
Calculation and analysis were made on the so-called "inner" displacements of the Earth’s surface [Gvishiani et al., 2022], corresponding, in terms of classical mechanics, to internal forces independent of external forces.
The accumulated horizontal displacements Un and Ue were calculated with respect to the initial measurement epoch i=0 as the difference in coordinates n and e in each horizontal axis:
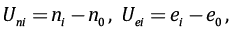
where i is the current epoch of measurements (ordinal number of days from the beginning of observations). The inner displacements accumulated from the initial epoch were calculated by the formula:
where  are the average values of displacements along the rectangular coordinate axes for each day, j is the ordinal number of the GPS observation point.
Digital spatial models of accumulated horizontal deformations and crustal movements were obtained for each day with reference to the initial epoch 01.01.2008. Technical breaks in observations were eliminated by interpolation with Hermite splines. Spatial interpolation of movements and deformations on a regular grid was also performed using Hermite splines.
The obtained digital models were used to create everyday graphic images. They represented the images combined into a single synoptic animation of the seismodeformation process. Epicenters of earthquakes of magnitude M>3 were also displayed on the images according to the time of their occurrence. Catalog of seismic events was obtained from the NEIC database.
The obtained kinematic data visualizations provided direct observations of the seismic deformation process and their heuristic analysis. The corresponding video animations are available on the Earth Science Database, Geophysical Center RAS scientific information resource (http://esdb.wdcb.ru/). Direct links to the location of the synoptic animations are given below in the relevant sections of the paper.
We shall consider the sequence of key images of the constructed synoptic animation [Dokukin et al., 2023a] for the evolution of total shear deformation (Fig. 3). The first image (Fig. 3, a) shows the development of an anomalous zone of the total shear deformation for about 3 years since the beginning of the recording start precisely in the area of occurrence of the forthcoming strong Darfield earthquake (Fig. 3, b). Its magnitude reaches 2·10–6, which is an order of magnitude higher than the accuracy of determination of strain 10–7. About 3 months later, a series of moderate and strong aftershocks (Мw=5.9–6.2) occurred in the Pegasus Bay on the continuation of an active fault, near which the strongest Darfield earthquake Мw=7.1 happened. In conjunction with the Darfield earthquake, this sequence of seismic events is called the Canterbury series (Fig. 3, b). It is noteworthy that the anomaly of total shear deformation increased up to 10–5, which is typical for the level of coseismic deformations, and moved to the north, precisely in the triple junction of Kaikoura, which was affected by strong earthquakes occurred in the neighbouring Cook Strait and Gressmer Lake area in 2.5–3.0 years (Fig. 3, g). A pair of strongest earthquakes with M6.6 occurred in July – August 2013. These earthquakes are confined to the Marlborough fault zone, whose northern continuation is the North Island fault zone. Here, Because of the lack of significant shear deformation (Fig. 3, e), there occurred a strong earthquake with M6.1. No description of the event, distant from most of the strongest earthquakes, was found in scientific publications. It is notable that it did not lead to any appreciable coseismic horizontal displacements of the Earth’s surface. Its confinement to the fault zone, whose southern margin experienced a series of strong and moderate earthquakes, enables to attribute it to a general interconnected set of the strongest earthquakes of the period studied.
About two years later, on April 24, 2015, an earthquake with M6.1 occurred near the Awatere fault. A year and a half later, on November 13–14, 2016, the strongest Kaikoura earthquake (M7.8) and three strong aftershocks with M6.2–6.5 occurred in the area of total shear deformation of about 10–5 or more (Fig. 3, h). Two of them lie in the Kaikoura triple junction area near the Kaikoura Peninsula.
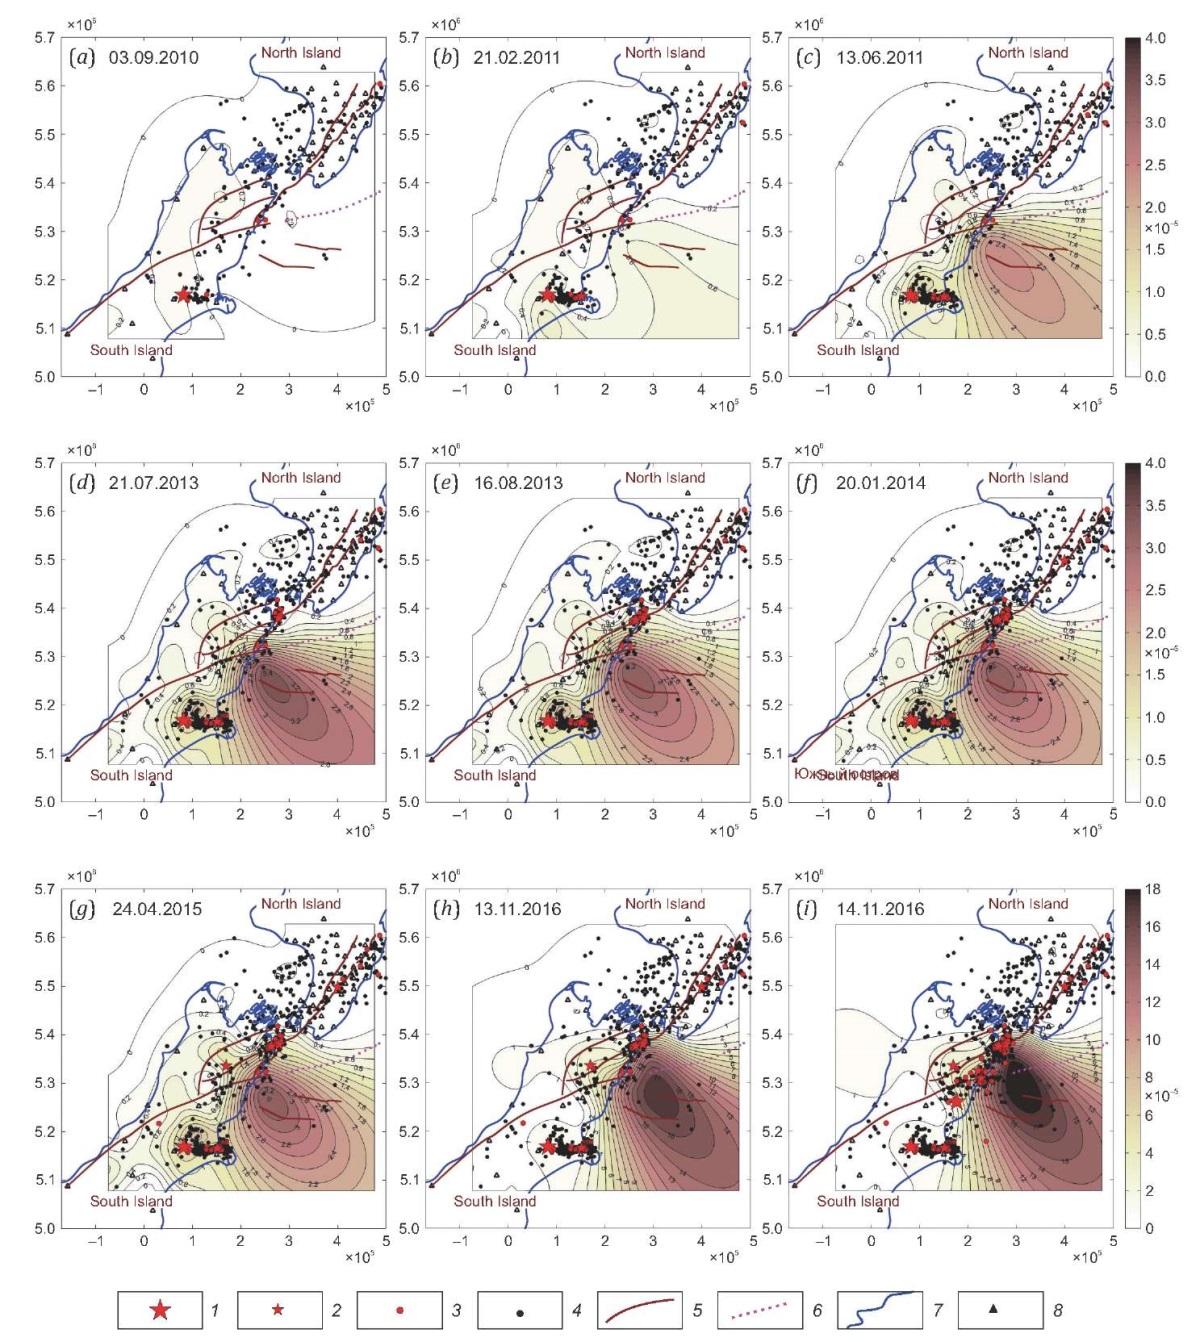
Fig. 3. Evolution of the total shear deformation in relation to seismic activity
in the area of strong New Zealand earthquakes in 2008–2021.
1 – epicenters of M>7; 2 – epicenters of 5.9<M<7;
3–4 – epicenters of 4.9<M<6 (3), 2.5< M<5 (4);
5 – axial lines of fracture zones; 6 – deep sea trench; 7 – coastline; 8 – GPS points.
In conjunction with multiple moderate events therein, they caused a total shear deformation of about 2·10–4. These events happened with delays of 30 min to 12 hours after the main shock at a distance of 16 to 30 km. At the same time, in the epicentral area of the Kaikoura earthquake, the deformation reached only 4·10–5, i.e., it was an order of magnitude less. This phenomenon is consistent with the provisions of the Yu.L. Rebetsky’s tectonophysical model of metastable state [Rebetsky, 2018], when intensity of the strongest movements in the sides of the extended seismic rupture increases relative to its initial level during the main shock.
Such a series of strong earthquakes in a limited area is an unprecedented event. The confinement of the events to the territory of the recently discovered mantle superplume, and the concentration of the maximum of shear coseismic deformation in this very place, suggests that the seismic process is caused by the shallow mantle viscosity layer and its upward flow with radial centripetal horizontal spreading [Shi et al., 2019].
High seismic activity in a limited area has caused an interest to the analysis of such precursors for the determination of the earthquake generation zone as the crustal inner displacement deficit. This characteristic, reflecting spatial dynamics of changes in the absolute values of GPS points displacements, has recently been studied in the Laboratory of Geodynamics GC RAS [Gvishiani et al., 2022]. Under the deficit of displacements, we mean the areas of their minimum values not exceeding or insignificantly exceeding their identification accuracy. As a rule, these are the areas of values of the inner displacement vector modulus not exceeding 0.02 m.
Areas of the crustal inner displacement deficit correlate with significant compaction of rocks due to high stresses in the Earth’s crust prior to strong seismic events. A series of strong earthquakes that occurred in New Zealand within the continuously operating GPS network stations provided an opportunity to identify such small inner displacement zones.
Accumulation of displacement deficit before the Darfield and Christchurch earthquakes in December 2010 and February – June 2011, respectively, (Canterbury region) is presented on the images of Fig. 4. The zones of displacement deficit in all images are further shown as dark brown areas. The first image (Fig. 4, a) shows an area of displacement deficit concentration, subsequently hit by the Darfield earthquake with M7.1 (Fig. 4, b). To be more exact, the earthquake coincided with the boundary of the minimal displacement area, which is consistent with other studies [Rebetsky, 2018; Guo et al., 2022], assuming that many strong earthquakes occur in zones of minimal displacements, or at the boundaries of transition therefrom to zones of relatively rapid displacements. At the same time, Rebetsky [Rebetsky, 2018] argues that the earthquakes, occurring in the areas of maximum elastic stress, are not the strongest. In our case, these are the areas of minimum inner displacements. It should be noted that this location of the future epicenter for the Darfield earthquake overlaps with the already "perceptible" anomaly of horizontal total shear deformation (see Fig. 3, a).
No slow inner displacements were recorded (Fig. 4, b) before the next strong event with M6.2 in the zone of its future epicenter (Fig. 4, d). This is precisely the zone near the Pegasus Bay in which the displacements have become more active since the strongest M7.1 Darfield earthquake (Fig. 4, b). This factor proves the assumption that earthquakes in this place are aftershocks of the Darfield earthquake, despite their approximately half a year delay in time. As in the case of the M7.8 Kaikoura earthquake, the maximum displacements are distant from the strongest event in the region. They also occur near the offshore area, which can be explained by the reduced level of friction on the rupture owing to the presence of fluid.
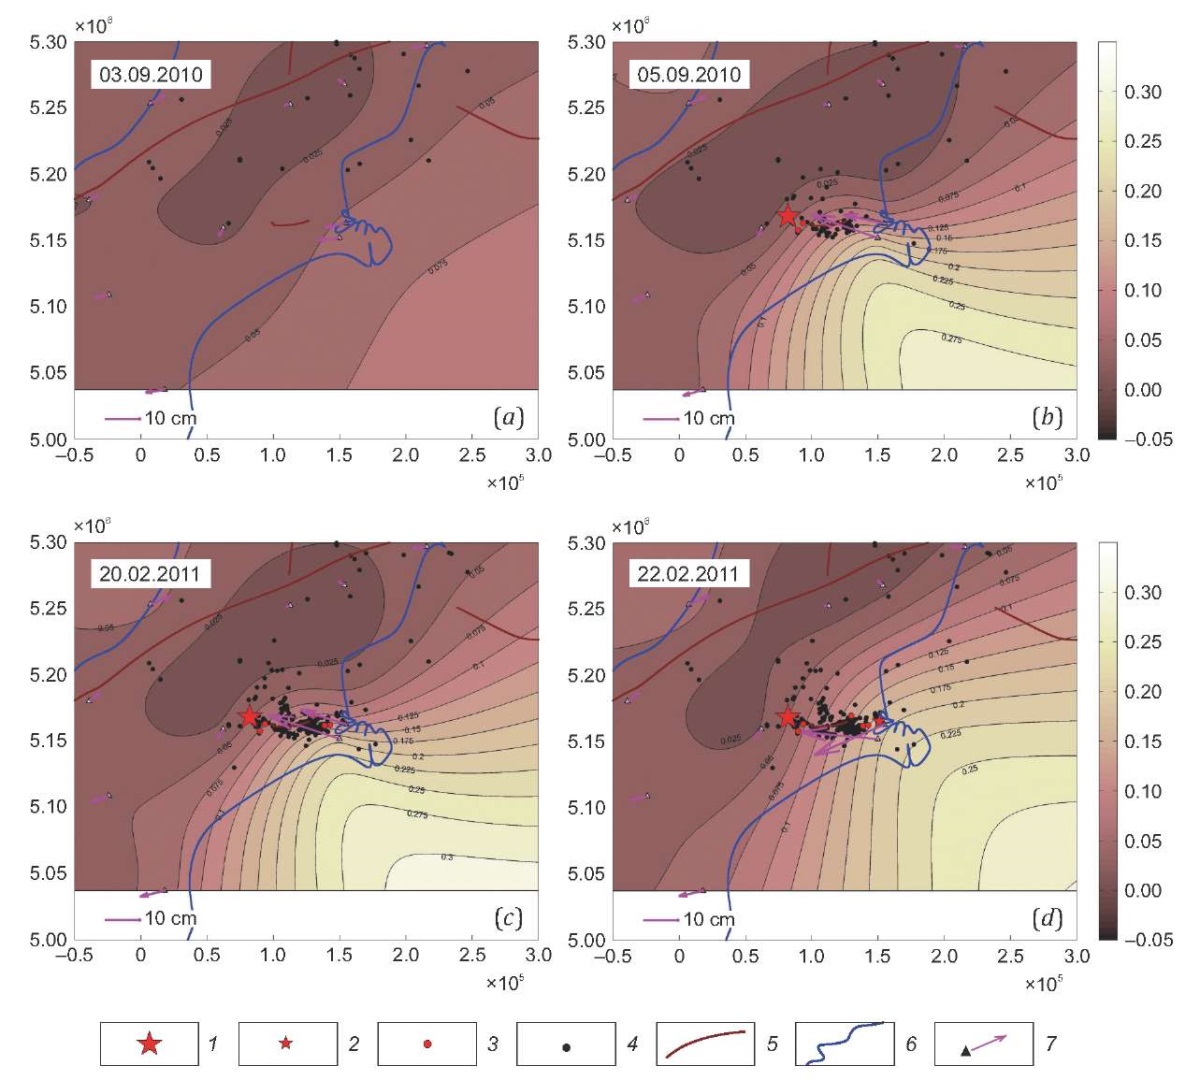
Fig. 4. Inner displacement deficit due to earthquakes in the Canterbury area.
See Fig. 3 for notations. Legends and scales to isolines are presented in meters.
The arrows show the displacements.
The next series of destructive earthquakes were strong M6.5 events and moderate aftershocks in the Cook Strait and Lake Grassmere area. The corresponding images of the intensity distribution of the accumulated pre-event inner displacements are presented in Fig. 5. The images in Fig. 5, a, b, show that the earthquakes originated on the southwest to northeast centerline of the minimum displacement area. Nevertheless, the accumulated displacements therein already reached 5 cm, which does not give sufficient grounds to refer this area to the zone of maximum displacement deficit, i.e., to the zone of highest stresses. Images of coseismic displacements (Fig. 5, c, d) after these events indicate that the earthquakes in their epicentral zones released the accumulated stresses and initiated displacements reaching 0.3 m, which is typical for earthquakes with M~6.
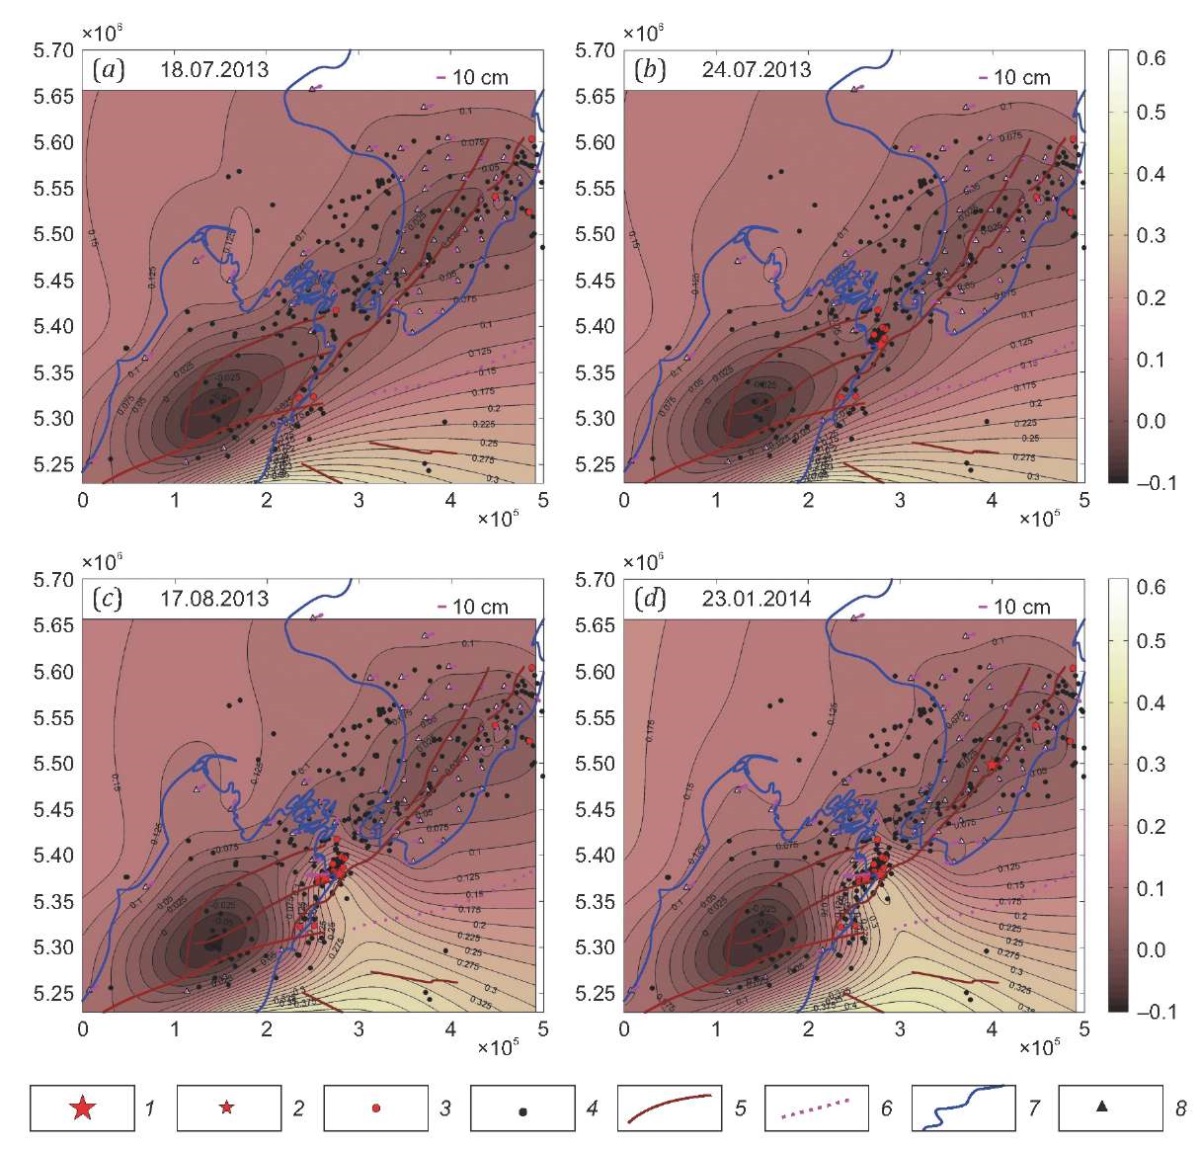
Fig. 5. Crustal inner displacement deficit due to earthquakes in the Cook Strait.
See Fig. 3 for notations. Legends and scales to isolines are presented in meters.
The arrows show the displacements.
Synoptic analysis of inner displacements before and after the strongest M7.8 Kaikoura earthquake with (note that events with magnitude M8 refer to mega-earthquakes on the qualitative Richter scale) is presented in Fig. 6. The presented images show that the earthquake occurred, as in the case of the Darfield event, on the isoline delineating the zone of minimum displacements filled with dark brown color. An interesting factor is that as a result of the strongest earthquake, the maximum coseismic displacements did not occur at the epicenter of the event but moved a distance of about 100 km northeastward towards the weakened zone, where strong events had previously occurred in the Cook Strait and near Lake Grassmere (Fig. 6, d, large purple arrows).
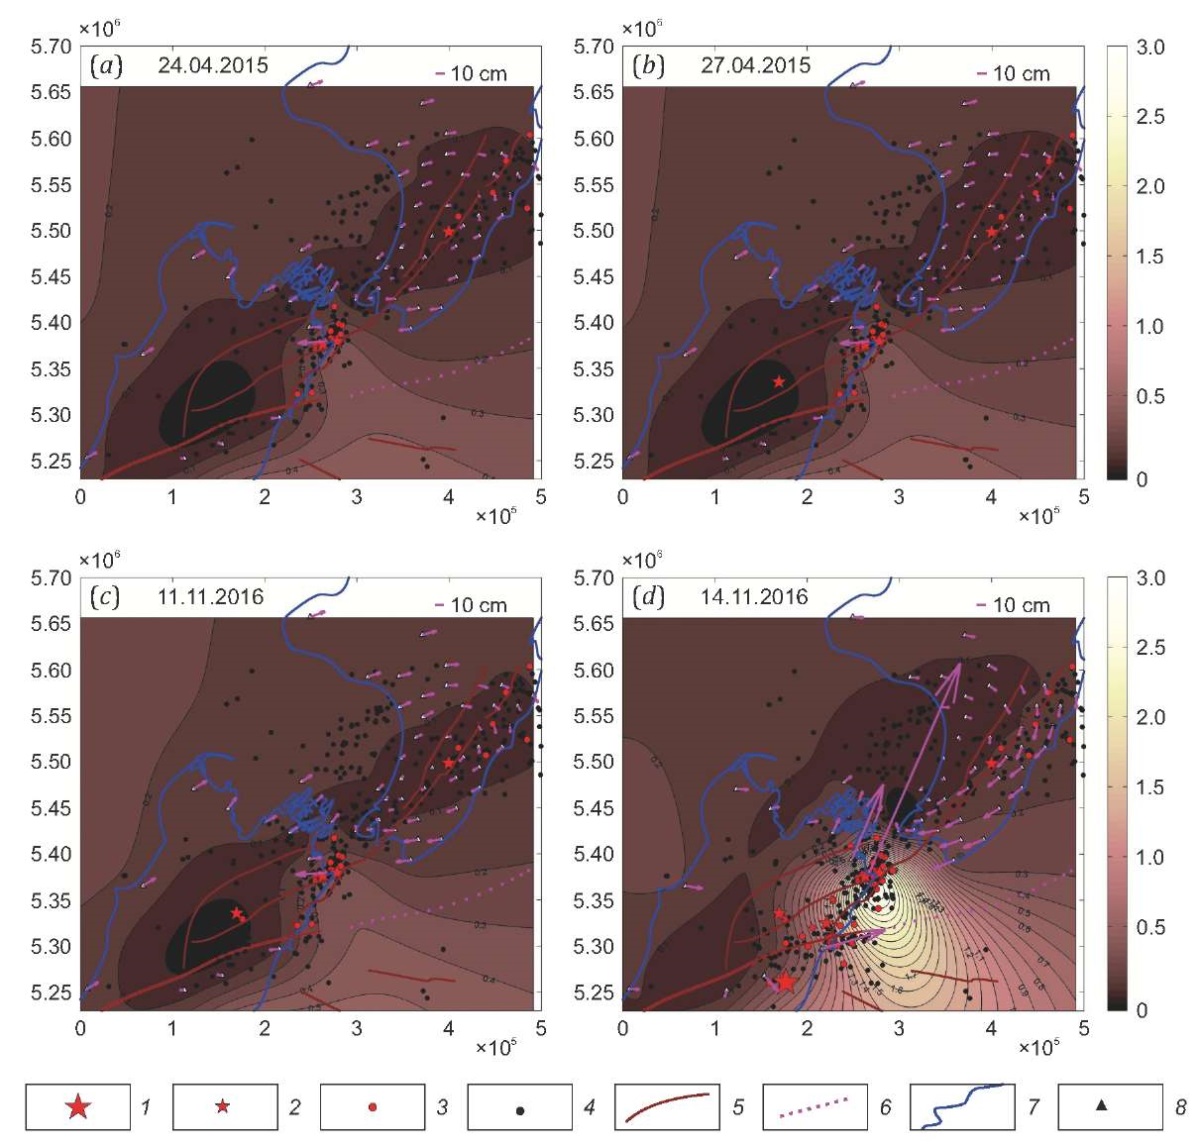
Fig. 6. Inner displacement deficit due to the Kaikoura earthquake.
See Fig. 3 for notations. Legend and scales to isolines are presented in meters.
The arrows show the displacements.
It should be noted that the authors of the present study did not encounter such a situation when analyzing crustal motions and deformations associated with other strong crustal earthquakes. Usually, the maximum coseismic displacements occur directly in the epicenters of strong events with M>6. That is, the rupture comes to the surface and starts from the hypocenter region. Then, in the process of relaxation, it develops along the rupture. In the case of the Kaikoura earthquake, apparently, the rupturing started in a more weakened and already disturbed zone, as part of a complex set of coseismic ruptures, which has already been repeatedly discussed in scientific publications [Wang et al., 2018; Ulrich et al., 2019; Jiang et al., 2018]. That is, the maximum shaking did not coincide spatially with the maximum surface rupture. The rupture itself occurred in the Kaikoura triple junction zone and in the focus of influence of the mantle superplume. It can be assumed that the rupture began in the deep focal and epicentral zone but came up to the surface and increased at a considerable distance therefrom. This phenomenon requires a deeper and more complex study. Note that a similar situation occurred in the case of the M7.1 Darfield earthquake (see Fig. 4, b). Maximum coseismic displacements occurred at more than fifty km from the epicenter of the main event.
An interesting phenomenon requiring explanation is the vortex motion of the Northern Island, which occurred in the vectors of horizontal displacements of the GNSS stations (Fig. 6).
As shown in [Stern et al., 2020], the region of the Kaikoura triple junction hosts the central part of the giant superplume apex. It is assumed that this region is affected by the centrifugal spreading of subcrustal viscous masses from the center to the periphery and the sinking of the central part due to the plume collapse. This prompts some interest in analyzing vertical motions and dilatation deformation in this region. A synoptic animation of the dilatation evolution is presented in the repository [Dokukin et al., 2023b]. The key images of the synoptic animation are summarized in Fig. 7. Fig. 7, a, b, show the change in dilatation values related to the Darfield earthquake evolving eastward towards the aftershock region. The region of the main seismic events and their aftershocks is a region of compression. However, during the M6.1 Christchurch earthquake, about 100 km northeast of its epicenter, there formed a local maximum of extension about 30 km from the Kaikoura triple junction node. No strong seismic events occurred therein, but the point of maximum falls within the epicenter of a weak earthquake that occurred well before the formation of this extension zone (Fig. 7, c). This local maximum of dilatation increases relatively quickly (approximately threefold), and is accompanied by moderate 5<M<6 earthquakes at about 100 km to the northeast – towards the area of future strong earthquakes in the Cook Strait region, and to the southwest, towards the aftershock zone of the Christchurch earthquake (Fig. 7, d).
As strong earthquakes occur in the Cook Strait and Hersmer Lake area, the maximum extension increases and reaches the epicentral zone of these seismic events (Fig. 7, e, f). Meanwhile, the epicentral area itself undergoes compression. The next episode of rapid increase in the area and magnitude of the maximum of extension deformation (Fig. 7, g) is accompanied by the strong and deepest M6.1 earthquake on the Awatere – AF fault (see Fig. 1) and by a moderate event in the Pacific Ocean water area, practically in the center of the whole extension anomaly. The main event from the total set investigated – the Kaikoura earthquake – contributed to the intensive increase of extension maximum up to 2·10–4 (Fig. 7, h, j). This earthquake was accompanied by a series of powerful aftershocks, among which were several strong aftershocks with M>6. Thus, in the Kaikoura earthquake epicentral area lies the zero isoline of dilatation deformation, and the maximum tends to the Cook Strait. This is supposedly the place of location of the "head" of the Hikurangi superplume [Stern et al., 2020], where centrifugal motions and dome-shaped extension deformations can be considered as an ordinary phenomenon.
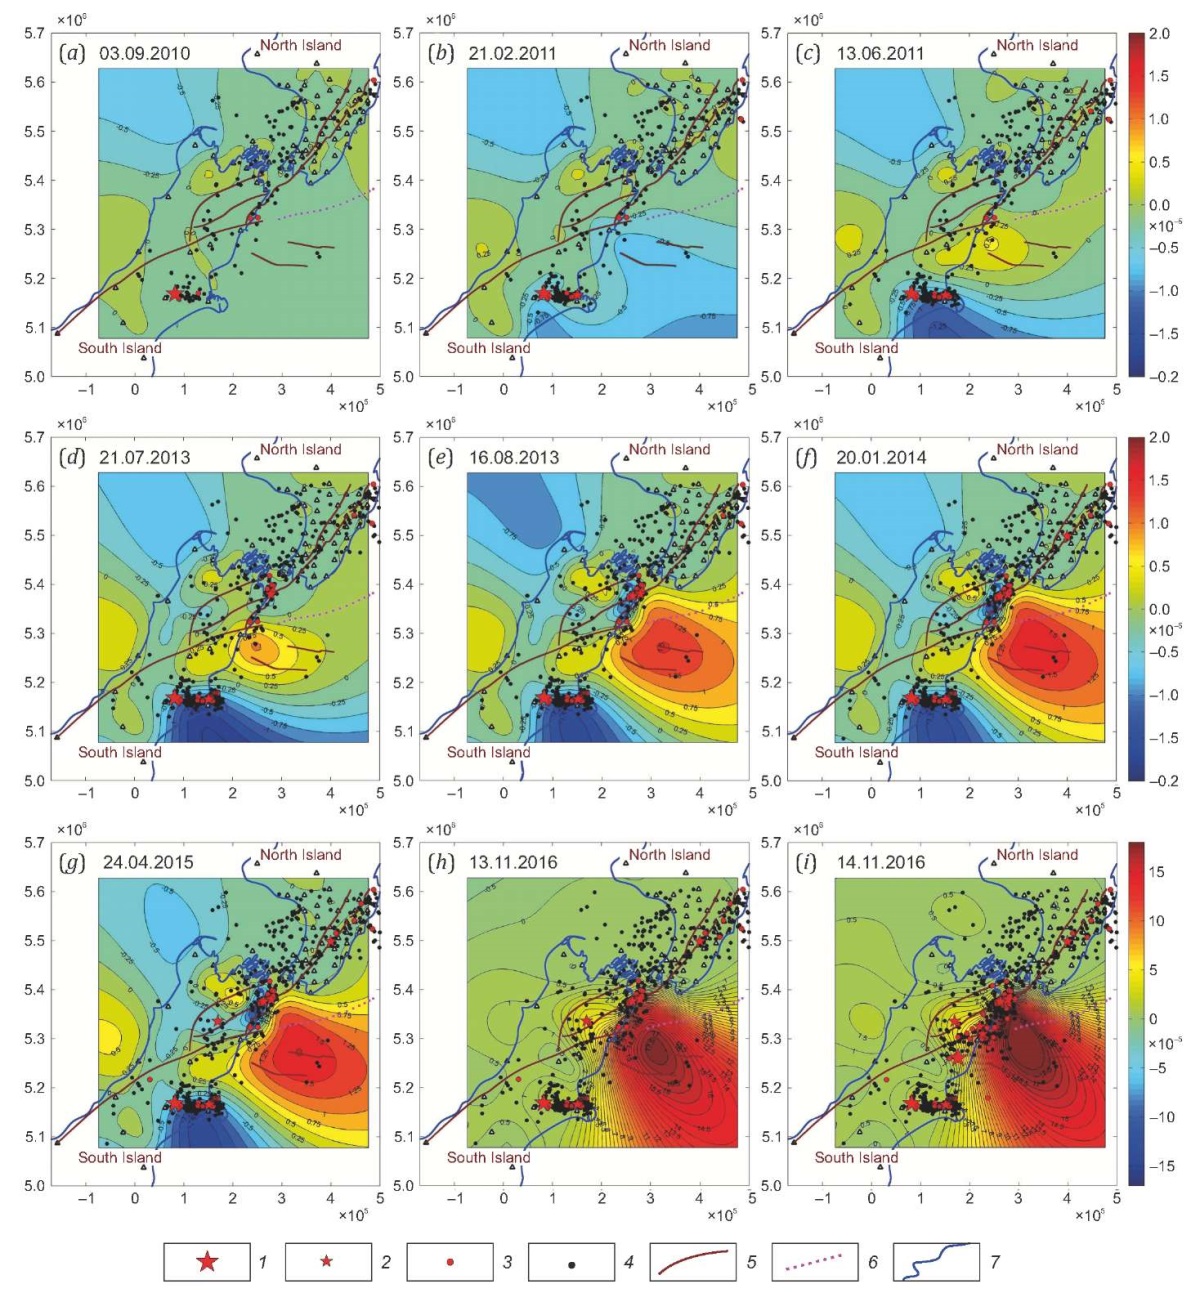
Fig. 7. Evolution of dilatation deformation due to 2008–2021 New Zealand earthquakes.
See Fig. 3 for notations.
The accumulated horizontal and vertical displacements of GPS-points were investigated to clarify the formation mechanism of intense tensile deformation. The nature of their changes is presented in the animation [Dokukin et al., 2023c], the images of which are shown in Fig. 8.
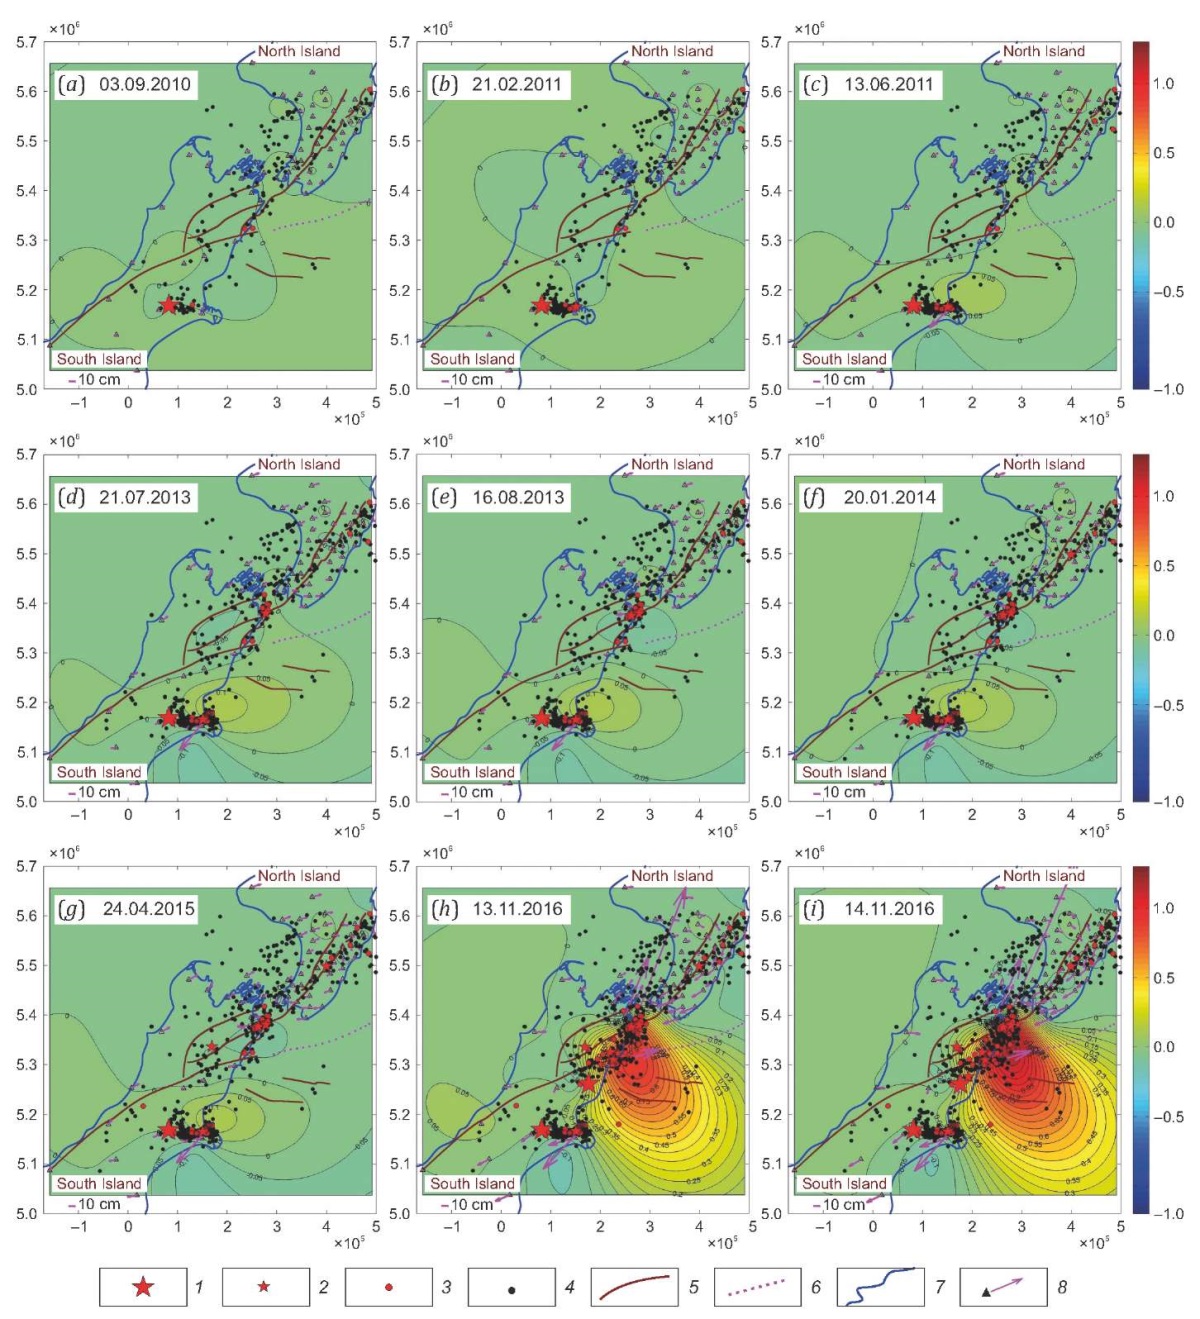
Fig. 8. Evolution of horizontal and vertical motions
due to 2008–2021 New Zealand earthquakes.
See Fig. 3 for notations. Legends and scales to isolines are presented in meters.
The arrows show the displacements.
A significant uplift of more than 5 cm occurred after the Christchurch earthquake (Fig. 8, c). Obviously, it does not fully coincide with the area of extension (see Fig. 7, c) but lies in relative proximity to it. It increases up to 10 cm but does not migrate to the northeast like the extension dilatation anomaly. Nevertheless, after the Kaikoura earthquake, this 1.24 m uplift coincides with the main extension anomaly. This fact supports the assumption that there are subcrustal forces directed upwards and laterally from the center of the "head" of the inferred mantle superplume, reflecting its role in the seismotectonic process.
Due to recently found geodetic evidence for coseismic rotation of a local crustal block as a consequence of the Kaikoura earthquake [Wang et al., 2020], we shall consider the nature of changes in the inner horizontal displacement vectors (Fig. 9). First, it is worth noting that the total length of the coseismic inner displacement vector was 2.75 m. The displacement occurred during the Kaikoura earthquake, more than 100 km away from its epicenter in the epicentral zone of a pair of previous strong Seddon earthquakes. The GPS point located near the epicenter of the Kaikoura earthquake was displaced by about 3 dm (Fig. 9). These estimates indicate rupture complexity in this seismotectonic situation.
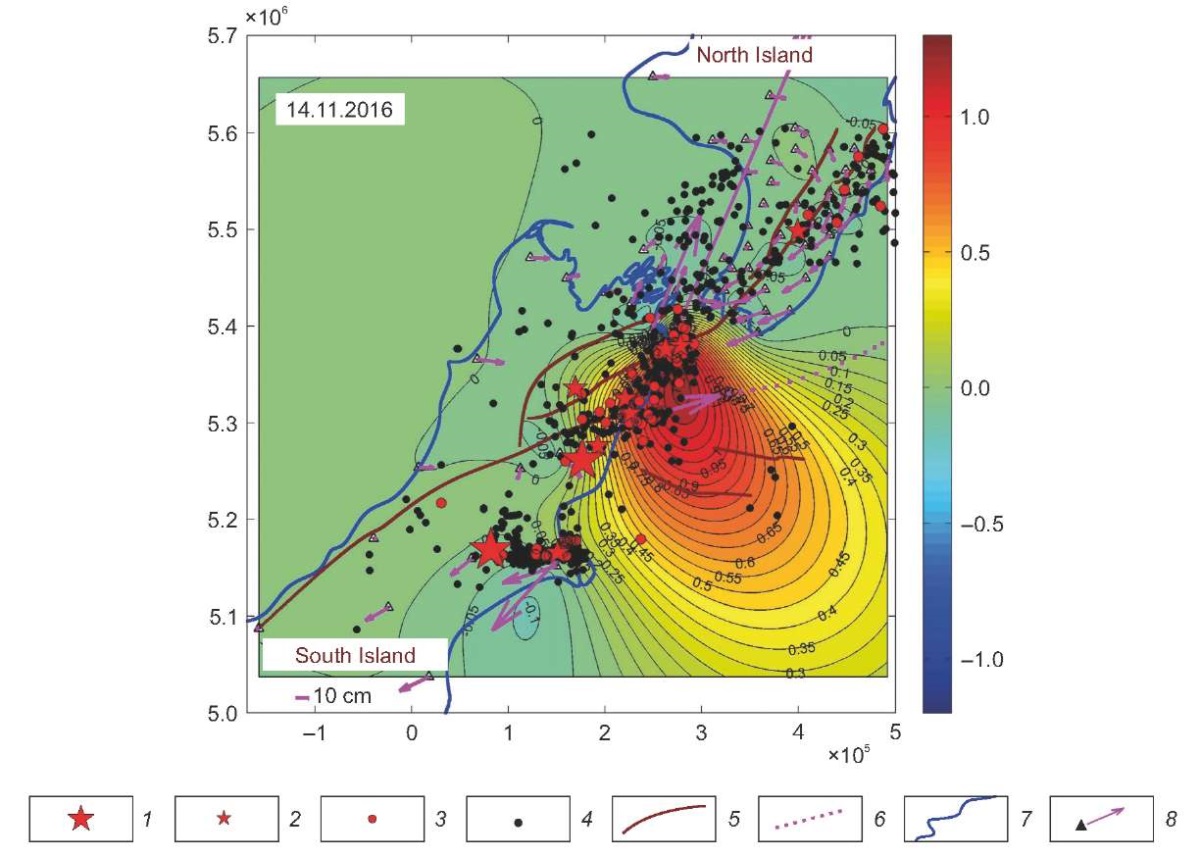
Fig. 9. Horizontal rotation of the southern part of the North Island. See Fig. 3 for notations.
The results show that the southern end of the North Island, throughout the period of observation, experienced clockwise rotation with an average displacement rate of ~1 cm/yr for the points farthest from the center of rotation. This result requires more detailed studies, as it may be a sign of the existence of a seismically active lithospheric vortex [Izosov et al., 2020] whose further study is important for understanding the mechanism of seismotectonic motions and deformations of the Earth’s crust and the physics of earthquakes.
Investigations of recent movements and deformations in the Earth’s crust, related to the strongest earthquakes that occurred in New Zealand, revealed important characteristics of the evolution of the seismodeformation process.
Analysis of the spatiotemporal distribution of the total displacement deformation gives grounds to assume that the three series of the strongest earthquakes of 2010–2016 may be interconnected by a single multi-year deformation process. The beginning of a set of seismic events is caused by the occurrence of an anomalous total by deformation, consistently passing from one series of shocks to another and apparently playing the role of a trigger mechanism [Kaftan, Tatarinov, 2022].
The accumulation of the general maximum of displacement deformation is concentrated directly on the Kaikoura triple junction, in the place of activity of the recently discovered unique object – mantle superplume. The maximum uplift, horizontal displacement vectors, and extension strain are also concentrated there.
Spatial displacements of the areas of maximum deformations and displacement vectors are consistent with the development of the seismic process. No maximum displacements or deformations were recorded in the epicentral zones of the strongest M>7 earthquakes. They are confined to mobile zones destroyed by previous smaller seismic events.
All three series of strongest seismic events were preceded by the occurrence of zones of the crustal inner displacement deficit zones in their future epicenters area. The result provides important information for studies on the forecasting of the strong earthquake occurrence location.
The revealed regularities and characteristics significantly expand knowledge about the evolution of seismodeformation process in the areas of strong crustal earthquakes. The research results show the prospective nature of GNSS observations in solving the problem of vortex geodynamics and plume tectonics in seismically active regions.
All authors made an equivalent contribution to this article, read and approved the final manuscript.
The authors declare that they have no conflicts of interest relevant to this manuscript.
1. Beavan J., Motagh M., Fielding E.J., Donnelly N., Collett D., 2012. Fault Slip Models of the 2010–2011 Canterbury, New Zealand, Earthquakes from Geodetic Data and Observations of Post Seismic Ground Deformation, New Zealand. Journal of Geology and Geophysics 55 (3), 207–221. https://doi.org/10.1080/00288306.2012.697472.
2. Blewitt G., Hammond W.C., Kreemer C., 2018. Harnessing the GPS Data Explosion for Interdisciplinary Science. Eos, 99. https://doi.org/10.1029/2018EO104623.
3. Dokukin P.A., Kaftan V.I., Manevich A.I., Shevchuk R.V., 2023a. Evolution of the Seismic Process and Crustal Total Shear Strain (2008–2021) under the Influence of the Hikurangi Mantle Superplume. ESDB Repository, GCRAS, Moscow. https://doi.org/10.2205/ESDB-Hikurangi-shear.
4. Dokukin P.A., Kaftan V.I., Manevich A.I., Shevchuk R.V., 2023b. Evolution of the Seismic Process and Horizontal Dilatation Strain (2008–2021) under the Influence of the Hikurangi Mantle Superplume. ESDB Repository, GCRAS, Moscow. https://doi.org/10.2205/ESDB-Hikurangi-dilatation.
5. Dokukin P.A., Kaftan V.I., Manevich A.I., Shevchuk R.V., 2023c. Evolution of the Seismic Process and Crustal Movements (2008–2021) under the Influence of the Hikurangi Mantle Superplume. ESDB Repository, GCRAS, Moscow. https://doi.org/10.2205/ESDB-Hikurangi-movement.
6. GNS Science, 2019. GeoNet Aotearoa New Zealand Stations Metadata Repository [Data set]. GNS Science, GeoNet. https://doi.org/10.21420/0VY2-C144.
7. Guo N., Wu Y., Zhang Q., 2022. Coseismic and Pre-Seismic Deformation Characteristics of the 2022 Ms 6.9 Menyuan Earthquake, China. Pure and Applied Geophysics 179, 3177–3190. https://doi.org/10.1007/s00024-022-03128-3.
8. Gvishiani A.D., Tatarinov V.N., Kaftan V.I., Manevich A.I., Minaev V.A., Ustinov S.A., Shevchuk R.V., 2022. Geodynamic Model of the Northern Part of the Nizhnekansk Massif: Fault Tectonics, Deformations, and Insulation Properties of Rock Displacements. Doklady Earth Sciences 507, 909–915. https://doi.org/10.1134/S1028334X22600608.
9. Hamling I.J., D’Anastasio E., Wallace L.M., Ellis S., Motagh M., Samsonov S., Palmer N., Hreinsdóttir S., 2014. Crustal Deformation and Stress Transfer during a Propagating Earthquake Sequence: The 2013 Cook Strait Sequence, Central New Zealand. Journal of Geophysical Research: Solid Earth 119 (7), 6080–6092. https://doi.org/10.1002/2014JB011084.
10. Izosov L.A., Petrishchevsky A.M., Emel’yanova T.A., Chuprynin V.I., Lee N.S., Vasilyeva M.A., 2020. The Model of Formation of the Western Pacific Marginal Seas: Vortex Geodynamics, Seismicity, and Mantle Upwelling. Journal of Volcanology and Seismology 14, 44–57. https://doi.org/10.1134/S0742046320010029.
11. Jiang Z., Huang D., Yuan L., Hassan A., Zhang L., Yang Zh., 2018. Coseismic and Postseismic Deformation Associated with the 2016 Mw 7.8 Kaikoura Earthquake, New Zealand: Fault Movement Investigation and Seismic Hazard Analysis. Earth Planets Space 70, 62. https://doi.org/10.1186/s40623-018-0827-3.
12. Kaftan V.I., Tatarinov V.N., 2022. Registration of Slow Deformation Waves According to GNSS Observations. Doklady Earth Sciences 505, 489–495. https://doi.org/10.1134/S1028334X22070091.
13. Kaiser A., Holden C., Beavan J., Beetham D., Benites R., Celentano A., Collett D., Cousins J., Cubrinovski M., Dellow G., Denys P. et al., 2012. The Mw 6.2 Christchurch Earthquake of February 2011: Preliminary Report. New Zealand Journal of Geology and Geophysics, 55 (1), 67–90. https://doi.org/10.1080/00288306.2011.641182.
14. Langridge R.M., Ries W.F., Litchfield N.J., Villamor P., Van Dissen R.J., Barrellb D.J.A., Rattenbury M.S., Heron D.W., Haubrock S., Townsend D.B., Lee J.M. et al., 2016. The New Zealand Active Faults Database. New Zealand Journal of Geology and Geophysics 59 (1), 86–96. https://doi.org/10.1080/00288306.2015.1112818.
15. Rebetsky Yu.L., 2018. Regularities of Crustal Faulting and Tectonophysical Indicators of Fault Metastability. Geodynamics & Tectonophysics 9 (3), 629–652. https://doi.org/10.5800/GT-2018-9-3-0365.
16. Ristau J., 2010. The Canterbury, New Zealand Earthquake Sequence I: The Mw 7.1 Darfield Earthquake of 3 September 2010 and Aftershock Sequence. Summary of the Bulletin of the International Seismological Centre 47 (7–12), 48–65. https://doi.org/10.5281/zenodo.998755.
17. Shi X., Tapponnier P., Wang T., Wei S., Wang Y., Wang X., Jiao L., 2019. Triple Junction Kinematics Accounts for the 2016 Mw 7.8 Kaikoura Earthquake Rupture Complexity. Proceedings of the National Academy of Sciences 116 (52), 26367–2637. https://doi.org/10.1073/pnas.1916770116.
18. Stern T., Lamb S., Moore J.D.P., Okaya D., Hochmuth K., 2020. High Mantle Seismic P-Wave Speeds as a Signature for Gravitational Spreading of Superplumes. Science Advances 6, 22. https://doi.org/10.1126/sciadv.aba7118.
19. Toraldo Serra E.M., Delouis B., Emolo A., Zollo A., 2013. Combining Strong-Motion, InSAR and GPS Data to Refine the Fault Geometry and Source Kinematics of the 2011, Mw 6.2, Christchurch Earthquake (New Zealand). Geophysical Journal International 194 (3), 1760–1777. https://doi.org/10.1093/gji/ggt186.
20. Ulrich T., Gabriel A.-A., Ampuero J.-P., Xu W., 2019. Dynamic Viability of the 2016 Mw 7.8 Kaikōura Earthquake Cascade on Weak Crustal Faults. Nature Communications 10, 1213. https://doi.org/10.1038/s41467-019-09125-w.
21. Wang T., Jiao L., Tapponnier P., Shi X., Wei S., 2020. Space Imaging Geodesy Reveals near Circular, Coseismic Block Rotation during the 2016 Mw 7.8 Kaikōura Earthquake. New Zealand. Geophysical Research Letters 47 (22), e2020 GL090206. https://doi.org/10.1029/2020GL090206.
22. Wang T., Wei Sh., Shi X., Qiu Q., Li L., Peng D., Weldon R.J., Barbot S., 2018. The 2016 Kaikoura Earthquake: Simultaneous Rupture of the Subduction Interface and Overlying Faults. Earth and Planetary Science Letters 482, 44–51. https://doi.org/10.1016/j.epsl.2017.10.056.
23. Wu J.C., Tang H.W., Chen Y.Q., Li Y.X., 2006. The Current Strain Distribution in the North China Basin of Eastern China by Least-Squares Collocation. Journal of Geodynamics 41 (5), 462–470. https://doi.org/10.1016/j.jog.2006.01.003
3 Molodezhnaya St, Moscow 119296
6 Miklukho-Maklay St, Moscow 117198
3 Molodezhnaya St, Moscow 119296
3 Molodezhnaya St, Moscow 119296; 10-1 Bolshaya Gruzinskaya St, Moscow 123242
3 Molodezhnaya St, Moscow 119296; 10-1 Bolshaya Gruzinskaya St, Moscow 123242
Kaftan V.I., Dokukin P.A., Manevich A.I., Tatarinov V.N., Shevchuk R.V. DEFORMATION INTERACTION OF STRONG EARTHQUAKES OF 2010–2016 IN THE ZONE OF INFLUENCE OF THE HIKURANGA SUPERPLUME (NEW ZEALAND) ACCORDING TO GPS OBSERVATIONS. Geodynamics & Tectonophysics. 2024;15(1):0735. https://doi.org/10.5800/GT-2024-15-1-0735. EDN: IJXYVR


Editor-in-Chief
Sklyarov E.V.664033, Irkutsk, Lermontova St., 128,
IEC SB RAS Institute of the Earth's crust
E-mail.: gt@crust.irk.ru
tel.: 8 3952 425422
Processing of personal data


